OLECTRA: Wave C Bottoming? Big Upside Move Brewing!⚡ OLECTRA – Wave C Completion Zone Hit | Is a Strong Reversal & Wave C Rally Coming?
🧠 Overall Chart Context
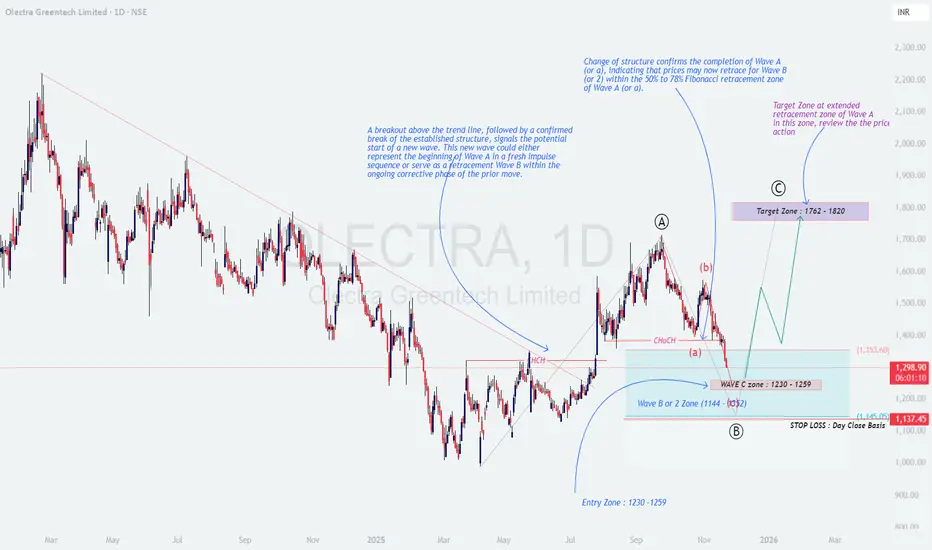
The chart of Olectra Greentech Ltd (1D) shows a well-defined Elliott Wave corrective structure, where price has now entered the expected Wave C completion zone (₹1230–₹1259).
This zone aligns with strong demand + Fibonacci confluence, suggesting a potential end of Wave B/2 and the beginning of a new Wave C impulse.
📌 Price previously made:
A clean Change of Character (ChoCH) → signaling completion of Wave A.
A retracement to the 50–78% retracement zone → forming Wave (b).
A steady fall into Wave C demand zone → now approaching support.
📚 Educational Insights
📘 Change of Structure (ChoCH):
A confirmed break of previous swing highs indicates the first shift from bearish to bullish structure — often the start of new wave formation.
✨ Wave A–B–C Corrections:
Wave B typically retraces 50–78% of Wave A, while Wave C often equals Wave A in size. This structure is playing out perfectly here.
🌀 Extended Retracement Zones:
When prices fall into strong demand (like ₹1230–₹1260), these zones often create big reversal opportunities in impulsive markets.
🎯 Prediction & Targets
If OLECTRA sustains above the ₹1230–₹1259 support zone, a new Wave C rally may unfold.
🎯 First Profit Zone: ₹1,760 – ₹1,820
🎯 Extended Target: ₹1,900+ (if momentum continues)
🛑 Stop Loss: Close below ₹1,137 (invalidates Wave B/2 structure)
💡 Trading Strategy (Educational Purpose Only)
🟢 Entry Zone: ₹1230–₹1259
Wait for reversal candles (hammer, engulfing) or a bullish ChoCH on lower timeframes.
📈 Confirmation:
A break above ₹1,353 strengthens the probability of Wave C starting.
🎯 Targets:
• First Target → ₹1762–₹1820
• Extended Target → ₹1900+
⚖️ Risk Plan:
Risk only 1–2% of capital.
Stick to closing-basis SL at ₹1,137.
🧩 Summary & Outlook
OLECTRA has entered the crucial Wave C completion zone, which is a high-probability reversal area.
If momentum builds from this demand zone, price may begin a fresh Wave C impulse, aiming for ₹1760–₹1820 in the coming weeks.
A breakout above ₹1353 will act as the early confirmation trigger 🔥.
⚠️ Disclaimer
I am not a SEBI-registered analyst.
This analysis is for educational purposes only — not investment advice.
Olectragreentechtrendanalysis
OLECTRA Nice Breakout after consolidating around 6 months."Spotting Opportunity: OLECTRA's Healthy Consolidation Signals a Rounding Bottom Breakout"
For the past six months, our attention has been firmly on OLECTRA, and finally, a promising opportunity is unfolding. Amid a healthy consolidation marked by a rounding bottom, today signifies a pivotal moment. Both the weekly and daily charts for OLECTRA showcase a breakthrough, presenting an opportune time for a strategic, long-term move.
Key Points:
1. Rounding Bottom Consolidation:
- OLECTRA has been undergoing a constructive consolidation, forming a rounding bottom pattern over the past six months. This pattern often indicates a healthy period of stabilization before a potential upward move.
2. Spotting False Breakouts:
- During this consolidation, we've been cautious of false breakouts, but today's development feels different. The rounding bottom pattern enhances the reliability of the breakout signals we're observing.
3. Checking the Charts:
- A meticulous examination of the charts, considering the rounding bottom pattern and utilizing simple indicators, reinforces the authenticity of this breakthrough for OLECTRA on both the weekly and daily charts.
4. It's Official:
- Today is a notable day as both the weekly and daily charts officially confirm that OLECTRA is breaking out of its rounding bottom consolidation. This confirmation provides a green light for a well-timed, longer-term investment.
5. Seizing the Moment:
- With the rounding bottom consolidation adding strength to the breakout, now is an opportune moment to make a thoughtful, long-term investment in OLECTRA. This presents a chance to ride the wave as OLECTRA looks set to ascend.
