Continuation Diamond (Bullish) – ONGC Ltd. (NSE: ONGC)📊 Continuation Diamond (Bullish)
Pattern Type: Bullish Continuation
🧩 Pattern Insight:
The Continuation Diamond (Bullish) pattern forms when a strong uptrend pauses temporarily, creating a diamond-shaped consolidation before resuming higher. This indicates that the market is taking a breather while both bulls and bears attempt control — but eventually, the breakout above the diamond signals a continuation of the prior uptrend.
🧠 Key Takeaway:
This pattern reflects renewed bullish strength after consolidation, suggesting the continuation of a long-term uptrend once the breakout holds above resistance.
⚠️ Disclaimer:
This analysis is for educational and informational purposes only and should not be considered investment advice. Market investments are subject to risks. Please consult your financial advisor before making any investment decisions.
ONGC

ONGC Looking like stock is going to reversal from this zone with 200 ema and 200 dma with Fibonacci retracment levels

GAIL Bullish way ahead?!!!Chart patterns suggest me the above titled opinion
1. Its is travelling in a Ascending channel pattern making Higher highs and higher lows .
2. Now it is at the bottom support loading for the explosive move ahead.
3. Let's wait for the Breakout and enter.
Target levels mentioned in chart...SL update after breakout.
Longer time frames also shows the bullish edge in GAIL
This is just my opinion..... not a tip nor advice!!!!
Thank you!!!

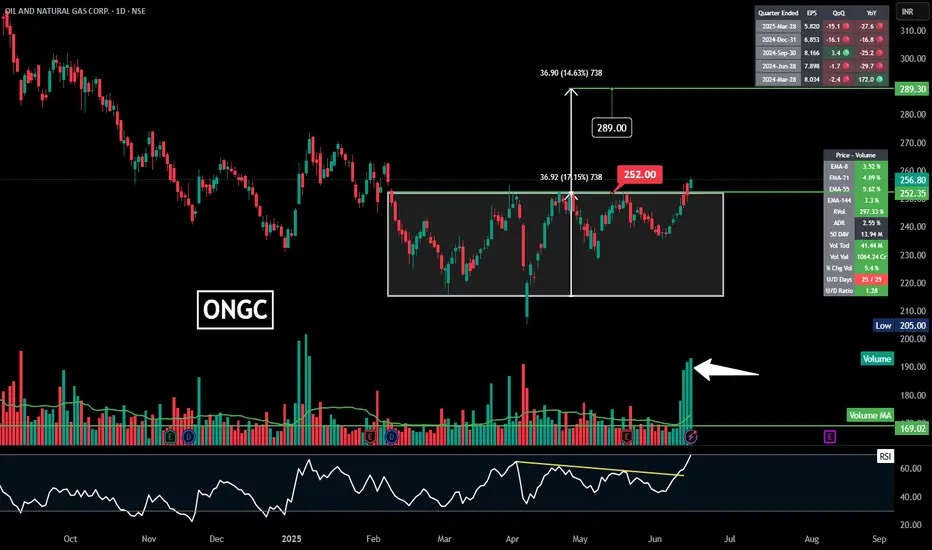
ONGC | Rectangle Range Breakout | Daily🔥 Another strong breakout — this time from **ONGC** — confirming a **Rectangle Range Breakout** pattern.
---
## 🛢️ **ONGC – Rectangle Range Breakout**
### 📍 **Pattern**:
* Consolidation in a **horizontal range** (Rectangle)
* Strong breakout above ₹252 with **massive volume spike**
* Target projected:
₹252 + ₹36.90 = **₹289**
---
### 📈 **Technical Highlights**
* ✅ Price broke out with highest volume spike in months
* ✅ RSI breakout above descending trendline
* ✅ EMA 8/21/55/144 all in bullish alignment
* ✅ Price surged >2% on breakout day with U/D days turning positive (25/25)
---
### 📊 **Volume & RSI Confirmation**
* RSI breaking the bearish trendline = momentum returning
* Volume bar way above average — **high conviction breakout**
* Clean breakout after multiple rejections around ₹252 = **strong resistance flip**
---
### 🚀 **Trade Setup**
* **Entry**: ₹252–₹258 zone
* **Target**: ₹289
* **Stoploss**: ₹238 (or below range bottom for safe positioning)
---
ONGC B/O and retest. Rising fuel price may helpONGC Chart Breakout: A Fresh Opportunity?
After months of downward movement, ONGC seems to have turned the corner.
Here’s what we’re seeing:
Breakout from a falling trendline
Retest completed successfully
Momentum is building up
Higher lows indicate strong demand
What’s the Game Plan?
Entry Zone: Around ₹255–₹258 (current levels)
Target 1: ₹270–₹275
Target 2: ₹290
Target 3: ₹315
Target 4: ₹345 (long-term)
Risk Management
Conservative Stop Loss: ₹245
Aggressive Stop Loss: Below ₹235
This helps manage risk in case the trade doesn’t play out as expected.
Final Thoughts
We’re seeing a technical breakout supported by strong price action and momentum indicators. While short-term volatility is possible, the structure looks strong for a medium-term swing.
This is not a stock recommendation but a technical insight for educational purposes.

Oil and Natural Gas Corporation (ONGC)- LongOil and Natural Gas Corporation (ONGC) on a 15-minute timeframe from NSE, showing an Inverted Head and Shoulders (IHS) pattern. Let’s break it down:
1. Identification of Inverted Head and Shoulders Pattern
Left Shoulder: The first smaller dip before the major drop.
Head: The lowest point in the pattern, indicating the strongest bearish move.
Right Shoulder: A higher low after the head, showing a potential reversal.
Neckline: The resistance level that connects the highs between the shoulders and head. The breakout above this neckline confirms the pattern.
2. Volume Analysis
Volume increases significantly during the breakout, confirming the validity of the pattern.
The rise in volume indicates strong buying interest, which is a bullish sign.
3. Moving Averages (EMA)
The price has crossed above the 200 EMA (purple line), which is a strong bullish signal.
The short-term moving averages (e.g., 9 EMA, 21 EMA) are also trending upwards, further supporting the bullish trend.
4. Entry and Exit Points
Entry: The best entry point is above the neckline breakout level, around 230-231, once confirmed with volume.
Stop-loss: Place a stop-loss just below the right shoulder, around 224-225.
Target (Exit Point): The projected target is calculated by adding the depth of the head to the neckline. This gives a target of around 243-244, which aligns with the previous resistance level (blue line).
Conclusion
The Inverted Head and Shoulders pattern is confirmed with a breakout and volume spike.
Bullish bias as price has crossed above the 200 EMA.
The price is likely to move toward 243-244 INR in the short term.
This analysis is for **educational and informational purposes only** and should not be considered as financial or investment advice. Trading and investing in financial markets involve risk, and past performance is not indicative of future results. Always conduct your own research, consult a qualified financial advisor, and use proper risk management strategies before making any trading decisions. The author is not responsible for any financial losses incurred based on this analysis.

ONGC I OIL Burning Bright : Inverted H&S Pattern!!Hello Traders,
- ONGC is trading at a place called AOI (Area of Interest) A place from where price usually reverses.
- 218 levels is acting as a strong support pushing prices higher after a intraday low of about 3% making a big pin bar candle on 1D chart
- Inverted head and shoulder on 15m timeframe.
PRO TIP/-
The Entry Line is the Neckline of the inverted Head and shoulder.
Target 1:- 228
Target 2 :-231
Entry Criteria
Strong Close above Entry Line (225) 15mins TF
Stoploss
Entry Candle Low (not more than 0.8%)
Not an Investment Advise

ONGC looks good to buy above 275giving trendline breakout and once above the resistance can be bought above 275 with short term target of 290

ONGC RESISTANCE BREAKOUT WEEKLYONGC breaking long time resitance weekly basis
with strong volume building last 2 week
breaking 20 wma,rsi in bullish zone
macd crossover about to happen
#target1 300,breaking 300 #target2 344
NO BUY/SELL RECOMENDATION

ONGC: Prepared for a 20% RallyThe chart of ONGC provides delineates critical price thresholds that signify breakout point, along with specific support level that serve as indicators of where buying interest may manifest.
Additionally, the chart highlights regions likely to act as resistance point for future price ascension, allowing for informed decisions on entry and exit strategies.
Disclaimer: The information contained in this technical analysis report is intended solely for informational and educational purposes. It should not be interpreted as financial advice or a recommendation to buy or sell any security. Investors are strongly encouraged to conduct their own research and consult with a qualified financial advisor before making any investment decisions.

Channel Breakout with Retest Formation, Targeting Strong UpsideDetails:
Asset: Oil and Natural Gas Corporation (ONGC)
Breakout Level: 270
Potential Target: 300+
Stop Loss: Below 270 or as per risk management strategy
Timeframe: Medium-term
Rationale: ONGC is displaying a classic channel breakout with a retest formation, signaling strong bullish potential. Sustaining above the 270 level may trigger a significant upward rally, with the stock poised for robust momentum.
Market Analysis:
Technical Setup: The breakout from the channel, followed by a retest, indicates a confirmed bullish pattern. If sustained, the stock is likely to see a sharp move upward.
Sector Outlook: ONGC, being a leader in energy and oil exploration, benefits from rising crude oil prices and global energy demand. Positive macroeconomic factors further support the stock’s bullish potential.
Price Target:
Short-term: 300
Further Upside: To be determined based on momentum
Risk Management:
Place a stop loss just below 270 to safeguard against unexpected downside moves.
Timeframe:
Expected move to 300 and beyond in the medium term, driven by technical and fundamental catalysts.
Risk-Reward Ratio:
Attractive, with minimal risk near the breakout level and substantial upside potential.
Traders should monitor price action and volume closely for further confirmation and adjust positions based on broader market trends.

#TORNTPOWER 1668 TGT 15% 1940+ NSE:TORNTPOWER
Target 1940 15% upside
NSE:TORNTPOWER CPM 1668
TGT 1940+ (15%)
SL 1550
TF < 6M
If you like my work KINDLY LIKE SHARE & FOLLOW this page for free Stock Recommendations. With 💚 from Rachit Sethia

ONGC Near falling wedge pattern 1: 8 Risk reward long setupOil and Gas sector retested the flag pattern breakout.
ONGC also had retested breakout given earlier and last daily candle showing rise in volume with positive closing.
ONGS also formed falling wedge pattern and we are near breakout of the pattern.
I see 1: 8 potential up side trade.
*SWING TRADE*
Buy ONGC 285
Stop Loss: 279
Target 1 (1:2) 299
Target 2 (1:4) 313
Target 2 (1:6) 325
Target 2 (1:8) 340
_Duration 2-3 months_
Trade as per your risk-taking capacity.

ongc stock is at the end of accumulationg zonehello ongc stock has been last few days consolidation the stock has been accumulated
and now the stock is at the end of the accumulation stage. The price will move higher in the upcoming days
do your own analysis don't enter blindly, and follow the risk management.

Lux Industries Entered Strong Demand AreaLux industries entered into strong demand area and formed doubl bottom as an additional confirmation. All views are my personal, these posts are not a buy/sell recommendation. Contact your financial advisor before taking any buying decisions.

ONGC wave analysisONGC in corrective wave ABC..
of which wave C(5) in progress..
ONGC has cluster of fibonacci ratio support near 281.
and below that next support is 270
Till now low made 282.50
Upside immediate resistance is 302-305
Currently trading sideways..
Buying opportunity :
conservative view : Breaking of 0-2 trendline
Aggressive view : when ONGC makes low near support and MACD gives +ve Diversion.
Being its last C(5) wave so shorters should stay cautious now.
Disclaimer : I am not SEBI registered. Its just the elliott wave analysis posted on chart.

ONGC | Chart Analysis | Demand & Supply ⭕️ Swing Trading opportunity: Price Action Analysis Alert !!!⭕️
💡FNO Stocks Trading📉📈📊
✅Check out my TradingView profile to see how we analyze charts and execute trades.
✅We can't conduct a thorough analysis in such a short span of time. We need to review it, post our findings, and then take action.
🙋♀️🙋♂️If you have any questions about this stock, feel free to reach out to me.
📍📌Thank you for exploring our idea! We hope you found it valuable.
🙏FLLOW for more !
👍LIKE if useful !
✍️COMMENT Below your view !

BEL IS LOOKING BULLISHBEL is looking bullish as its reacted from strong zone. If if closes above 295 more bullishness will be added. These all views are my personal and posting here only for educational purposes. These are not buy/sell recommendations. Better contact your personal financial advisor before go are investing into any stock.

Levels in ONGC "Welcome to SkyTradingZone "
Hello Everyone 👋
Levels in ONGC:
Level 1: Assistant Technician (AT) - ₹21,260 - ₹54,270 per month
Level 2: Technician (T) - ₹24,900 - ₹63,660 per month
Level 3: Junior Assistant (JA) - ₹28,440 - ₹72,900 per month
Level 4: Junior Engineer (JE) - ₹31,090 - ₹83,120 per month
Level 5: Assistant Engineer (AE) - ₹33,540 - ¥93,760 per month
Level 6: Senior Engineer (SE) - ₹37,690 - ¥104,420 per month
Level 7: Senior Manager (SM) - ₹44,990 - ¥121,020 per month
Level 8: General Manager (GM) - ₹51,910 - ¥137,630 per month
8th Hour Wages:
The hourly wage for an ONGC employee at Level 8 is approximately ₹1,232 per hour.

ONGC Levels - Daily TimeframeNSE:ONGC is consolidating near the all time high. Once this consolidation is broken the stock can be traded.

Long on ONGC for Long termThe stock reached ATH of 314.55 on 9th June 2014. It then fell by almost 84% to reach 50 on 13th Mar 2020.
It took support at the lower trend line to reach high of 194.95 on 8th Mar 2022. It faced a correction of almost 38% reaching a 52W low of 119.85. on 6th July 2022.
Recently, it took support from lower end of the channel rising nearly 33.62% in 9 months. Recently it gave a breakout from upper resistance trend line with a large bullish candle rising 4.35% on 10th Apr 2023.
The stock is trading above all short term as well as long term moving averages.RSI is above 60, which indicates bullishness.
Maintain a Stop Loss of 150.55 on daily closing basis.
Potential: 28% to 60%

Bullish break out in the stocks for this week 08/07/2024..
ONGC is a government sector company is trading around the resistance zone. If there is a break out of the consolidation zone good returns can be captured in the stock.
The stock has taken a good support from 20 ema which also gives a confidence to hold the stock for a swing trading.
Even on the daily charts, the stock has test the 200 ema and chance of it clearing the resistance level is high.
A round number figure of 300 can be seen as the next resistance as the stock will be trading in an uncharted zone after the break out.
Kotak bank has been trading in a range and the upper resistance zone is around 2050 levels. The stock is currently trading around 1850 levels and has taken support from both the moving averages on the weekly charts.
If the stock sustain the break out there are chance of it hitting the resistance level soon. The target for trading are there on the chart.
Long term stock positions can also be created in the stock as it seems to show some bullishness.
Wait for the price action near the levels before entering the market.

DIVISLAB and ONGC showing high rise in Future OIDIVISLAB
The price has been consolidating in a narrow range for more than a year.
Recently, the price successfully surpassed its resistance level.
Since the breakout, the price has maintained above the breakout point and is steadily increasing.
The current RSI is above 60, suggesting strong buying pressure.
ONGC
Before, the price was rising steadily, pushing the highs and lows higher.
Since March’24, the price has entered a consolidation phase, and an ascending triangle pattern has been established.
A breakout with significant volume has occurred recently.
The RSI is currently above 60, indicating strong buying pressure.
