HOW DMART COULD BE TRADED ON 1ST OCT1. BIG GAPUP, FOLLOWED BY BIG GREEN CANDLE .
2. PRICE SHOWED THE REAL FACE AFTER LOSING MOMENTUM
3. NOW AFTER BREAKING SUPPORT OPENING PRICE , THE PRICE HAS TO FILL THE UNNECESSARY GAP - UP
4. ON CONFIRMTION A SHORT WAS GIVEN
5. FOR THE TARGET FOR PREVIOUS DAY LOW
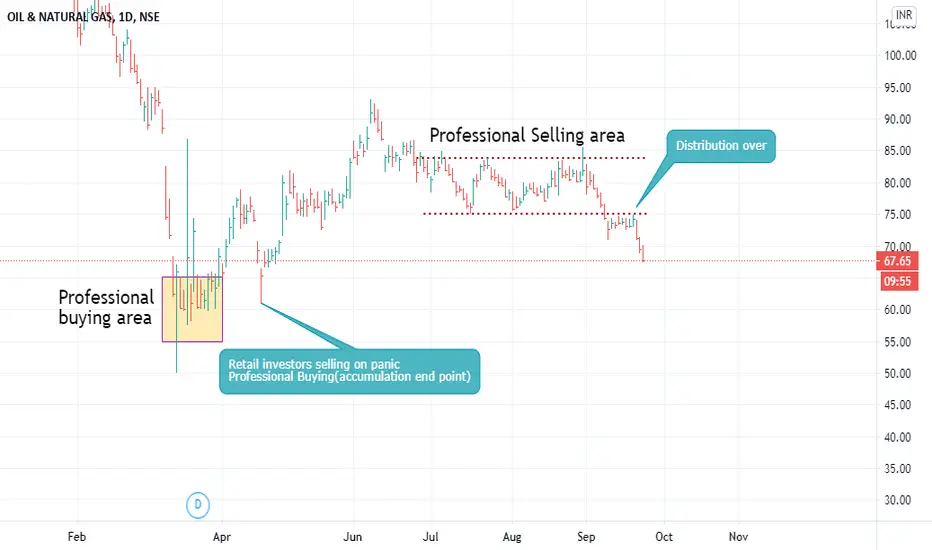
ONGC

ONGC Oct Futa. Zone: Strong Bull
b. Resistance 1: 70.05
c. Resistance 2: 74.8
d. Support 1: 66.30
e. Support 2: 65.96

ONGC end of distributionONGC accumulation and distribution
Like, comment, Donate for more ideas
comment for any specific stock analysis
ONGC BUY signal , Rectangle pattern , Trading is all about skillI will go LONG on ONGC because:
1) The price is forming a Chanel or Rectangle Pattern .
3) The price is also under Support/Resistance zone.
4) It has touched the support and may reach the resistance zone .
5) Target would be the Resistance area . Book profit when it reaches the resistance zone .
Entry - 74
First Target - 84
Second target - 92
Stop loss - 70

ONGC - Getting ready for next free falla. Zone: Strong Bear
b. Resistance 1: 83.20
c. Resistance 2: 91
d. Support 1: 72.80
e. Support 2: 62.40
NSE:ONGC
ONGC is taking rest at its crucial support of 72.80. If it break down this level then next stop will be at 62.4 which is approximately a fall of 15%.


ONGC will blast soon i was BANNED for violating house rule so i am republishing again without any alteration
Bought @ 80.75
Target @ 89.50
lot size = 3750
LIKE if works & Follow

ONGC go long Hi guys this is Trader Kanishk
ONGC Analysis
Points discussed in the video:
Why to go long
has it taken support
trend line breakout
new support levels
new targets
new stop loss levels
entry levels for sharp entry
and many more.
Please
Watch the entire video and
GO for It
DISCLAIMER
Every thing i have discussed in this video is only for educational purpose, do not consider this as a tip, or i am not saying you to buy or sell the stocks. This is all upto you. I am only sharing my analysis and views up to you. Trading is risky, so manage your risk reward before getting enter into any position.
One more very important thing
Guys let me tell you that i am a trader and a trader have a winning probability of 50-65% no any trader is there who have a winning ratio of 100% . Who says you that i am having a 100% winning strategy then F**k these type of people and try to be correct only 50 - 60 % of time which will give you a lot of money if you properly follow the risk reward ratio .

ONGC intraday long TRADE IDEA FOR INTRADAY
levels are on the chart,
as its intraday, these levels are for today only,


Short ONGC - Natural Gas futures crashedNatural gas futures have crashed, ONGC initially rose after market opening but started reacting to gas prices crash.


ONGC to trade sidewaysHi Traders!
Hope you are doing well in markets. My trading strategies might help you to increase returns on investments. My strategy prioritizes safety over exponential profits.
This stock being low in value will give profit or loss on high volume trading. So those who pay high brokerages should either trade in higher volumes to cover brokerages out of their profits. Calculate your cost of trades to find out the break even below placing orders. There are a few scenarios and place your order according to the scenario that you observe in market tomorrow.
Current close: 82.40,
---------------------------------------------------------------------Intraday Traders--------------------------------------------------------------------------------------------
Scenario 1:- Market opens between 81.70 and 82.40.
Strategy: Trade only after first 5 minutes.
Short Selling If price breaches 81.70 then wait for a fall and sell @81.45, Target 80.35-78.75, SL@ 82.20
Buy/Positions If price touches 81.70 and pulls up back then buy @82.00, Target 83.20-84.60, SL@ 81.70
Scenario 2:- Market opens at or below 81.70.
Strategy: Follow Short Selling strategy (Case 1) of Scenario 1.
Scenario 3:- Market opens at or above 82.40 but below 82.90
Strategy: Buy @82.40-82.75, Target of 84.60, SL@ 81.70. If price struggles to cross 83.50 by 1p.m then sqaure off your positions at 83.35-40-45-50.
---------------------------------------------------------------------Intraday Traders--------------------------------------------------------------------------------------------
For positional traders, The ONGC is expected to trade sideays for a few days.
Folowing is your entry point and short term targets for this stock.
Scenario 1: Trigger Price: 80, Buy Price: 80.40, Target: 82.40, - 84.60, - 86.10, - 92.25, Highest Target duration: end of next week.
Scenario 2: Stock doesn't correct: Buy Price@ 82.00-83.00, SL 81.55, Target: 84.60, - 86.10, - 92.25, Highest Target duration: end of next week.

ONGC: Fib RetracementLevels on chart.
Go long above 82.9 for 84, 85.4 (100 DEMA), 86.5 with SL at 82


ONGC TRADE SETUPSupport and resistance lines are drawn, place your targets and stop loss accordingly.
