NIFTY50 Short View11th Feb 2026 / 13:50
Why Short?
1. Breakdown of Range.
2. Within Huge Selloff candle recently.
3. Gaps are visible for downside.
2 different short trade with different targets are in charts.
R/R is favorable
Suggested Options range: 25900 to 25750
Optionsstrategies

BUY TODAY SELL TOMORROW for 5% - BTST STOCK OPTIONDON’T HAVE TIME TO MANAGE YOUR TRADES?
- Take BTST Stock Option trades at 3:25 pm every day
- Try to exit by taking 4-7% profit of each trade
-Resistance Breakout in TRENT
BUY TODAY, SELL TOMORROW for 5%

BUY TODAY SELL TOMORROW for 5% - BTST STOCK OPTIONDON’T HAVE TIME TO MANAGE YOUR TRADES?
- Take BTST Stock Option trades at 3:25 pm every day
- Try to exit by taking 4-7% profit of each trade
-Resistance Breakout in POWERINDIA
BUY TODAY, SELL TOMORROW for 5%

Derivatives and Options TradingWhat Are Derivatives?
A derivative is a financial contract whose value is derived from an underlying asset. The underlying asset can be:
Stocks
Bonds
Commodities (gold, oil, wheat)
Currencies
Interest rates
Market indexes (like the S&P 500 or Nifty 50)
In simple terms, a derivative does not have independent value; its price depends on the value of something else.
Common Types of Derivatives
Futures Contracts
Options Contracts
Forwards Contracts
Swaps
Among these, futures and options are the most actively traded on exchanges.
Purpose of Derivatives
Derivatives serve three main purposes:
1. Hedging (Risk Management)
Hedging is used to reduce or eliminate financial risk. For example, a farmer expecting to harvest wheat in three months may use a futures contract to lock in a selling price today. This protects against the risk of falling prices.
Similarly, investors use options to protect stock portfolios from market downturns.
2. Speculation
Speculators use derivatives to profit from price movements. Because derivatives often require a smaller initial investment (called margin or premium), they provide leverage, allowing traders to control large positions with less capital.
However, leverage increases both potential profits and potential losses.
3. Arbitrage
Arbitrage involves exploiting price differences between markets. Traders buy an asset in one market and sell it in another where the price is higher, locking in a risk-free profit.
Understanding Options
An option is a type of derivative contract that gives the buyer the right, but not the obligation, to buy or sell an underlying asset at a specific price on or before a specific date.
There are two main types of options:
Call Option
Put Option
Call Option
A call option gives the buyer the right to buy an asset at a fixed price (called the strike price) before expiration.
Example:
Stock price: $100
Call option strike price: $105
Expiration: 1 month
If the stock rises to $120, the call option becomes valuable because the buyer can purchase at $105 and potentially sell at $120.
If the stock stays below $105, the option may expire worthless.
Put Option
A put option gives the buyer the right to sell an asset at a fixed price before expiration.
Example:
Stock price: $100
Put strike price: $95
If the stock falls to $70, the put increases in value because the holder can sell at $95 instead of the market price of $70.
If the stock stays above $95, the option may expire worthless.
Key Components of an Option
1. Strike Price
The predetermined price at which the asset can be bought or sold.
2. Expiration Date
The date on which the option contract expires.
3. Premium
The price paid to buy the option. This is the maximum loss for the buyer.
4. Intrinsic Value
The real value if exercised immediately.
5. Time Value
The extra value based on time remaining before expiration.
Option Buyers vs Option Sellers
Option Buyer (Holder)
Pays the premium
Has limited risk (loss = premium paid)
Has unlimited profit potential (for calls)
Option Seller (Writer)
Receives the premium
Has limited profit (premium received)
May face large or unlimited losses
Selling options can be riskier than buying them.
In-the-Money, At-the-Money, Out-of-the-Money
In-the-Money (ITM)
Call: Stock price > Strike price
Put: Stock price < Strike price
At-the-Money (ATM)
Stock price = Strike price
Out-of-the-Money (OTM)
Call: Stock price < Strike price
Put: Stock price > Strike price
Leverage in Options Trading
Options provide leverage because traders control large positions with smaller investments.
Example:
Buying 100 shares at $100 = $10,000 investment
Buying one call option might cost $300
If the stock rises significantly, the percentage return on the option can be much higher than owning the stock directly.
However, if the stock does not move as expected, the option can expire worthless.
Risks in Derivatives and Options Trading
While derivatives provide opportunities, they also involve risks:
1. Market Risk
Price movements can lead to losses.
2. Time Decay (Theta)
Options lose value as expiration approaches.
3. Volatility Risk
Changes in volatility affect option prices.
4. Leverage Risk
Losses can be magnified.
5. Liquidity Risk
Some contracts may be difficult to buy or sell.
Option Pricing Basics
Option prices are influenced by:
Current stock price
Strike price
Time until expiration
Volatility
Interest rates
The Black-Scholes model is commonly used to estimate theoretical option prices.
Popular Options Strategies
Traders use different strategies depending on their outlook.
1. Covered Call
Holding a stock and selling a call against it to earn income.
2. Protective Put
Buying a put to protect a stock position.
3. Straddle
Buying both a call and a put at the same strike price to profit from large moves in either direction.
4. Spread Strategies
Combining multiple options to reduce risk.
Futures vs Options
Feature Futures Options
Obligation Both parties obligated Buyer has right, not obligation
Risk Can be unlimited Buyer risk limited to premium
Upfront Cost Margin required Premium paid
Complexity Moderate More complex
Exchange-Traded vs OTC Derivatives
Exchange-Traded Derivatives
Standardized contracts
Regulated exchanges
Lower counterparty risk
Over-the-Counter (OTC)
Customized contracts
Private agreements
Higher counterparty risk
Importance in Financial Markets
Derivatives increase:
Market efficiency
Price discovery
Liquidity
Risk management capabilities
However, misuse or excessive speculation can cause instability, as seen during the 2008 financial crisis involving complex derivatives like credit default swaps.
Who Uses Derivatives?
Individual traders
Hedge funds
Banks
Corporations
Institutional investors
For example, airlines hedge fuel costs using oil futures, and multinational companies hedge currency risk using forex derivatives.
Conclusion
Derivatives and options trading are powerful financial tools that allow market participants to hedge risk, speculate on price movements, and enhance portfolio returns. Options, in particular, offer flexibility because they provide the right—but not the obligation—to buy or sell an asset at a fixed price.
However, these instruments involve complexity and significant risk, especially due to leverage and time decay. Successful derivatives trading requires strong knowledge, risk management, and disciplined strategy.
In summary, derivatives and options are essential parts of global financial markets. When used wisely, they can reduce risk and create opportunities. When misused, they can lead to substantial financial losses. Understanding their structure, purpose, and risks is the foundation for participating safely and effectively in derivatives markets.

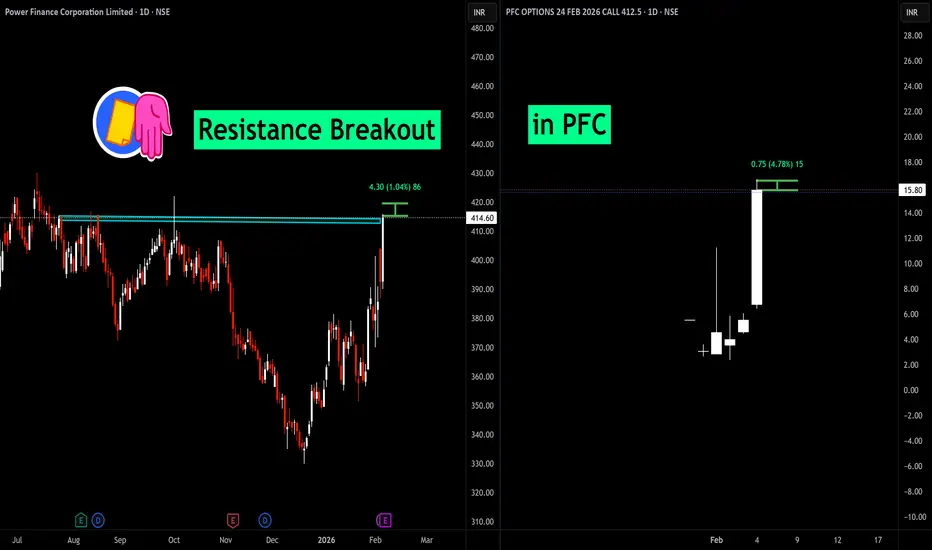
BUY TODAY SELL TOMORROW for 5% - BTST STOCK OPTIONDON’T HAVE TIME TO MANAGE YOUR TRADES?
- Take BTST Stock Option trades at 3:25 pm every day
- Try to exit by taking 4-7% profit of each trade
-Resistance Breakout in PFC
BUY TODAY, SELL TOMORROW for 5%
Option Selling Strategies – Complete Guide1. Introduction to Option Selling
Option selling, also known as option writing, is a strategy where a trader sells (writes) options to earn premium income. Unlike option buyers, who need a strong price move to profit, option sellers benefit when the market moves sideways, slowly trends, or even slightly moves against them.
In option selling, time decay (Theta) works in your favor. Every passing day reduces the option’s value, allowing sellers to profit even if price does nothing.
However, option selling involves high risk if not managed properly, which is why it is considered a professional strategy, best used with strict risk management.
2. Why Traders Prefer Option Selling
Most professional traders prefer option selling because:
• Higher probability of profit (60–80%)
• Income generation through time decay
• Works best in range-bound markets
• Consistent returns if risk is controlled
Statistically, options expire worthless most of the time, which benefits sellers.
But remember:
Option selling gives small, consistent profits but can lead to large losses if risk is ignored.
3. Key Concepts Every Option Seller Must Know
Before strategies, you must understand:
a) Time Decay (Theta)
Time decay accelerates in the last 2–3 weeks before expiry. Sellers earn as option value melts daily.
b) Implied Volatility (IV)
• Sell options when IV is high
• Avoid selling when IV is extremely low
High IV means higher premium.
c) Margin Requirement
Option selling requires large margin, especially naked selling.
d) Risk Management
Never sell options without a hedge unless you’re highly experienced.
4. Popular Option Selling Strategies
4.1 Short Call (Naked Call Selling)
Market View: Bearish or sideways
Instrument: Sell Call option
How it Works:
You sell a call option expecting the price to stay below the strike price.
Example:
NIFTY at 22,000
Sell 22,200 CE
If NIFTY stays below 22,200 → profit = premium received.
Pros:
• High probability
• Fast premium decay
Cons:
• Unlimited loss if market rallies
• Requires high margin
👉 Best for experienced traders only.
4.2 Short Put (Naked Put Selling)
Market View: Bullish or sideways
Instrument: Sell Put option
How it Works:
You sell a put option expecting the price to stay above the strike price.
Example:
NIFTY at 22,000
Sell 21,800 PE
If NIFTY stays above 21,800 → profit = premium.
Pros:
• Works well in rising markets
• Time decay advantage
Cons:
• Large downside risk
• High margin requirement
4.3 Covered Call Strategy
Market View: Mildly bullish or sideways
Risk Level: Low
How it Works:
You hold shares and sell a call option against them.
Example:
You own 100 shares of RELIANCE
Sell OTM call option
You earn:
• Option premium
• Dividends (if any)
Pros:
• Limited risk
• Extra income on holdings
Cons:
• Upside capped
👉 Very popular among long-term investors.
4.4 Cash Secured Put
Market View: Bullish
Risk Level: Medium
How it Works:
You sell a put while keeping enough cash to buy shares if assigned.
Example:
Sell TCS 3,600 PE
Keep funds ready to buy TCS if assigned.
Pros:
• Safe way to enter stocks
• Premium reduces buying cost
Cons:
• Capital intensive
4.5 Bear Call Spread (Call Credit Spread)
Market View: Bearish or sideways
Risk Level: Limited
How it Works:
• Sell lower strike call
• Buy higher strike call
Example:
Sell 22,200 CE
Buy 22,400 CE
Pros:
• Limited loss
• Lower margin
• Ideal for beginners
Cons:
• Limited profit
4.6 Bull Put Spread (Put Credit Spread)
Market View: Bullish or sideways
Risk Level: Limited
How it Works:
• Sell higher strike put
• Buy lower strike put
Example:
Sell 21,800 PE
Buy 21,600 PE
Pros:
• Defined risk
• Works well in trending markets
4.7 Iron Condor
Market View: Range-bound
Risk Level: Limited
Structure:
• Sell OTM Call
• Buy further OTM Call
• Sell OTM Put
• Buy further OTM Put
Profit Zone:
Price must stay within a defined range.
Pros:
• High probability
• Risk limited
• Stable income strategy
Cons:
• Small profit
• Needs adjustment if breakout occurs
4.8 Iron Butterfly
Market View: Very low volatility
Profit: Maximum at ATM
This is an advanced strategy where both call and put are sold at ATM.
5. Best Time to Use Option Selling
✔ When market is range-bound
✔ When IV is high
✔ During weekly expiry
✔ After major news events
Avoid selling before:
❌ Budget
❌ RBI policy
❌ Global events
6. Risk Management Rules for Option Sellers
This is the most important section.
Golden Rules:
Always define max loss
Use stop-loss
Prefer hedged strategies
Avoid over-trading
Risk only 1–2% capital per trade
Exit early if target achieved
Never sell options emotionally
7. Psychology of Option Selling
Option selling tests patience and discipline.
• Small daily profits feel easy
• One bad trade can wipe weeks of gains
• Overconfidence is dangerous
Successful option sellers:
✔ Follow system
✔ Accept small losses
✔ Think in probabilities
8. Conclusion
Option selling is one of the most powerful ways to generate consistent income in the stock market when done correctly. It suits traders who understand probability, volatility, and risk management.
For beginners, start with:
• Credit spreads
• Covered calls
• Iron Condors
Avoid naked selling until you gain experience.
Remember:
Option selling is not about predicting the market, but managing risk while letting time work for you.

BUY TODAY SELL TOMORROW for 5% - BTST STOCK OPTIONyesterday
DON’T HAVE TIME TO MANAGE YOUR TRADES?
- Take BTST Stock Option trades at 3:25 pm every day
- Try to exit by taking 4-7% profit of each trade
-Resistance Breakout in ABB
BUY TODAY, SELL TOMORROW for 5%

BUY TODAY SELL TOMORROW for 5% - BTST STOCK OPTIONDON’T HAVE TIME TO MANAGE YOUR TRADES?
- Take BTST Stock Option trades at 3:25 pm every day
- Try to exit by taking 4-7% profit of each trade
-Cup & Handle Breakout in SOLARINDS
BUY TODAY, SELL TOMORROW for 5%

Part 3 Institutional Option Trading Vs. Technical Analysis What Are Options?
Options are derivative contracts whose value is derived from an underlying asset like index (Nifty, Bank Nifty), stocks, commodities, currencies, etc.
They give you the right, but not the obligation, to buy or sell the underlying at a fixed price before a specific date.
Options are mainly of two types:
Call Option (CE): Right to BUY
Put Option (PE): Right to SELL
They are widely used by traders for hedging, speculation, income generation, and risk management.

BUY TODAY SELL TOMORROW for 5% - BTST STOCK OPTIONDON’T HAVE TIME TO MANAGE YOUR TRADES?
- Take BTST Stock Option trades at 3:25 pm every day
- Try to exit by taking 4-7% profit of each trade
-Cup & Handle Breakout in DALBHARAT
BUY TODAY, SELL TOMORROW for 5%

BUY TODAY SELL TOMORROW for 5% - BTST STOCK OPTIONDON’T HAVE TIME TO MANAGE YOUR TRADES?
- Take BTST Stock Option trades at 3:25 pm every day
- Try to exit by taking 4-7% profit of each trade
-Cup & Handle Breakout in DALBHARAT
BUY TODAY, SELL TOMORROW for 5%

INDUSINDBK | Weekly Bullish Options Setup | 27 Jan ExpiryTrade Structure (Text Format)
• Sell 960 PE
• Buy 940 PE
• Defined-risk Bull Put Spread
NSE:INDUSINDBK
Why this setup works
INDUSINDBK is holding above the short-term support zone around 950 after a strong bounce. Price is trading above key moving averages, momentum is improving, and RSI is comfortably above the mid-zone.
Put-side OI is building near 950–960, suggesting strong downside support. With IV elevated, selling puts via a spread offers attractive risk-reward with defined downside.
View
Moderately bullish — expecting INDUSINDBK to stay above 950 and trend sideways to higher over the week.
This post is for education only. It’s not financial advice or a recommendation to trade.
#WeeklyOptions #BullishSetup #BullPutSpread #INDUSINDBK #BankNiftyStocks #NSEOptions #OptionsTradingIndia #PriceAction

CIPLA | Weekly Bearish Options Setup | 27 Jan ExpiryTrade Structure (Text Format)
• Sell 1400 CE
• Buy 1420 CE
• Defined-risk Bear Call Spread
NSE:CIPLA
Why this setup works
CIPLA is trading below the short-term trend with price failing to sustain above the 1400 zone. The recent bounce has been sold into, RSI remains weak below the mid-line, and momentum continues to fade.
Call-side OI is building around the 1400 strike, indicating strong overhead supply. With IV holding steady, call spreads offer a favourable risk-defined way to express a bearish-to-neutral view.
View
Moderately bearish — expecting CIPLA to stay below 1400 and drift sideways to lower over the week.
This post is for education only. It’s not financial advice or a recommendation to trade.
#WeeklyOptions #BearishSetup #BearCallSpread #CIPLA #NSEOptions #OptionsTradingIndia #PriceAction #StockMarketIndia #RMInvestech

Eternal Ltd – Sell Into Strength, Buy Only After Structure Conf
• CMP: ₹299.25
• Recent bounce is corrective, not impulsive — price still trading inside a broader downtrend
• Rally is running into supply near the 200 EMA / breakdown zone (~₹300–310)
• Volume expansion looks like short covering, not fresh accumulation
• This move lacks follow-through characteristics of a true trend reversal
🎯 Trade Logic
• Sell / Avoid longs into ₹300–310 zone — supply likely to cap upside
• Buy planning only if:
– Price pushes toward ₹310
– Then retraces and stabilizes in ₹305–300 range
📍 Planned Long Setup (Only on Retest):
• Entry Zone: ₹305–300
• Stop-Loss: ₹295
• Structure-based entry, not momentum chasing
💡 What most see as “breakout energy” still reads like distribution to me. I’d rather pay higher for confirmation than get early into a weak structure.
#Eternal #TradePlanning #PriceAction #RiskFirst #NSEStocks #MarketStructure #TradingView

BUY TODAY SELL TOMORROW for 5% - BTST STOCK OPTIONDON’T HAVE TIME TO MANAGE YOUR TRADES?
- Take BTST Stock Option trades at 3:25 pm every day
- Try to exit by taking 4-7% profit of each trade
-Resistance Breakout in ASIANPAINT
BUY TODAY, SELL TOMORROW for 5%
O

BUY TODAY SELL TOMORROW for 5% - BTST STOCK OPTIONDON’T HAVE TIME TO MANAGE YOUR TRADES?
- Take BTST Stock Option trades at 3:25 pm every day
- Try to exit by taking 4-7% profit of each trade
-Resistance Breakout in ASIANPAINT
BUY TODAY, SELL TOMORROW for 5%

JUBLFOOD | Weekly Bearish Options Setup | 27 Jan ExpiryTrade Structure (Text Format)
• Sell 515 PE
• Buy 525 PE
• Defined-risk Bear Put Spread
Why this setup works NSE:JUBLFOOD
JUBLFOOD is trading below key short-term averages with price struggling to hold above the 520 zone. Momentum remains weak, RSI is slipping below the mid-band, and every bounce is facing selling pressure.
Put-side OI is shifting lower, suggesting downside risk remains open. With decent IV, debit spreads offer controlled risk for a directional bearish view.
View
Moderately bearish — expecting JUBLFOOD to stay below 520 and drift lower or remain under pressure.
This post is for education only. It’s not financial advice or a recommendation to trade.
#WeeklyOptions #BearishSetup #BearPutSpread #OptionsTradingIndia #NSEOptions #PriceAction #OptionsStrategy #StockMarketIndia #RMInvestech

Option Trading Advanced StrategiesA. Option Buyer
The buyer pays a premium to purchase a call or put.
Rights: Has the right, not the obligation, to exercise the option.
Risk: Limited to the premium paid.
Reward: Potentially unlimited (for calls) or large (for puts).
B. Option Seller (Writer)
The seller receives the premium upfront.
Obligation: Must fulfill the contract if the buyer exercises it.
Risk: Very high (sometimes unlimited).
Reward: Limited to premium collected.
Option sellers typically have higher probability strategies but higher margin and high risk.

BUY TODAY SELL TOMORROW for 5% - BTST STOCK OPTIONDON’T HAVE TIME TO MANAGE YOUR TRADES?
- Take BTST Stock Option trades at 3:25 pm every day
- Try to exit by taking 4-7% profit of each trade
-Resistance Breakout inTATAELXSI
BUY TODAY, SELL TOMORROW for 5%

BUY TODAY SELL TOMORROW for 5% - BTST STOCK OPTIONDON’T HAVE TIME TO MANAGE YOUR TRADES?
- Take BTST Stock Option trades at 3:25 pm every day
- Try to exit by taking 4-7% profit of each trade
-Resistance Breakout in DIVISLAB
BUY TODAY, SELL TOMORROW for 5%
D

BUY TODAY SELL TOMORROW for 5% - BTST STOCK OPTIONDON’T HAVE TIME TO MANAGE YOUR TRADES?
- Take BTST Stock Option trades at 3:25 pm every day
- Try to exit by taking 4-7% profit of each trade
-Trendline Breakout in NESTLEIND
BUY TODAY, SELL TOMORROW for 5%

BUY TODAY SELL TOMORROW for 5% - BTST STOCK OPTIONDON’T HAVE TIME TO MANAGE YOUR TRADES?
- Take BTST Stock Option trades at 3:25 pm every day
- Try to exit by taking 4-7% profit of each trade
- Resistance Breakout in BOSCHLTD
BUY TODAY, SELL TOMORROW for 5%
B

BUY TODAY SELL TOMORROW for 5% - BTST STOCK OPTIONDON’T HAVE TIME TO MANAGE YOUR TRADES?
- Take BTST Stock Option trades at 3:25 pm every day
- Try to exit by taking 4-7% profit of each trade
- Head & Shoulder Breakout in IIFL
BUY TODAY, SELL TOMORROW for 5%
N
