RELIANCE – Short Covering Fueling a Reversal?📈 RELIANCE – Short Covering Fueling a Reversal?
🔍 Heavy Action Across 1500–1570 CEs | Bullish Reversal on the Cards?
Chart Type: 15-min / 1H / Daily
Indicators: STWP Zones, Option Chain Activity, Volume Clusters, Demand-Supply
🔹 What’s Catching Our Eye?
✅ Aggressive Long Build-Up across multiple CEs (1550–1580)
✅ Massive Short Covering on 1500–1530 Calls – Bears exiting fast
✅ Huge OI Additions at 1550, 1560, 1570 CEs – Smart money positioning ahead?
✅ Put Writers Building Base at 1500–1520 PE → Strong support developing
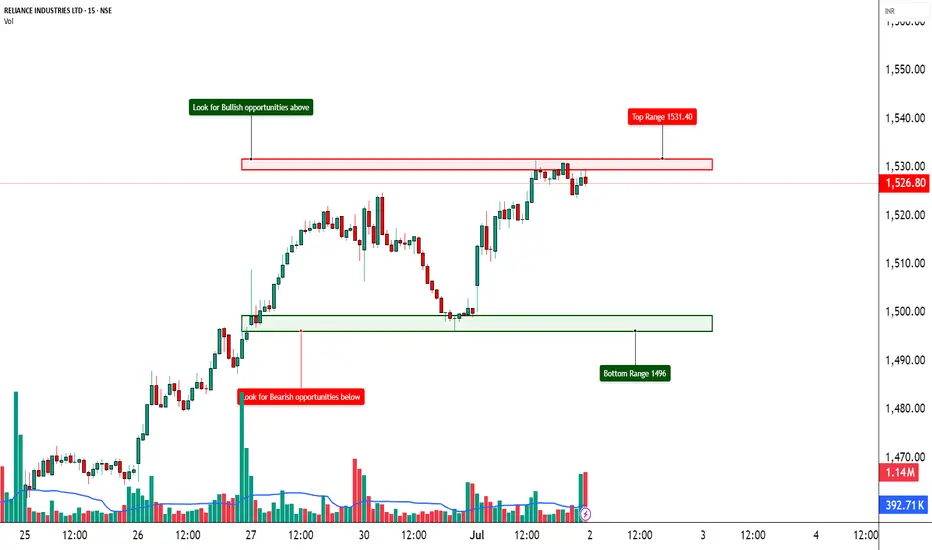
✅ Spot Price at ₹1528.4 – Right at the heart of breakout zone
✅ IVs remain in control (~15.9–16.3%) = room for expansion
📊 What We’re Watching for:
📍 Breakout Zone: 1530–1540
📍 Targets: 1560 → 1580 → 1600
📍 Invalidation Below: 1490
📍 Momentum Confirmation: Price closing above 1540 with volume & OI spike
📍 Option Chain Support: 1500 PE (OI: 29.3L) + short build-up in multiple puts
📌 Trade Plan (Educational Purpose Only):
🔹 Bullish Idea: Buy above 1530–1540 with SL below 1490
🔹 Options Play: 1550 or 1560 CE suitable for short-term directional trades
🔹 Positional Angle: Momentum may sustain toward 1600 if 1540 holds
⚠️ Disclaimer:
This post is for educational and learning purposes only.
It does not constitute buy/sell advice or investment recommendation.
Always consult your financial advisor before taking any positions.
STWP is not liable for any financial decisions based on this content.
📚 “When bears cover in panic, bulls prepare their charge.”
💬 What’s your take on Reliance? Is 1600 on the radar, or is this just a squeeze?
Optionstrading
HAL – Ready for a Lift-Off?📈 HAL – Ready for a Lift-Off?
🔍 Bullish Action Heating Up | Option Chain + Price Action Analysis
Chart Type: 15-min / 1H / Daily
Indicators: STWP Zones, Volume, Demand-Supply, OI Analysis
🔹 What’s Catching Our Eye?
✅ Strong Long Build-Up at 5000, 5100 & 4950 Calls – Signs of institutional interest
✅ Short Covering at 4900 & 5200 CE – Shorts getting out = bullish continuation likely
✅ Highest OI at 5000 CE with +7.53% OI change = psychological breakout zone
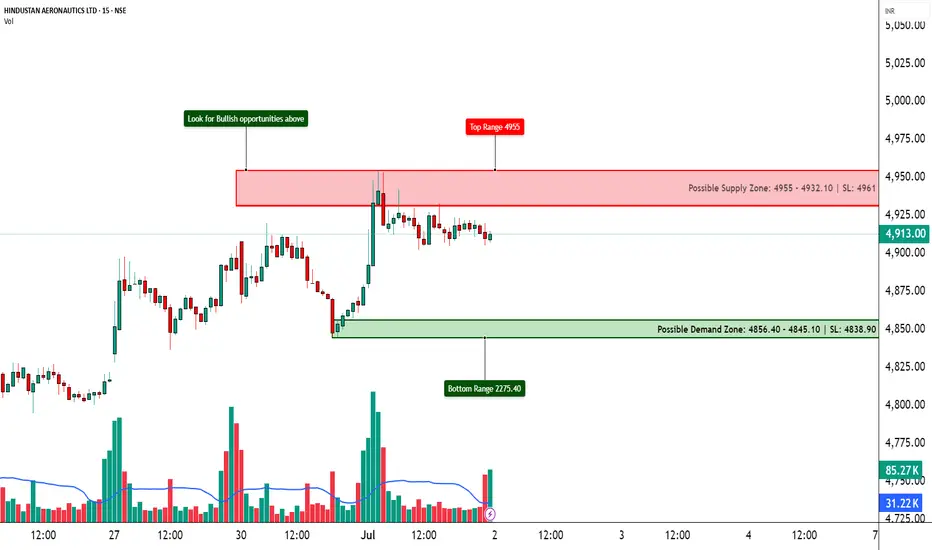
✅ Spot Price at ₹4912 approaching key round-level resistance
✅ IV stable around 29.4%–29.7% → Room for volatility expansion if breakout happens
📊 What We’re Watching for:
📍 Breakout Zone: 4950–5000
📍 Targets: 5050 → 5100 → 5200
📍 Invalidation Below: 4850
📍 Momentum Confirmation: Sustained price close above 5000 with volume + OI surge
📍 Option Chain Bias: 5000 CE leading in build-up, supporting bullish sentiment
📌 Trade Plan (Educational Purpose Only):
🔹 Bullish: Buy above 4950 breakout with SL below 4850
🔹 Options: Consider 5000 or 5100 CE depending on your risk-reward
🔹 BTST/Positional Type: If price sustains above 4950–5000 with aggressive volumes
⚠️ Disclaimer:
This post is for educational and learning purposes only.
It does not constitute buy/sell advice or investment recommendation.
Always consult your financial advisor before taking any positions.
STWP is not liable for any financial decisions based on this content.
📚 “Smart money seems to be fueling the engines here.”
💬 Is HAL cleared for take-off above 5000? Or is it facing turbulence ahead?
APOLLOHOSP – Preparing for the Next Breakout ?📈 APOLLOHOSP – Preparing for the Next Breakout?
🔍 Bullish Setup Unfolding | Option Chain + Price Action Analysis
Chart Type: 15-min / 1H / Daily
Indicators: STWP Zones, Volume, Demand-Supply, Price Action
🔹 What’s Catching Our Eye?
✅ Strong Long Build-Up across 7500–8000 Calls
✅ Heavy Put Writing at 7500, 7400, and even 7000
✅ Volatility Expansion + Rising OI = Possible Range Expansion Move
✅ Clean Demand Zone at 7400–7450 with a Morning Star Bounce (if visible)
✅ ATM Call (7500 CE) up 124% with +38% OI – Institutions possibly preparing for an up move!
📊 What We’re Watching for:
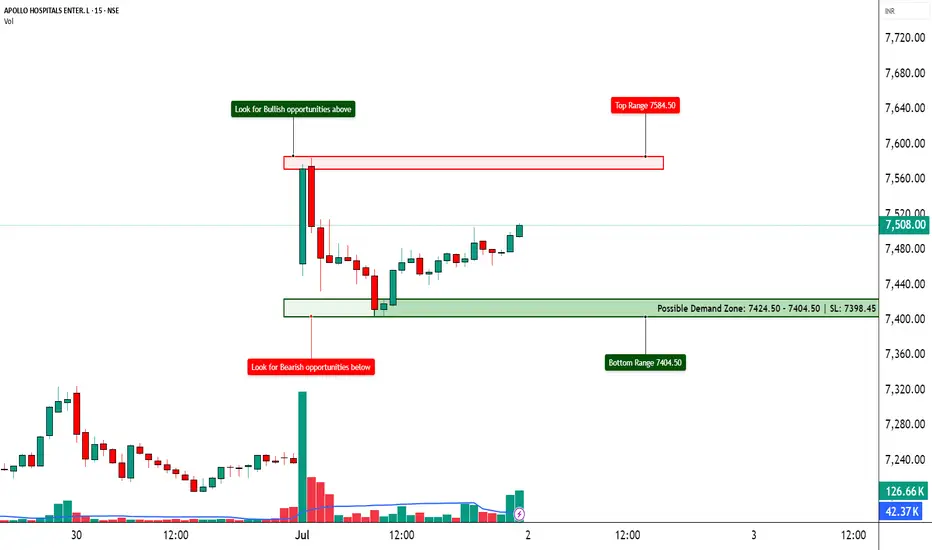
📍 Trigger Level: 7520–7550 Breakout
📍 Targets: 7600 → 7700 → 7800
📍 Invalidation Below: 7420
📍 Momentum Confirmation: Price closing above 7550 with volume spike
📍 Option Chain Support: 7000–7400 (Heavy PE writing)
📌 Trade Plan (Educational Purpose Only):
🔹 Bullish: Buy on breakout above 7550 with SL below 7440
🔹 Options: Consider 7600 or 7700 CE based on risk profile
🔹 BTST Type: If price holds 7500–7520 till close
⚠️ Disclaimer:
This post is for educational and learning purposes only.
It does not constitute buy/sell advice or investment recommendation.
Always consult your financial advisor before taking any positions.
STWP is not liable for any financial decisions based on this content.
📚 "Let Data Drive the Trade – Not Emotion!"
💬 What's your take on ApolloHosp? Bullish ride or trap zone?
Institutional Option Trading Part -6Institutional trading and investing significantly differ from retail activities. Institutions trade in large volumes, use complex strategies, and have access to exclusive information and tools. This guide will provide a comprehensive overview of institutional option trading, investing, and general trading practices, detailing their methodologies, tools, and market impacts.
Understanding Institutional Investors
Institutional investors include mutual funds, hedge funds, pension funds, insurance companies, and large banks. These entities manage vast sums of money, often on behalf of others, and possess substantial market influence.
Key Characteristics:
Large Capital Base: Institutions trade in millions or billions.
Market Influence: Their trades can impact prices significantly.
Professional Resources: Access to cutting-edge research, proprietary algorithms, and high-speed trading platforms.

When to Exit a Trade: Exit Plan for Every Trading Style!Hello Traders!
Every trade type needs a different kind of exit plan — but most traders use one-size-fits-all. That’s why they either exit too soon or too late.
Today, I’ll break down how to plan your exits based on trade type and intention .
A smart exit plan fits the nature of the trade — not just your emotion in the moment.
Exit Plan for Swing Trades
Target Based: Pre-decide 1:2 or 1:3 risk-reward levels.
Trailing SL (Candle Based): Move SL below each higher low in uptrend.
Exit on Structure Break: If price breaks key swing low, exit immediately.
Exit Plan for Positional Trades
Weekly Chart View: Exit only if weekly trend changes or closes below trendline.
Partial Booking: Book some profits at resistance zones, hold rest for trend continuation.
News/Events SL: Avoid holding through uncertain events unless strategy-backed.
Exit Plan for Long-Term Trades (Investment Trades)
Fundamental Exit: Exit only if company fundamentals weaken or story changes.
Valuation-Based Exit: Exit when valuations are stretched beyond long-term average.
Exit in Phases: Don’t exit fully — scale out in parts across 10-20% intervals.
Exit Plan for Breakout Trades
Multi-Year Breakout: Hold till price holds above breakout zone on weekly chart.
2-Week Breakout: Use previous resistance as SL. Exit if it fails to sustain above it.
Volume Confirmation: Exit if breakout happens on weak volume and fails to follow through.
Exit Plan for Options Trades
Defined SL in Premium: Keep strict SL (e.g., ₹30 loss on ₹100 premium).
Time-Based Exit: Exit if expected move doesn’t come by your time window.
Theta Decay Watch: Exit early if holding beyond 2–3 days and premium drops without move.
Momentum Exit: Trail SL tightly once premiums start shooting.
Rahul’s Tip
Don’t treat every trade the same. Swing, positional, long-term — each needs its own exit discipline.
Your plan should depend on chart timeframe, reason for entry, and trade type — not just emotions.
Conclusion
Your exit strategy should match your trade type, not just your mood.
Once you start using the right exit logic for the right trade, your results will become more consistent, more powerful, and way less stressful.
Thanks for reading!
If this helped bring clarity, do like, share and follow for more trading insights made simple.
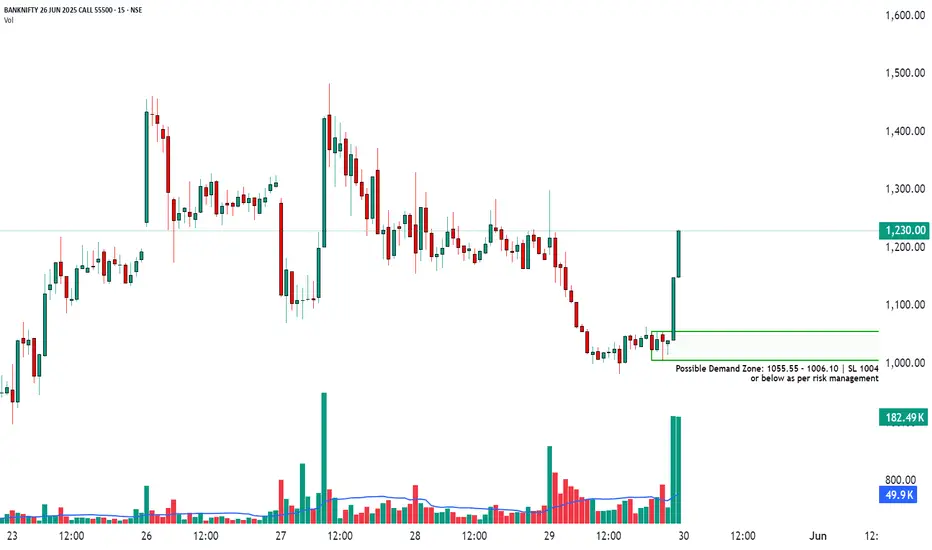
How to Trade Bank Nifty Options Using Demand Zones📈 BANKNIFTY 55500ce
📆 Date: May 29, 2025
🔍 Timeframe: 15 minute
How to Trade Bank Nifty Options Using Demand Zones
Understanding and effectively applying demand zones can significantly improve your success in trading Bank Nifty options. This approach provides a structured method to identify high-probability trades and implement disciplined risk management.
________________________________________
Why Use Demand Zones in Options Trading?
• Enables entry closer to strong support, improving reward-to-risk ratios
• Acts as a key confluence area for price action and volume
• Encourages disciplined entries based on market structure
• Helps set clear, logical stop-loss levels
________________________________________
Strategy: Two Ways to Trade Demand Zones
1. Conservative Approach – Wait for Price to Enter the Zone
Steps:
• Allow price to dip into the defined demand zone (between 1055.55 – 1006.10)
• Wait for reversal confirmation, such as:
• Bullish engulfing or a strong green candle
• Increased volume or optional bullish divergence
• Enter a Call Option (CE) position once confirmation is visible
• Place stop-loss just below the zone (e.g., ₹1004)
• Target 1: Immediate resistance or recent swing high
• Target 2: Option premium expansion based on implied volatility and price momentum
Why this works: Buying at a value zone aligns you with potential institutional demand and provides a favorable entry with limited downside.
________________________________________
2. Aggressive Approach – Trade From the Top of the Zone
Steps:
• Enter when the price first touches the top of the demand zone (around 1055.55)
• Use a tight stop-loss just below the zone (e.g., 1004)
• Consider smaller position sizing to adjust for higher entry risk
• Monitor for immediate bounce—exit quickly if no reaction follows
Why this works: Offers better reward if the demand zone holds and price reacts quickly. This is suitable for experienced traders who can act decisively.
________________________________________
Risk Management – Non-Negotiable
• Always follow stop-loss discipline based on the demand zone
• Keep position sizing conservative, risking only 1%–2% of your total capital
• Avoid overtrading; focus on high-quality, high-probability setups
• Select ATM or slightly OTM options (e.g., 55500 CE or 55600 CE) for better delta and responsiveness
________________________________________
Volume Confirmation – An Extra Edge
• Volume spikes near the demand zone strengthen the validity of the level
• If volume is absent, avoid the trade or reduce your size
• Institutional buying often reveals itself through volume near key support levels
________________________________________
Trade Entry Checklist
• Is price currently in or very near the marked demand zone?
• Is volume showing increased activity?
• Is the overall market trend favorable for calls?
• Are external/global market cues supportive (especially for intraday trades)?
• Is the risk-to-reward ratio at least 1:2?
________________________________________
Educational Recap
• Demand zones act as critical areas where strong buying interest may emerge
• Wait for price to enter the zone; avoid chasing entries
• Focus on structured risk control over trying to predict every move
• Use candlestick structure, volume analysis, and context to improve your setup quality
________________________________________
Final Thoughts
Trading Bank Nifty options with demand zones instills structure, clarity, and discipline. This approach is ideal for intraday or short-term swing traders who rely on technical precision.
The objective is not to trade frequently, but to trade at the right levels with defined risk and potential reward. Let the market come to your setup and respond with a plan—never react emotionally.
This framework reduces noise, avoids emotional trades, and helps you align with institutional buying zones with a strong edge.
⚠️ Risk Management Tip: Always trade with a clearly defined stop loss. Avoid entering positions impulsively. It is advisable to start with a smaller quantity and increase your exposure only if the price action confirms the continuation of the trend. Capital protection should always be the priority.
📢 Disclaimer
This content is created purely for educational and informational purposes. It is not intended as investment advice, stock recommendations, or trading tips. Trading and investing in the stock market involves risk. Please consult with a SEBI-registered financial advisor before making any investment decisions. The author/creator is not registered with SEBI and shall not be held responsible for any losses incurred based on this information. Always do your own research and use proper risk management.
👉 If you found this analysis helpful, don’t forget to Follow, so you never miss out on a trade-worthy setup, breakout opportunity, or valuable educational insight again. Stay updated and trade smarter! 💡📈
Banknifty 2025-2026 (Expected level)Banknifty. (Only for Experienced traders" )
Enter after " Breakout and Retracement ".
Leave a " Like If you agree ".✌.
Follow for regular updates 👍
.
For " long "
entry: 56000 / 56500
target: 60000- 62350
stoploss: 54800
Enter only if market Breaks
"Yellow box" mentioned.
.
.
For " Short"
entry: 54000
target:51000- 49500
stoploss: 54600
Enter only if market Breaks
"Yellow box" mentioned.
.
Wait for proper reversal and conformation.
.
Don't make complicated trade set-up.📈📉
Keep it " Simple, Focus on Consistency "💹.
Refer our old ideas for accuracy rate🧑💻.
Valuable comments are welcomed-✌️
.
.
Disclaimer:
Our Trading style is not to capture "10-20" points per trade.📊
We take entry only for min "200-300" points without any distractions.💹
So, our ideas may not be preferable for small traders, who just focusing on too much of support and resistance.📈📉📈
So, please consider others ideas.
This is for educational purposes.🧑💻

banknifty 30.04.25Expecting a gap down opening and maybe a downward movement. However, I will stick to Buy on Dips until and unless there is something I see on OF or MP. Will be carefully looking for any signs of absorption or trapping of sellers

Bank nifty Futures 24.04.25Expecting a flat to a gap up opening. More likely a neutral/ balanced day. Buyers are going to struggle but may defend. So, need to be careful and watch OF and MP. We may get movement on both sides.

VWAP+Trendline+Option OI – Deadly Intraday Setup You Must Learn!Hello Traders!
Want a setup that combines price action + smart money data + intraday structure ? This is one of my go-to setups for intraday trading that aligns logic with real market strength. If you’re struggling with random entries or early stop-loss hits, this VWAP + Trendline + OI Setup could change the game for you.
Why This Combo Works?
VWAP: Shows intraday average price where volume is traded — a key level institutions watch.
Trendline: Identifies dynamic support/resistance and the structure of the market move.
Option Chain OI: Reveals where the big players are writing or exiting positions in real-time.
How to Use This Setup Effectively
Mark Trendline on 5–15 min Chart:
Plot rising/falling trendline based on swing highs/lows.
VWAP Re-Test or Bounce:
Look for price to respect VWAP and trendline together. Avoid entries far from VWAP.
Check Option Chain for OI Confirmation:
At breakout/bounce level, check if PE (for upmove) or CE (for downmove) is getting unwound, and opposite side is building.
Entry & Exit:
Enter on candle confirmation (engulfing, breakout candle).
SL = below trendline or VWAP.
Target = next resistance/support or 1:2 RR.
When It Works Best
Between 9:30 AM – 11:30 AM and Post 1:30 PM:
Volatility is clear, and smart money flows are easier to read.
Low News Days:
Best when no big data releases are expected.
During Expiry Days (with caution):
OI shift gives clearer confirmation on trending or trapping moves.
Rahul’s Tip
Let VWAP guide you, trendline frame you, and OI validate you. When all 3 align, it’s no longer a guess — it’s precision.
Conclusion
This deadly combo of VWAP, Trendline, and Option OI shift gives you structure, strength, and confirmation — everything a smart intraday trader needs. Backtest this setup, follow your rules, and stop trading blindly.
Have you tried combining VWAP and OI in your trading? Share your tweaks in the comments below!

Avoid IV Crush–This Simple Setup Helps Option Buyers Stay Alive!Hello Traders!
Have you ever bought a perfect options trade… only to see the price go nowhere despite the stock moving in your direction? That’s IV Crush — every option buyer’s worst enemy. But don’t worry — if you learn to read Implied Volatility (IV) and use event-based setups wisely , you can avoid this trap and stay profitable.
Let’s decode how you can protect yourself with one simple but powerful method.
What is IV Crush?
IV Crush happens after events: Like results, RBI policy, US Fed speech, or budget day — when uncertainty disappears, IV drops sharply .
Premiums deflate even if the move happens: This kills option buyers because the expected move is already priced in.
Mostly affects straddles, strangles, and directional trades placed right before the event.
The Simple Setup to Avoid It
Don’t buy options right before big events unless you expect a move bigger than the IV is pricing.
Buy options when IV is low + breakout is expected (triangle, flag, consolidation). Avoid high IV situations.
Use IV charts or tools to compare current IV vs. historical IV: If IV is abnormally high, expect a crush after the event.
Enter after the event is done if direction is clear — IV drops, premiums are cheaper, and the trend is real.
Rahul’s Tip
Trade clarity, not hype. Events bring emotion — but we trade structure. Wait, watch IV, and strike when the odds are with you.
Conclusion
IV Crush can wipe out good trades if you don’t respect volatility cycles. Learn to read IV, align it with price action and timing , and your option buying game will completely change.
Ever got trapped in an IV crush? Share your experience below – let’s grow smarter together!

Stop-Loss vs. Hedging: Which Protects Your Capital Better?Hello Traders!
Today, let’s dive into the debate of Stop-Loss vs. Hedging . Both strategies are used to protect capital, but they serve different purposes and suit different types of traders. Let’s explore which one is better for your trading style.
Stop-Loss: Cutting Losses Early
A Stop-Loss is a predefined order that automatically exits a trade when the price reaches a certain level, helping traders limit losses. Here’s why it’s useful:
Automatic Risk Management : Helps avoid emotional decision-making by exiting losing trades automatically.
Best for Short-Term Traders : Ideal for intraday and swing traders who need quick risk control.
Simple and Easy to Implement : No complex strategy needed, just setting a stop-loss order.
Hedging: A Strategic Protection
Hedging is a technique where traders take offsetting positions to minimize risk while staying invested. Here’s why it’s powerful:
Reduces Market Volatility Impact : Helps smooth out losses by using options, futures, or inverse ETFs.
Best for Long-Term Investors : Suitable for portfolio managers and options traders looking to hedge risks.
Protects Without Exiting : Unlike a stop-loss, hedging allows you to stay in a position while minimizing potential losses.
Striking the Balance: Stop-Loss + Hedging
The best traders often use a combination of both. Here’s how to balance these strategies effectively:
Use Stop-Loss for short-term trades where capital protection is crucial.
Apply Hedging for long-term holdings to mitigate risk without selling assets.
Diversify strategies to manage different types of market risks efficiently.
Conclusion: Choose What Fits Your Strategy
If you are a short-term trader , a Stop-Loss will help you control losses efficiently. If you are a long-term investor , Hedging provides better protection while keeping your investments intact.
What’s your preference – Stop-Loss or Hedging? Let’s discuss in the comments below!

Option Buying, Selling & Hedging: Key Nifty Strategies
Hey traders! Today, we’re diving into the exciting world of options trading. We’ll compare three key strategies: Option Buying , Option Selling , and Option Hedging . Let’s break them down with a real-time example of Nifty options and understand how each of them works.
Option Buying (Call Option)
Trade Details:
Strike Price: 22950 CE
Expiry Date: 27th February 2025
Premium: 191
Probability of Profit: 33.36%
Maximum Profit: Undefined
Maximum Loss: 14,325 (-99.85%)
Breakeven Point: 23141.0
Payoff Chart Analysis:
When you buy a Call Option , your loss is limited to the premium you paid (14,325).
The profit potential is unlimited if the underlying asset (Nifty) moves significantly higher.
The payoff chart shows a steep upward curve , indicating significant profit if the market goes up, but also highlighting the steep loss if the market doesn’t move in your favor.
Option Selling (Put Option)
Trade Details:
Strike Price: 22950 PE
Expiry Date: 27th February 2025
Premium: 189.6
Probability of Profit: 61.54%
Maximum Profit: 14,220 (7.41%)
Maximum Loss: Undefined
Breakeven Point: 22761.0
Payoff Chart Analysis:
When you sell a Put Option , you receive premium upfront and aim to profit from minimal market movement.
Maximum loss is potentially unlimited if the market falls drastically.
Profit is capped at the premium received (14,220), making it a strategy suited for range-bound markets .
The payoff chart shows a gradual upward slope , with limited profit potential and high risk if the market moves sharply lower.
Option Hedging (Buy and Sell Combination)
Trade Details:
Sell Put Option (22950 PE) at 189.6
Buy Put Option (22850 PE) at 146.65
Net Credit: 3,221 (7.72%)
Maximum Loss: 4,279 (-10.26%)
Breakeven Point: 22908.0
Payoff Chart Analysis:
Option Hedging involves combining option buying and option selling to limit risk while maintaining profit potential.
The maximum loss is capped , which is crucial for managing risk in volatile markets.
This strategy offers moderate profit (3,221) with a relatively higher probability of profit (50.49%).
The risk-to-reward ratio (1:0.75) suggests a more balanced approach than buying or selling options alone.
Real-World Application:
Option Hedging is beneficial when you expect volatility but want to control potential losses by limiting exposure.
Example: Combining a short Put with a long Put to create a bullish or neutral strategy in uncertain market conditions.
Key Comparisons
Profit Potential:
Buying options offers unlimited profit .
Selling options offers limited profit but carries unlimited risk .
Hedging offers a moderate profit with capped loss , balancing risk and reward.
Risk and Loss:
Buying options has a limited loss (premium paid).
Selling options exposes you to unlimited loss .
Hedging reduces risk by capping both profit and loss, offering more control.
Probability of Profit:
Selling options usually has a higher probability of profit due to premium collection .
Buying options typically has a lower probability due to the need for significant market movement.
Hedging strikes a balance, with 50.49% probability of profit .
Break-even Point:
For option buyers , the break-even point is above the strike price, meaning the underlying asset needs to rise substantially for you to profit.
For option sellers , the break-even point is lower than the strike price, meaning the underlying asset can drop slightly before you start losing money.
Hedging combines both, providing a controlled risk environment.
Real-World Application
Option Buying (Call):
Great for when you expect sharp upward moves .
Example: You buy a Call option because you believe the market is going to soar, and you want to capture that upside.
Option Selling (Put):
Ideal for stable or slightly bullish markets .
Example: You sell a Put option because you believe the market will stay the same or rise slightly, and you’re comfortable taking the risk in exchange for the premium.
Option Hedging:
Perfect when you expect volatility but don’t want to take on excessive risk.
Example: You combine a short Put with a long Put to create a bullish or neutral strategy in uncertain market conditions.
Risk Management Considerations
For Option Buying:
Know your maximum loss (the premium you paid) and never risk more than you can afford to lose.
Control your risk by picking options that fit your risk tolerance and market expectations.
For Option Selling:
Ensure you have enough margin to cover potential losses.
Always be aware of the unlimited risk that comes with selling options.
For Hedging:
Balance risk and reward effectively by using both buying and selling strategies.
Helps you minimize the impact of extreme market movements while still being in the game.
Conclusion
All three strategies— Option Buying , Option Selling , and Option Hedging —have their pros and cons. The best one for you depends on your market outlook, risk tolerance, and trading goals.
What strategy do you prefer? Let me know in the comments!

ICICI Bank Ltd stock LongICICI Bank Ltd. is a leading private-sector bank in India, offering a wide range of banking and financial services. Here's a comprehensive analysis of its stock performance and financial health:
**Stock Performance:**
- **Current Price:** As of February 17, 2025, ICICI Bank's share price is ₹1,260.10. citeturn0search7
- **52-Week Range:** The stock has traded between ₹1,023.35 and ₹1,362.35 over the past year, indicating significant volatility. citeturn0search7
- **Recent Performance:** Over the last six months, the share price has increased by 7.85%, and over the past year, it has risen by 23.56%. citeturn0search7
**Financial Highlights:**
- **Earnings Per Share (EPS):** In the quarter ending January 25, 2025, ICICI Bank reported an EPS of $0.387, surpassing the consensus estimate of $0.379. citeturn0search6
- **Net Interest Income (NII):** The bank has experienced a 9% increase in NII, reflecting robust growth in its core lending operations. citeturn0search1
- **Profit After Tax (PAT):** There has been a 15% rise in PAT, indicating improved profitability. citeturn0search1
**Valuation Metrics:**
- **Price-to-Earnings (P/E) Ratio:** ICICI Bank's P/E ratio stands at 17.70, suggesting the stock is trading at a reasonable multiple relative to its earnings. citeturn0search2
- **Price-to-Book (P/B) Ratio:** The P/B ratio is 3.31, indicating the stock is valued at over three times its book value. citeturn0search2
- **Return on Equity (ROE):** The bank's ROE is 17.49%, reflecting efficient use of shareholders' equity to generate profits. citeturn0search2
**Dividend Information:**
- **Dividend Yield:** ICICI Bank offers an annual dividend of $0.202, translating to a yield of approximately 0.7%. citeturn0search6
**Institutional Ownership:**
- **Ownership Structure:** Approximately 75.21% of ICICI Bank's shares are held by institutional investors, indicating strong institutional confidence in the bank's prospects. citeturn0search5
**Analyst Insights:**
- **Analyst Consensus:** The stock holds a "Moderate Buy" rating, with an average price target of $35.50, suggesting a potential upside of 21.74%. citeturn0search6
- **Smart Score:** ICICI Bank has a Smart Score of 8, indicating it is expected to outperform the market. citeturn0search6
**Recent Developments:**
- **Relative Strength Rating:** The bank's ADRs received an upgrade in their Relative Strength Rating from 70 to 75, reflecting improved stock performance relative to peers. citeturn0news13
**Conclusion:**
ICICI Bank demonstrates strong financial performance, with significant growth in earnings and net interest income. The stock is trading at reasonable valuation multiples, supported by robust institutional ownership and favorable analyst ratings. Investors should consider these factors when evaluating ICICI Bank as a potential investment.

what is Trading psychology and why it is important in trading ?**Trading psychology** refers to the emotional and mental factors that influence a trader's decision-making process and behavior while trading. It plays a huge role in whether a trader will be successful or not. Understanding trading psychology is essential because trading isn't just about numbers and charts—it's about **managing your emotions**, **mindset**, and **behavior** during both good and bad times in the market.
Let’s break it down further in simple terms:
**What is Trading Psychology?**
Trading psychology is all about how **emotions** and **mental states** influence trading decisions. It involves understanding your psychological responses to different situations like **fear**, **greed**, **excitement**, and **stress** while making trades.
Some key emotions in trading psychology include:
- **Fear**: The fear of losing money or missing out (FOMO) can lead traders to make impulsive decisions.
- **Greed**: The desire for quick profits can lead to overtrading or ignoring risk management.
- **Hope**: Sometimes, traders hold onto losing positions because they **hope** the market will turn in their favor.
- **Regret**: After a trade goes wrong, traders often experience regret and may make emotional decisions in the future to compensate for past losses.
- **Confidence**: Confidence can be good but can also turn into overconfidence, leading to risky or uncalculated decisions.
Why is Trading Psychology Important?**
1. **Helps Control Emotions**
The financial markets can be highly volatile and unpredictable, which can trigger emotional reactions like **fear** or **greed**. Managing these emotions is crucial for making **logical**, not **emotional**, decisions. When you let emotions guide your trades, you’re more likely to make impulsive decisions, which can lead to poor performance.
2. **Avoiding Emotional Trading**
Emotional trading often leads to mistakes. For example, after a loss, a trader might try to "revenge trade" (take unnecessary risks to recover losses), or after a big win, they may become **overconfident** and start taking more risks. Trading with **discipline** and **patience** is key to long-term success.
3. **Helps Stick to Your Trading Plan**
Traders often create a strategy or trading plan based on **logic** and **technical analysis**, but when emotions take over, they might ignore their plan. Trading psychology helps you stick to your plan, even when market conditions become challenging.
4. **Improves Risk Management**
Proper risk management is crucial in trading, and **psychological discipline** helps you to stick to it. Traders can get carried away by the excitement of a profitable trade or by the anxiety of a losing streak. By managing emotions, traders are more likely to stick to predefined **stop losses** and **risk-to-reward ratios**, preventing large losses and protecting their capital.
5. **Minimizes Stress**
Trading can be **stressful**, especially in volatile markets. Learning to manage emotions can reduce the stress and help you make clearer, more focused decisions, leading to a better trading experience overall.
**Common Psychological Mistakes in Trading**
1. **Fear of Missing Out (FOMO)**
FOMO occurs when a trader feels the pressure to enter a trade because they’re worried about missing out on a potential profit. This often leads to entering trades without proper analysis or jumping in after a price has already moved significantly, increasing the risk of loss.
2. **Overtrading**
Sometimes, traders become overly eager or emotional, leading them to take more trades than necessary. Overtrading can be a result of **greed** or **impatience**, and it increases transaction costs and risks.
3. **Revenge Trading**
After a losing trade, some traders want to "get back" at the market by taking **bigger risks** in an attempt to recover their losses. This is often driven by negative emotions such as anger or frustration, which can cloud judgment and lead to poor decisions.
4. **Loss Aversion**
Loss aversion is the tendency to fear losses more than we value gains. Traders who experience loss aversion may hesitate to cut their losses and hold onto losing positions for too long, hoping the market will turn around. This can lead to even bigger losses.
5. **Overconfidence**
After a few successful trades, some traders might feel **invincible** and become overly confident in their abilities. This can lead to taking **larger risks** or ignoring market signals, which increases the likelihood of losing trades.
**How to Improve Your Trading Psychology**
1. **Develop a Trading Plan**
Having a clear, written plan that includes entry and exit rules, risk management strategies, and goals will help keep your trading focused and reduce emotional decision-making.
2. **Stick to Your Strategy**
Trust in your trading plan and avoid making impulsive decisions based on emotions. Discipline is key. If your strategy isn’t working, **adjust it** based on **data** and **analysis**, not emotions.
3. **Manage Risk**
Use stop losses and set realistic risk-to-reward ratios for each trade. This limits potential losses and prevents emotional overreaction when things go wrong.
4. **Take Breaks**
Trading can be mentally exhausting. Take regular breaks to keep your mind fresh and avoid emotional burnout. This will also help prevent emotional overtrading.
5. **Reflect on Past Trades**
Keep a **trading journal** to reflect on your past trades, both wins and losses. This will help you learn from mistakes, understand your emotional reactions, and improve your decision-making over time.
6. Practice Emotional Control
Practice mindfulness and emotional control techniques. Being aware of your emotions and how they affect your trading can help you better manage stress and fear. Techniques like deep breathing, meditation, or even taking a walk can help reset your mind during tough moments.
In Summary
Trading psychology is incredibly important because **how you think and feel** about trading directly impacts your performance. It’s not just about **technical indicators** or **charts**; your **emotions** and **mindset** play a huge role in whether you succeed or fail. By learning to **manage your emotions**, **stick to your strategy**, and **control your risks**, you increase your chances of long-term success in the market.

What is RSI divergence and how it is useful in trading ?RSI Divergence is a concept used by traders to spot potential reversals in the price direction of a stock or asset by comparing how the price moves with the **Relative Strength Index (RSI)**.
Let’s break it down in a simple, human-friendly way.
### What is RSI (Relative Strength Index)?
RSI is a tool that helps traders figure out if a stock is **overbought** or **oversold**. It’s a number that ranges from 0 to 100:
- **Above 70**: The stock is considered overbought (potentially too expensive or ready for a drop).
- **Below 30**: The stock is considered oversold (potentially too cheap or ready for a bounce).
The RSI helps you understand how strong or weak a stock’s price move is.
---
### What is Divergence?
**Divergence** happens when the price of an asset and the RSI are not moving in the same direction. This could be a red flag (warning sign) or a signal that the price is about to change direction.
There are two main types of divergence to look for:
#### 1. Bullish Divergence (Potential Buy Signal)
This happens when the **price makes a lower low**, but the **RSI makes a higher low**. In simpler terms:
- The price is going down, but the RSI is showing signs of strength (it's going up).
- This tells you that even though the price is dropping, the selling pressure might be losing steam, suggesting a potential **reversal to the upside**.
**Example:**
- The stock price hits $50, goes down to $45 (lower low).
- The RSI moves from 20 to 25 (higher low).
- This difference (divergence) suggests that the downward trend might be ending, and a bounce up could happen soon.
#### 2. Bearish Divergence (Potential Sell Signal)
This happens when the **price makes a higher high**, but the **RSI makes a lower high**. In simple terms:
- The price keeps going up, but the RSI shows weakness (it’s going down).
- This suggests that even though the price is rising, the buying pressure is fading, and the market might reverse to the downside.
**Example:**
- The stock price hits $100, goes up to $105 (higher high).
- The RSI moves from 70 to 60 (lower high).
- This divergence indicates that the price might be overbought and could soon start dropping.
---
### How is RSI Divergence Useful in Trading?
RSI Divergence helps traders by:
- **Spotting potential reversals**: If a price trend (either up or down) isn’t supported by the RSI, it can indicate that the trend is losing momentum. This could be a warning that a change in direction is coming.
- **Identifying overbought/oversold conditions**: Divergence can signal that the asset has gone too far in one direction. For example, a **bullish divergence** could tell you the stock has been oversold and might be ready to bounce back up, while a **bearish divergence** could suggest that the stock is overbought and might fall.
- **Timing entries and exits**: By using divergence, you can find good points to buy (during a bullish divergence) or sell (during a bearish divergence) before the trend changes.
---
### In a Nutshell
RSI Divergence is like a signal that tells you when a stock or asset might be about to stop going in the same direction and start reversing. By spotting these signals early, traders can make smarter decisions about when to buy or sell.

learn option chain analysis basic to advanceOption chain analysis is a crucial tool for traders, especially in the stock and derivatives markets, to gauge the sentiment of the market, understand price trends, and make informed decisions. Below is a basic to advanced breakdown of option chain analysis:
**Basic Concepts of Option Chain**
An **Option Chain** is a list of all the available options (both calls and puts) for a specific stock or index, usually presented in a table format. It shows the strike prices, expiry dates, open interest, volumes, bid-ask prices, and implied volatility.
#### **Key Components:**
1. **Strike Price**: The price at which the option holder can buy (call) or sell (put) the underlying asset.
2. **Expiry Date**: The date on which the option contract expires. Options can have different expiry dates, typically weekly, monthly, or quarterly.
3. **Open Interest (OI)**: The total number of outstanding contracts (either calls or puts) for a particular strike price. A high OI suggests that there is strong interest in that particular strike price, which can be used to gauge liquidity.
4. **Volume**: The total number of contracts traded during a specific period. Higher volume suggests increased activity and potential price movements.
5. **Bid-Ask Spread**: The difference between the highest price a buyer is willing to pay (bid) and the lowest price a seller is willing to accept (ask). A smaller spread indicates higher liquidity.
6. **Implied Volatility (IV)**: A measure of the market's expectation of future volatility in the stock or index. Higher implied volatility generally leads to higher premiums for options.
---
### **Intermediate Level Analysis**
At this level, we’ll delve into more nuanced indicators that help make sense of how the market is likely to move.
#### **1. Put-Call Open Interest Ratio (PCR)**
- **PCR (Put-Call Ratio)** is a ratio of open interest in put options to that in call options. It is an indicator of market sentiment.
- **PCR > 1**: More puts are being bought, indicating a bearish sentiment.
- **PCR < 1**: More calls are being bought, indicating a bullish sentiment.
- **Neutral Range**: PCR around 0.7 to 1 is considered neutral.
#### **2. Max Pain Theory**
- **Max Pain** refers to the price at which the most number of options (puts and calls combined) will expire worthless, causing the highest amount of pain to option holders. This is a critical level where the option chain suggests a price point that the market may target by expiry.
#### **3. Open Interest and Volume Analysis**
- A **Rising Open Interest** indicates that new positions are being created, either long or short. If the price rises with increasing OI, it suggests that the upward trend may continue.
- **Decreasing Open Interest** with rising prices suggests short covering.
- **Volume Analysis**: If the volume is high on a particular strike price, it suggests that traders are actively taking positions at that strike, which can offer insights into possible support or resistance levels.
#### **4. Implied Volatility Skew**
- The difference in implied volatility across different strike prices or expirations is known as the **IV Skew**. If the implied volatility is higher for out-of-the-money (OTM) calls or puts, it suggests that the market is expecting a potential move in the underlying asset.
---
### **Advanced Level Analysis**
At the advanced level, you would look deeper into the options data and develop a strategy based on more sophisticated patterns and trading signals.
#### **1. Analyzing Unusual Option Activity**
- **Unusual Option Activity** refers to a significant increase in volume and open interest in a specific strike price or expiry date that stands out compared to the historical averages.
- **Bullish Activity**: Large volumes in short-term out-of-the-money calls could indicate a potential breakout.
- **Bearish Activity**: A surge in put options or large purchases of protective puts may indicate an upcoming decline.
#### **2. Options Greeks**
The Greeks are important metrics that help understand the sensitivities of an option’s price relative to changes in market conditions:
- **Delta**: Measures the sensitivity of the option’s price to changes in the underlying asset’s price.
- A **delta of 0.5** means the option price moves 0.5 points for every 1-point change in the stock price.
- **Gamma**: The rate of change of Delta in response to price movements. It measures the acceleration of the option’s price change.
- **Theta**: The rate at which an option’s price decreases as it approaches expiration (time decay). For example, an option with high Theta loses value rapidly as it nears expiry.
- **Vega**: Measures the sensitivity of an option’s price to changes in the volatility of the underlying asset. Higher Vega means the option is more sensitive to volatility changes.
- **Rho**: Measures the sensitivity of an option’s price to changes in interest rates. This is important when market interest rates change or during central bank announcements.
#### **3. Support and Resistance Based on Option Chain Data**
- **Strike Price with High Open Interest**: Strike prices with significant OI often act as **support** (for puts) or **resistance** (for calls). For example, if a lot of open interest is at a certain strike price, the market may try to stay above or below that level by expiry.
- **Max Pain and Pinning**: The stock price may "pin" around a specific strike price (close to max pain) as market makers hedge their positions leading into expiration.
#### **4. Advanced Option Chain Patterns**
- **Bearish/Bullish Divergence**: If the underlying asset is trending higher, but open interest in put options rises significantly, it may indicate an impending reversal or bearish divergence.
- **Long Straddle/Strangle Setup**: This strategy involves buying both a call and put option at the same strike price (straddle) or different strike prices (strangle) when expecting high volatility but unsure of the direction. Option chain analysis helps you find strike prices where this strategy might be profitable.
#### **5. Implied vs. Historical Volatility**
- Comparing **Implied Volatility** (IV) with **Historical Volatility (HV)** can provide insights into whether options are expensive or cheap. If IV is higher than HV, options are overpriced, and if IV is lower than HV, options may be underpriced, signaling potential buying opportunities.
---
### **Putting It All Together**
**Example**: If you're analyzing an option chain for a stock and notice:
- **High OI** in calls at a specific strike price, with the stock trading near that price.
- **PCR (Put-Call Ratio)** is low, indicating bullish sentiment.
- The stock's price is near a **Max Pain point**, and the price has been "pinning" there for a while.
- **Rising Implied Volatility** and increasing **volume** in short-term out-of-the-money calls.
This could suggest the market is expecting a short-term rally or breakout, and you might consider strategies like buying calls or participating in the trend. Conversely, if the PCR is high and unusual activity is happening in puts, you might be prepared for a bearish move.
Conclusion
Option chain analysis is a mix of understanding basic concepts, reading market sentiment, and diving deep into advanced tools. By combining **open interest, volume, implied volatility, options Greeks**, and market sentiment indicators like the **put-call ratio**, you can form a comprehensive view of market dynamics and trade more effective.

Options Trading vs. Stock Trading: Which is Right for You?Hello Traders!
In today’s post, we’re going to compare Options Trading vs. Stock Trading. Both strategies can be profitable, but they come with different risk profiles, time commitments, and potential for returns. Let’s dive into the key differences and help you decide which trading method aligns with your financial goals and risk tolerance.
Stock Trading: The Classic Approach
Stock trading is the act of buying and selling stocks to capitalize on price movements. As an investor, you own a share of the company and benefit from its growth or dividends over time. Stock trading is widely recognized as the foundation of the market and remains one of the most common forms of trading.
Key Characteristics of Stock Trading:
Long-Term Investment Strategy: Stock traders tend to hold their positions for a longer duration, from weeks to years.
Ownership of the Asset: When you buy stocks, you own a part of the company, which may yield dividends or appreciate over time.
Moderate Risk and Return: Stock trading typically provides consistent, moderate returns , but the risks are lower compared to options.
Requires Patience: Stock trading is ideal for those who are patient and willing to hold onto their investments through market fluctuations.
Options Trading: Leverage and Flexibility
Options trading involves buying or selling options contracts, which give you the right (but not the obligation) to buy or sell an underlying asset at a predetermined price within a specified time frame. It offers greater leverage, meaning you can control more stock with less capital. However, this leverage comes with higher risk.
Key Characteristics of Options Trading:
Leverage Potential: Options allow you to control larger positions with a smaller initial investment.
Time Sensitivity: Options have expiration dates, which means the price movement must happen within a limited time frame.
Higher Risk, Higher Reward: With leverage, options can yield higher profits, but the potential for loss is also greater, especially when options expire worthless.
Flexibility in Strategy: Options offer a range of strategies, including covered calls, straddles, and spreads , that can help manage risk and maximize profit.
Active Management Required: Options traders need to monitor their positions frequently due to the time-sensitive nature of the trades.
Which Is Better? Stock Trading or Options Trading?
Both strategies have their advantages depending on your goals and trading style. Here’s a comparison:
Stock Trading:
Ideal for Long-Term Investors: Stock trading is suitable for traders looking for steady returns over time with relatively low risk.
Less Complexity: Stock trading is simpler and easier to understand compared to options, making it more accessible for beginners.
Lower Risk per Trade: The risk is limited to the amount invested in the stock, and the price movement is easier to predict.
Options Trading:
Higher Potential Returns in a Shorter Time Frame: Options provide the ability to profit from short-term price movements with higher leverage , leading to potentially higher returns.
Requires Skill and Active Management: Options require more expertise and constant monitoring to manage risk and maximize returns.
Higher Risk, Higher Reward: While the potential for returns is greater, options trading involves a higher level of risk, and you could lose your entire investment.
Conclusion: Which is Right for You?
Choosing between options trading and stock trading depends on your personal trading goals, risk tolerance, and time availability.
Stock trading is ideal if you want to take a long-term approach, avoid complexity, and hold your positions for steady, moderate growth.
Options trading is for those who want to utilize leverage for potentially higher returns and are willing to actively manage their trades.
What’s your trading preference?
Are you more inclined towards stock trading or options trading ? Let me know your thoughts in the comments below!

Bank Nifty Chart Analysis Trading Opportunity Ahead Bank Nifty Chart Analysis for Budget Day and Net Month
Bank Nifty has formed a **Head & Shoulder pattern** and has already given a **breakdown** 📉. Now, the key focus will be on whether the pattern **succeeds or fails**, which will determine the upcoming market direction. Be prepared for **both possibilities** in the trading sessions following the Budget announcement.
🔹 **Best Trading Opportunity**:
To take advantage of the volatility on Budget Day, a **hedged position** can be created using **Call & Put options** near key levels:
📌 **49,950**
📌 **50,500**
💡 If Bank Nifty makes a **one-sided move of 1,500 points**, this strategy can prove to be highly beneficial.
⚠ **Disclaimer**: This is for **educational purposes only** and not financial advice. Trade wisely and manage risk effectively.
Stay updated and trade smart! 🚀📈 #BankNifty #StockMarket #BudgetDay #TradingStrategy #Nifty #OptionsTrading

Database Trading Options chain can be defined as the listing of all option contracts. It comes with two different sections: call and put. A call option means a contract that gives you the right but does not give you the obligation to buy an underlying asset at a particular price and within the option's expiration date.
In all, it is not gambling but is a type of speculation hence a government employee and PSU servants are not allowed to trade in options.

Options Trading Strategies on Budget Day 2025A Comprehensive Guide on Nifty, Niftybank, and Sensex Options
Introduction
Trading options on Union Budget day can be an exhilarating yet challenging endeavour. The Indian stock market sees significant volatility on this day, influenced by the budget announcements made by the Finance Minister. This guide will provide insights into trading options on the three major indices in the Indian markets: Nifty, Nifty Bank, and Sensex. We will also analyse the past data of these indices on budget days and examine how India VIX have fluctuated during these days. Based on this data we will deploy 4 delta neutral strategies and see how these strategies have performed on the budget days for all the 3 indices. The basic idea of this study is to find out the optimal strategy that can be deployed on budget day. Also please note since Sensex is a new instrument for weekly options data for the strategies is only available for 2024
Understanding the Major Indices
• Nifty: The Nifty 50 index, representing 50 of the largest companies listed on the National Stock Exchange (NSE).
• Niftybank: The Nifty Bank index, comprising the most liquid and large capitalized Indian banking stocks.
• Sensex: The Sensex or BSE 30 index, representing 30 of the largest and most actively traded stocks on the Bombay Stock Exchange (BSE).
Historical Performance on Union Budget Days
To make informed trading decisions, it is essential to analyse how these indices have performed on budget days over the past decade. The following tables provide detailed data on the indices' performance, including values for Open, High, Low, Close, and percentage changes from Open to Close and High to Low. Additionally, the tables include India VIX movement throughout the day.
Analysing Implied Volatility and India VIX
On Union Budget day, implied volatility and the India VIX are crucial indicators to watch. Typically, an IV crush occurs post the Finance Minister's speech, leading to a significant drop in volatility. This section will explore these trends based on historical data and provide insights into how traders can capitalize on these movements.
PS: The IV considered here will be the ATM Straddle IV
Options Trading Strategies
Although multiple options strategies can be deployed on budget day we are going to consider deploying a Directional and a Non-Directional Straddle with protective hedges. We will compare the strategies to see which strategy has given the best back testing performance and we will compare the performance of these strategies for all indices Nifty, Bank Nifty and Sensex.
Short Straddles using Wait & Trade
A conventional short straddle involves selling an ATM call and an ATM put option. However instead of entering both the legs at once we are going to perform a wait and trade directional straddle. This means that we will enter the call leg or the put leg only when the premium falls below 5%. We will take the reference time of entry as 9:20 am and exit time for the strategy will be 3:25 pm. We will check the reference price of both the calls and put options at 9:20 am for the ATM Straddle strike price. Let us say the Nifty on budget day is trading at 22500 then we will check the premium of the 22500 CE and 22500 PE and note down these prices. Let us say both are trading close Rs 100 each then we will enter only when the price of those options goes below Rs 95 implying that there is some direction in the market. So we will enter only that leg and avoid executing the other leg. If the market takes a direction we are bound to profit from the leg that has been executed. If the market moves up first and then down then it is likely that both the legs will get executed. The stop loss on the individual legs will be 70% each. One can execute this simple strategy via an algo execution platform.
Pros: This strategy profits from the decrease in implied volatility and can be profitable if the market remains sideways or directional.
Cons: This strategy will tend to loose money in a V-shape or U-shape market since there is a possibility of both stop losses triggering.
Iron Butterfly
An Iron Butterfly strategy involves selling an ATM straddle and buying protective wings (an OTM call and an OTM put) to limit risk. The offset units will be purely selected on the basis of the breakeven points of the straddle to keep it simple. This strategy is limited risk limited reward strategy. We will execute this strategy on all indices at 9:20 am and exit at 3:25 pm on all budget days.
Pros: On budget days the usual tendency of the market is to make some extreme movements but tend to close flat or closer to the open. If on the budget day the market tends to behave in this manner then the strategy turns out to be a high profitable strategy.
Cons: On budget day if the market becomes extremely directional then this strategy will end in a limited loss
Back tested Results
The back tested performance of short straddles and Iron Butterfly on Nifty, Nifty Bank, and Sensex indices are summarized in the following tables. These tables will help traders understand the potential profitability and risks associated with each strategy. For some strategies there is lack of back tested data available, so it is denoted as NA in the column of the strategy name
Note: All the strategies deployed as a part of this exercise are time based straddles. To optimize the performance of these strategies one can look at ATM straddle charts and can add some technical indicators such as super trend, vwap or moving averages to plan precision entries and exits for these strategies. The usage of these will definitely help increase the probability of the trade.
Please find the link below for your reference with all the data
Historical Data Indices.xlsx
The software used for backtesting the strategies in StockMock.
Conclusion
Budget week brings volatility; traders should employ delta neutral strategies to benefit from price fluctuations and implied volatility changes
Some of the key highlights of all budget days:
1. Budget week is highly volatile, with significant price movements expected.
2. Historical analysis shows an average 2-2.5% movement from high to low on budget days.
3. Implied volatility typically decreases around 11 AM on budget day.
4. Delta neutral strategies are recommended for traders lacking directional clarity.
5. Various strategies like straddles, strangles, and iron condors can be employed.
6. One should use algo platforms to automate executions since markets will tend to move very fast and in such situations, execution becomes extremely critical
7. Also do your own study by backtesting, forward testing and only then deploy your strategy in the live market
Hope you found the above article useful in helping you to prepare yourself in advance for Budget Day. All the best!

Nifty key levels for 03.01.2025Nifty key levels for 03.01.2025
If nifty breaks the upper or lower range we can expect the momentum. Consolidation zone will be favour to option sellers. Either side breakout will help option buyers.
Disclaimer:
Views are purely educational in nature. You are solely responsible for any decisions you take on basis of my research

NIFTY PREDICTIONS.... BEARISH OUTLOOK FOR DECEMBER 2024. I'll try explaining my Nifty chart analysis through Elliot waves.
Nifty, again, is likely correcting in a 5-wave pattern. After reaching an ATH of 24274, Nifty's downside waves/correction started towards the end of September.
Wave (1) moved in a 5-wave pattern and ended around 24700, as marked in the chart.
Wave (2) had a zig-zag pattern and ended around 25200.
Wave (3) also had a 5-wave pattern, falling 1.23 times wave 1 to end around 23300 levels.
Wave (4)- Nifty is currently in this wave, which is probably in a zig-zag pattern. Wave (4), as usual, notoriously has violent moves on either side, giving challenges to traders.
Probable levels of termination of wave (4) are 24800 {0.5 of waves (1-3)}and 25150 {0.618 of waves (1-3).
Wave (5) - Assuming wave (4) termination around 25150, we can expect a big correction in Nifty to 22700 levels. This wave (5) alone can cause approximately 10% fall in Nifty.
Remember,
THE MARKET IS ALWAYS RIGHT.
Trade with appropriate stoploss.
