Tata Consumer (W): Bullish, Consolidation Breakout(Timeframe: Weekly | Scale: Logarithmic)
The stock is emerging from a 9-month sideways consolidation phase. While it has cleared the immediate resistance, the major test lies at the All-Time High (ATH) zone. The formation of bullish reversal candles on the weekly chart suggests buyers are regaining control.
📈 1. Trend & Structure (The "Box" Breakout)
- The Context: Since hitting its peak in Mar 2024, the stock has been trapped in a sideways "box" range.
- The Breakout: This week, the stock managed to close above the immediate horizontal resistance (approx. ₹1,170 - ₹1,180 ).
- Clarification on Resistance: It is important to note that while this is a breakout of the consolidation range, the major All-Time High resistance (around ₹1,240 - ₹1,253) is still just overhead. This is the final hurdle before "blue sky" territory.
🕯️ 2. Candlestick Analysis (The Bullish Signal)
- Hammer Candles: The last two weekly candles resemble Hammer formations (long lower wicks with small bodies).
- Interpretation: This indicates that every time sellers pushed the price down (towards ₹1,130-₹1,140), aggressive buying emerged to push it back up. This "rejection of lower prices" is a classic sign that the bottom is in.
📊 3. Indicators & Volume
- Volume Profile: Volume "dried up" significantly during the correction, and we are now seeing a gradual expansion in volume on up-weeks, indicating institutional accumulation.
- EMAs: The short-term EMAs are realigning into a bullish PCO (Price Crossover) state, confirming the trend shift.
- RSI: The RSI is rising from the mid-zone (above 50), showing that momentum is building without being overbought yet.
🎯 4. Future Scenarios & Targets
- 🐂 Target 1: ₹1,355 (Achievable once ₹1,253 is cleared).
- 🐂 Target 2: ₹1,570 (Long-term extension).
- 🛑 Support (The Safety Net): If the breakout fails, the stock will likely retest the demand zone at ₹1,040.7
Key Watchout
Watch the price action near ₹1,250. A high-volume close above this level is the "final confirmation" needed to activate the targets of ₹1,355+. Until then, it is a "buy on dips" setup.
Oscillators

BHEL – Approaching a Key Reversal Zone on the Weekly ChartBHEL has been in a broader W–X–Y corrective structure since topping out near ₹335 on the weekly timeframe. The first leg down (Wave W) completed around ₹176, followed by a steady recovery that is now pushing into a major resistance zone.
The current bounce looks like the tail end of Wave X , with price entering the 100% extension area of (a) near ₹301. This is a natural place where counter-trend rallies often slow down or fully exhaust.
Momentum remains strong — weekly RSI is pushing into the overbought zone — but there is still no confirmed bearish divergence. In simple terms:
strength is there, but it’s reaching the “watch carefully” zone.
If a bearish candlestick forms inside this highlighted region (shooting star, rejection wick, bearish engulfing, anything with real intent), it could mark the start of Wave Y , potentially dragging the stock much lower over the coming months.
Volume is supportive on the way up, but still not showing the kind of impulsive conviction that usually accompanies a fresh bullish trend.
For now, the plan is straightforward:
Let the weekly candle speak. If sellers step in here, Wave Y may begin. If price breaks above the zone decisively, this count gets challenged.
Disclaimer: This analysis is for educational purposes only and does not constitute investment advice. Please do your own research (DYOR) before making any trading decisions.

Sequent (D): Strongly Bullish, Fundamentally-Driven BreakoutThe stock has confirmed a major breakout from a 3-year structural turnaround. The move is backed by a massive earnings beat, high-conviction volume, and aligned indicators across all timeframes.
📈 1. The Long-Term Structure (The Turnaround)
- The Crash (2021-2023): After hitting its All-Time High (ATH) in June 2021, the stock entered a brutal correction, falling ~81% to form a base around ₹62 in February 2023.
- The Recovery: Since March 2023, the stock has been in a steady uptrend, forming a classic "rounding bottom" or recovery structure.
- The Hurdle: The recovery faced a stiff horizontal resistance trendline at the ₹239 - ₹241 zone. This level acted as a ceiling in October 2024 (High: ₹240.70) and rejected price action multiple times recently.
🚀 2. The Catalyst & Breakout (Today's Action)
- The Catalyst: The breakout is fueled by Q2 FY26 Earnings , where the company reported a staggering 209.1% YoY jump in Net Profit
- The Breakout: Today (Nov 18, 2025), the stock decisively shattered the ₹240 resistance, surging 7.10% to close near ₹247 .
- Volume Confirmation: The move was backed by massive volume of 9.15 Million shares, a sharp spike compared to the drying volume seen during the recent consolidation. This confirms institutional buying.
📊 3. Technical Indicators
- EMAs: Short-term EMAs are in a PCO (Price Crossover) state across Monthly, Weekly, and Daily timeframes, signaling a synchronized bullish trend.
- RSI: The Relative Strength Index is rising across all three timeframes, confirming that momentum is expanding with price.
🎯 4. Future Scenarios & Targets
The breakout has opened the door to higher levels, with a specific structural target in focus.
- The Gap (The Magnet): An unfilled gap on the daily chart has been identified from the steep 2021 correction. This gap exists between ₹270 and ₹276 (formed in August 2021). Gaps often act as magnets for price.
🐂 Bullish Targets:
1. Target 1 (Gap Support): ₹270 . The stock is likely to run toward the bottom of this unfilled gap.
2. Target 2 (Gap Fill): ₹295 . If momentum sustains and fills the gap, the next extension level is near ₹295.
🛡️ Support (The Entry Zone):
- Re-test Level: The breakout level at ₹239 - ₹240 has now flipped from resistance to support. A pullback to this zone would be a classic "buy-the-dip" opportunity to enter the trend with a favorable risk-reward ratio.
Conclusion
This is a high-quality setup. The combination of a technical breakout , earnings explosion, and gap-fill potential makes this a strong candidate for continuation. Watch for a hold above ₹239 .

Rico Auto (D): Strongly Bullish, 20-Year BreakoutThis is a high-conviction, "blue-sky" breakout setup. The stock has shattered a resistance confluence that includes a 20-year-old horizontal ceiling . This technical move is powered by a massive fundamental turnaround in the recent quarter.
🚀 1. The Fundamental Catalyst (The "Why")
The breakout is not random; it is a direct reaction to the company's Q2 FY26 Earnings report (announced recently):
- Net Profit: Nearly tripled (surged ~200-300%) compared to the previous year.
- Revenue: Showed healthy growth despite sector headwinds.
- Impact: This strong fundamental performance provided the volume and momentum needed to break the multi-decade resistance.
📈 2. The "Confluence" Breakout (The Setup)
The stock faced two formidable barriers at the **₹108** level:
1. The 20-Year Resistance: A horizontal "lid" formed at the major peak in September 2005 (approx. ₹106-₹108). Breaking a 20-year resistance is a sign of a significant structural shift.
2. The Angular Resistance: The downward trendline from the April 2024 ATH (₹157).
💥 3. Today's Price Action (Confirmation)
- The Surge: The stock surged +11.93% today, closing decisively above the ₹108 confluence zone.
- The Volume: The move was backed by 37.23 Million in volume—a massive spike compared to the "drying volume" seen during the consolidation. This confirms institutional participation.
📊 4. Key Technical Indicators
Indicator analysis confirms the momentum across all timeframes:
- RSI: Rising in Daily, Weekly, and Monthly charts, showing synchronized bullish momentum.
- EMAs: Short-term EMAs are in a PCO (Price Crossover) state across all three timeframes, signaling a strong trend alignment.
🎯 5. Future Scenarios & Targets
With the 20-year resistance broken, the stock has room to run.
- 🐂 Target 1: ₹127 (Immediate technical extension).
- 🛑 Support (The Safety Net): The breakout level at ₹108 is now critical. If the stock pulls back, this "resistance-turned-support" must hold to keep the breakout valid. A successful re-test here would be a textbook entry opportunity.

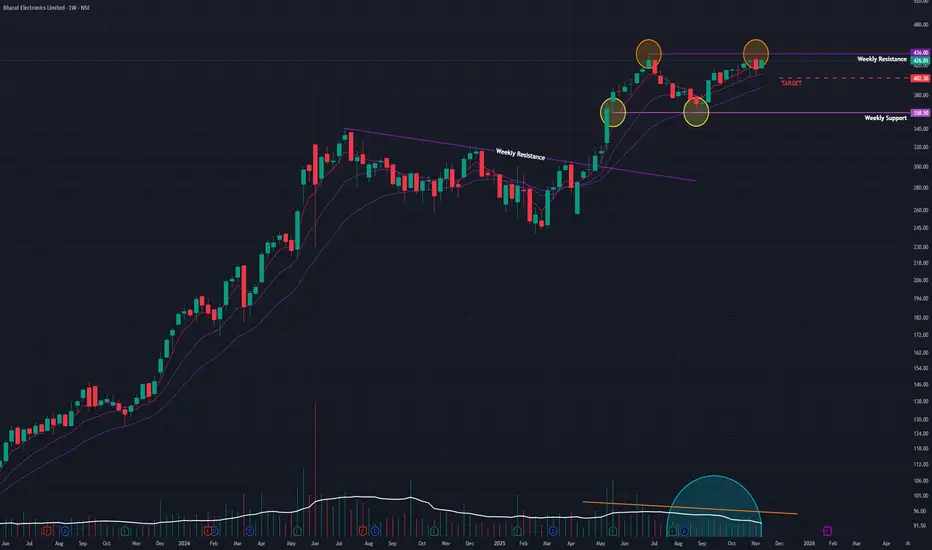
BEL (W): Primed for ATH BreakoutBased on Weekly Timeframe, Logarithmic Scale
This is a classic "coiling spring" setup. The stock is in a tight, bullish consolidation right below its all-time high. A powerful combination of fundamental catalysts, bullish high-timeframe indicators, and classic volume contraction suggests a breakout is highly probable.
🚀 1. The Fundamental Catalysts (The "Why")
This bullish technical pattern is fully supported by a torrent of positive fundamental news, providing a strong "tailwind" for the stock:
- Strong Q2 Earnings: On Oct 31, BEL reported a 26% rise in revenue and an 18% rise in net profit for Q2 2026, beating estimates.
- Massive Order Inflow: The company is announcing new, large-scale orders almost weekly, including ₹792 crore (Nov 10) and ₹871 crore (Nov 14). This provides high visibility for future earnings.
📈 2. The Dominant Pattern: Bullish Consolidation
- The "Flagpole": The stock made a strong move up to its All-Time High (ATH) in June 2025.
- The "Flag": Since then, it has been in a sideways consolidation phase , trading in a tight range just ~2% below its ATH.
- Drying Volume: Volume has been drying up during this consolidation. This is a classic, powerful sign that sellers are exhausted ("supply has dried up") and the stock is being accumulated.
- Recent "Ignition": Last week's +3.04% surge on 73.21M in volume was a significant "ignition" signal, showing that buyers are starting to re-emerge and test the resistance.
📊 3. Confluence of Bullish Indicators
The "trifecta" of bullishness on high timeframes is exceptionally strong:
- RSI: The Relative Strength Index is rising on both the Monthly and Weekly charts, showing that long-term momentum is firmly on the side of the buyers.
- EMAs: The short-term Exponential Moving Averages are in a "PCO" (Price Crossover) state on both the Monthly and Weekly charts, confirming the long-term trend is up.
🎯 4. Future Scenarios & Key Levels to Watch
The price action next week is critical.
🐂 The Bullish Case (Breakout)
- Trigger: A decisive, high-volume weekly close above the ATH resistance (₹436).
- Confirmation: This would confirm the end of the 5-month consolidation and the start of a new leg up into "price discovery."
- Target: The next logical technical price target is around ₹530 .
🐻 The Bearish Case (Breakdown)
- Trigger: If the stock fails to break out and momentum is lost (e.g., due to a broader market pullback).
- Confirmation: The stock would need to break below.
- Target: A failure would see the stock fall to retest its immediate support level at ₹400 .
Conclusion
A "wait and watch" approach is ideal, but the evidence is heavily skewed to the upside. The combination of a perfect technical pattern (high tight flag), bullish high-timeframe indicators, and a powerful fundamental story (earnings + new orders) makes this a textbook setup for an ATH breakout.
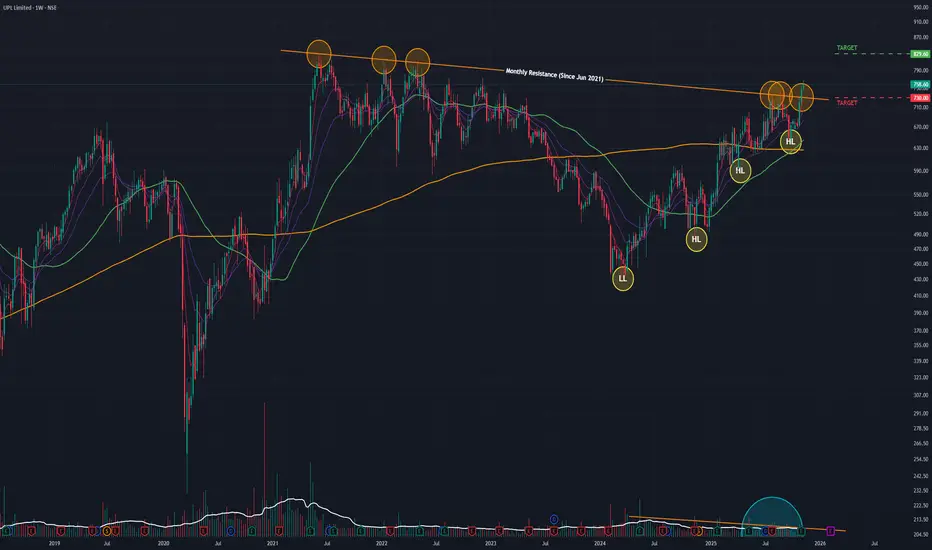
UPL (W): Strongly Bullish, Fundamentally-Driven BreakoutBased on Weekly Timeframe, Logarithmic Scale
This is a high-conviction breakout. The stock has decisively broken a 4.5-year angular resistance, driven by a blockbuster quarterly earnings report that confirmed a strong business turnaround. The alignment of high-timeframe indicators suggests a new long-term uptrend is beginning.
🚀 1. The Fundamental Catalyst (The "Why")
The technical breakout is not random. It is a direct response to strong Q2 2026 earnings :
- Strong Profitability: The company reported a 40% year-over-year growth in EBITDA and a net profit of ₹553 crore , a massive turnaround from the net loss reported in the same quarter last year.
- Upgraded Guidance: Management upgraded its full-year EBITDA growth guidance, signaling confidence in the business.
- Market Reaction: This news provided the "fuel" for the market to absorb supply and break the multi-year resistance.
📈 2. The Long-Term Setup (The "Big Picture")
- The 2021 Peak: After its ATH in June 2021 , the stock was capped by a long-term angular resistance trendline .
- The 2024 Bottom: The stock was in a corrective downtrend, which found its ultimate bottom in March 2024 .
- The Reversal: Since that low, the stock has been in a steady reversal, forming a bullish structure of Higher Lows .
- The "Lid": This recovery was repeatedly halted by the 4.5-year angular resistance, which it failed to break on previous attempts.
📊 3. The Decisive Breakout (The Past Two Weeks)
- Week of Nov 03: The stock broke out and closed above the angular resistance for the first time.
- Week of Nov 10: The stock confirmed the breakout with a gap-up open and a further 1.42% gain.
- Volume: The volume during the March 2024 uptrend was low (a "wall of worry"), but the breakout and confirmation weeks saw above-average volume ( 12.29 Million last week), confirming institutional interest.
🎯 4. Confluence of Indicators
Indicator analysis confirms the new long-term trend. This "trifecta" of bullishness on high timeframes is very powerful:
- EMAs: Short-term Exponential Moving Averages are in a "PCO" (Price Crossover) state on both the Monthly and Weekly charts.
- RSI: The Relative Strength Index is rising on both the Monthly and Weekly charts.
🧠 5. Short-Term Caution & Future Scenarios
- The "Inverted Hammer": The last daily candle of the week was an "inverted hammer." This is a sign of short-term indecision and profit-taking . It signals that while the breakout is valid, it's meeting immediate supply, and a healthy pullback or "re-test" is highly possible.
- Conclusion: The trend is now bullish, but the entry point is key.
🐂 The Bullish Case (Continuation)
- Trigger: The bullish momentum continues, absorbing the short-term profit-taking.
- Target: The next logical price target is ₹830 .
🐻 The Pullback Case (Healthy Re-test)
- Trigger: If the "inverted hammer" plays out and momentum is lost in the short term .
- Support: The price would likely fall to re-test the angular resistance-turned-support at ₹730 . A "bounce" off this level would be a classic, healthy confirmation of the breakout.
Thyrocare (W): Strongly Bullish, Multi-Year BreakoutBased on Weekly Timeframe, Logarithmic Scale
This is a textbook, high-conviction breakout. The stock has decisively broken a 4-year consolidation, backed by strong fundamentals and a powerful confluence of high-timeframe technical indicators.
📈 1. The Multi-Year Setup
- The 2021 Peak: After its ATH in June 2021 (at ~₹1,465 ), the stock entered a steep, 2-year downtrend.
- The 2023 Bottom: This trend found its bottom in March 2023 .
- The Recovery & Base: Since then, the stock has been in a 2.5-year recovery, building a massive base. This upward move was further halted by the horizontal resistance at the ₹1,465 level, which it failed to break on previous attempts.
🚀 2. The Fundamentally-Driven Breakout (Last Week)
Last week, this entire 4-year pattern changed:
- The Catalyst: Strong Q2 2026 earnings provided the "fuel" for a major move.
- The Surge: The stock surged +12.43% for the week.
- The Volume: This move was backed by a 3.45 Million share volume spike. This comes after a period of average volume, confirming institutional interest.
- The Close: The stock achieved a weekly close above ₹1,465 , confirming the breakout is not just an intraday spike.
📊 3. Confluence of Bullish Indicators
The alignment on high timeframes is exceptionally bullish:
- RSI: The Relative Strength Index is rising on both the Monthly and Weekly charts.
- EMAs: The short-term Exponential Moving Averages are in a "PCO" (Price Crossover) state on both the Monthly and Weekly charts.
- Volume: A clear spike on the breakout after a steady rise, confirming the move's validity.
🎯 4. Future Scenarios & Key Levels to Watch
🐂 The Bullish Case (Continuation)
- Trigger: If the bullish momentum continues, the stock is in a new "blue-sky" uptrend.
- Target: The next logical long-term price target is at ₹2,000 levels.
🐻 The Pullback Case (Healthy Re-test)
- Trigger: If the stock pauses to digest its 12.5% weekly gain or if the broader market pulls back.
- Support: The price would likely fall to re-test the resistance-turned-support level at ₹1,465 . A "bounce" off this level would be a classic, healthy confirmation of the breakout and an ideal entry point for those who missed the initial surge.

Borosil (W): Cautiously Bullish, Awaiting Breakout ConfirmationThis is a classic "wait and watch" scenario. The stock is in a multi-year base-building pattern, and all signs point to a significant bullish breakout. However, a formidable resistance has not yet been broken.
📈 1. The Long-Term Context
- Multi-Year Consolidation: The stock has been in a wide, sideways consolidation phase since its All-Time High (ATH) in April 2022.
- The "Lid": This entire 3.5-year pattern has been capped by a critical horizontal resistance trendline formed since December 2021 . This level is the single most important line on the chart.
🚀 2. The Current Setup (The "Battle at Resistance")
- The "Battle": For the past five weeks , the stock has been actively "battling" this multi-year resistance.
- The Failure (So Far): While there have been multiple attempts, the stock has failed to secure a weekly close above this level .
- Bullish Volume: After a long "dry period," volume is slowly rising. Crucially, these breakout attempts are being accompanied by volume spikes , showing that buyer conviction is growing.
📊 3. Confluence of Bullish Indicators
The alignment of the Monthly and Weekly timeframes is a very powerful sign:
- RSI: The Relative Strength Index is rising on both the Monthly and Weekly timeframes, showing that long-term momentum is building.
- EMAs: The short-term Exponential Moving Averages are in a "PCO" (Price Crossover) state on both the Monthly and Weekly timeframes, confirming the long-term trend is turning bullish.
🎯 4. Future Scenarios & The "Game Plan"
🐂 The Bullish Case (Confirmation)
- Trigger: We need to see a decisive weekly close above the horizontal resistance.
- Confirmation: The "gold standard" confirmation, would be a successful "re-test" —where the stock pulls back, touches the old resistance, and "bounces" off it as new support.
- Target 1: ₹840
- Target 2: ₹1,130
🐻 The Bearish Case (Breakout Failure)
- Trigger: If this 5-week "battle" results in a strong rejection and momentum is lost.
- Target: The stock will likely fall to retest its immediate support level at ₹635 .
Conclusion
The rising volume and bullish high-timeframe indicators are pressing against a multi-year resistance. The breakout, if it is confirmed, will be significant. The best approach is patience.

Ashok Leyland (D): Strongly Bullish, Blue-Sky BreakoutThis is a high-conviction, fundamentally-driven breakout. After a volatile re-test, the stock has confirmed its breakout above a key consolidation zone and is now in a "price discovery" phase, backed by exceptional volume and strong earnings.
🚀 1. The Fundamental Catalyst (The "Why")
The explosive move this week is powered by a strong Q2 2026 earnings report (announced Nov 12). The positive results and dividend declaration provided the high-conviction "fuel" for the market to absorb the failed re-test and drive the stock to a new all-time high.
📈 2. The Decisive Breakout (The "Whipsaw")
- Part 1 (The Breakout): On Nov 11 , the stock broke above the horizontal resistance from Sep 2025 (at the ₹144-₹146 level).
- Part 2 (The "Fakeout"): On Nov 12 , the stock failed its re-test, closing below this new support. This move likely trapped bearish traders.
- Part 3 (The Confirmation): Today, Nov 13 , the stock gapped up (opening above the resistance) and surged +5.53% on massive 53.62 Million volume. This powerful move creates a new all-time high and confirms the breakout is real.
📊 3. Confluence of Bullish Indicators
- Volume: The consolidation phase had below-average volume. Today's 53M+ share volume is a massive spike, confirming institutional participation.
- RSI: The Relative Strength Index is rising on the Daily, Weekly, and Monthly charts .
- EMAs: The short-term Exponential Moving Averages are in a "PCO" (Price Crossover) state on all three timeframes .
This alignment of all three timeframes, combined with the fundamental catalyst, gives this breakout a very high probability of success.
🎯 4. Future Scenarios & Key Levels to Watch
The stock is now in a "price discovery" trend.
🐂 The Bullish Case (Momentum Continues)
- Trigger: The stock is in a new uptrend with no overhead resistance.
- Target: ₹161 is the first logical objective.
🐻 The Pullback Case (Support Test)
- Trigger: If the stock pauses to digest its 5.5% single-day gain.
- Support: The price would likely fall to re-test the resistance-turned-support at ₹144 . A "bounce" off this level would be a textbook confirmation of the new support floor and an ideal entry point for those who missed the initial surge.

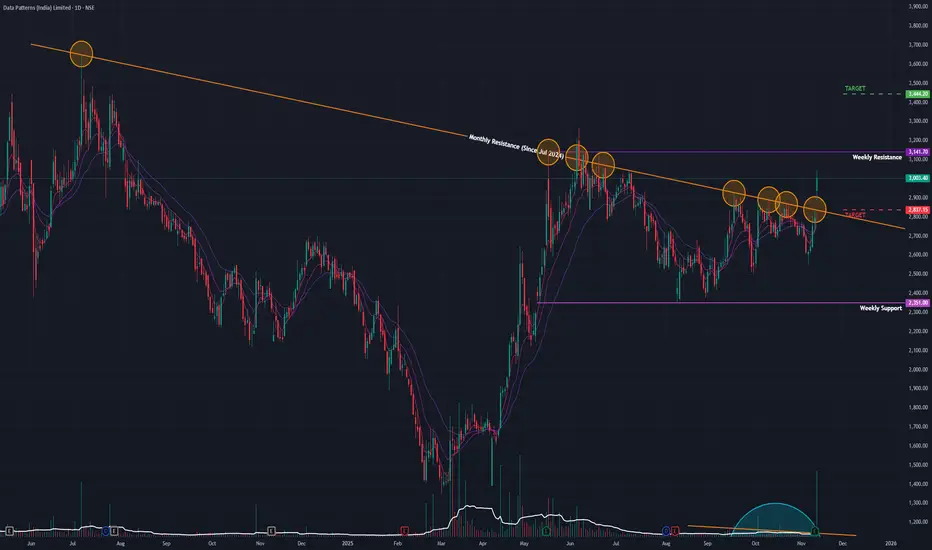
Data Patterns (D): Strongly Bullish, Fundamentally Driven BOThis is a high-conviction breakout event. The stock has decisively broken its 17-month angular resistance, driven by blockbuster quarterly earnings. All indicators are aligned, but the stock now faces its final horizontal resistance, which will determine the next major leg up.
🚀 1. The Fundamental Catalyst (The "Why")
Today's move is not speculative. It is a direct response to record-breaking Q2 2026 earnings :
- Revenue: Surged 238% year-over-year to ₹307.46 crore.
- Net Profit: Grew 62.5% year-over-year to ₹49.19 crore.
- Market Reaction: The gap-up open and +7.56% surge on 6.29 Million in volume confirms massive institutional interest.
📈 2. The Long-Term Context (The Setup)
- The 2024-2025 Correction: After its ATH in July 2024 , the stock entered a long-term downtrend.
- The Reversal: This trend found its bottom in March 2025 , and the stock began its recovery.
- The Angular Resistance: This recovery was capped by the angular resistance trendline from the July 2024 ATH.
- Drying Volume: Volume was drying up during the consolidation since May 2025—a classic sign of accumulation.
🎯 3. The Dual Resistance Battle
- Part 1 (CLEARED): Today, the stock gapped up and closed decisively above the 17-month angular resistance trendline. This is a significant bullish victory.
- Part 2 (THE NEXT HURDLE): The stock now faces a major horizontal resistance at ₹3,141 . This level is the last line of defense for the bears.
📊 4. Confluence of Bullish Indicators
This breakout is supported by a rare "trifecta" of bullish signals across all timeframes:
- EMAs: Short-term Exponential Moving Averages are in a "PCO" (Price Crossover) state on the Daily, Weekly, and Monthly charts .
- RSI: The Relative Strength Index is rising on the Daily, Weekly, and Monthly charts .
This alignment of all three timeframes gives the breakout very high technical validity.
🧠 5. Future Scenarios & Key Levels to Watch
🐂 The Bullish Case (Confirmation)
- Trigger: A decisive, high-volume close above the horizontal resistance at ₹3,141 .
- Target: This would confirm the start of a new bull run, and the target of ₹3,445 is the next logical objective.
🐻 The Pullback Case (Healthy Re-test)
- Trigger: If the stock is rejected at ₹3,141 or needs to pause after its big run.
- Support: The price would likely fall to re-test the angular trendline it just broke, at the identified level of ₹2,817 . A "bounce" off this level would be a textbook, healthy confirmation of the new support.
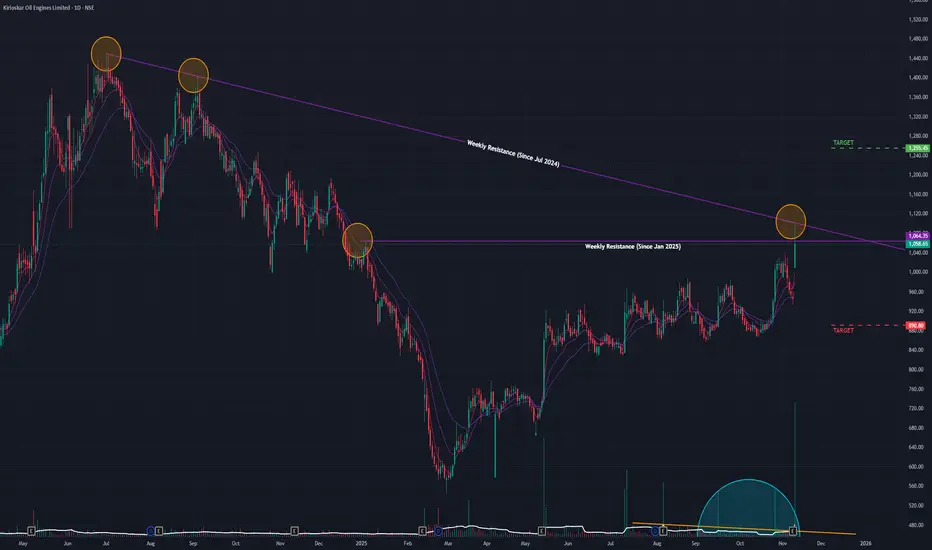
Kirloskar (D): Bullish, Awaiting Breakout ConfirmationThis is a "wait and watch" scenario. The stock is at a critical decision point. A massive fundamental catalyst (record-breaking earnings) has met a powerful technical resistance. The price-action of the next few days will be crucial.
🚀 1. The Fundamental Catalyst
Today's explosive move was fundamentally driven. The stock gapped up and surged +11.98% on 11.37 Million in volume as a direct response to its record-breaking Q2 2026 earnings (44% profit growth). This provides a strong, non-speculative a to the bullish case.
📈 2. The Long-Term Context (The Setup)
- The 2024-2025 Correction: After its ATH in July 2024, the stock entered a downtrend, which found its bottom in February 2025.
- The Recovery: Since then, the stock has been in a slow, methodical uptrend, forming a bullish structure of Higher Lows .
- Drying Volume: Volume had dried up during this slow uptrend, a classic sign of accumulation before a major move.
🎯 3. Today's Action (The "Battle at Resistance")
The stock's upward progress was blocked by a dual resistance :
1. A short-term horizontal resistance (since Jan 2025).
2. A long-term angular resistance (from the Jul 2024 ATH).
Today, the stock's gap-up broke the short-term horizontal resistance intraday , but by the market's close, sellers pushed it back down. It failed to close above this level . This "rejection" or "failed close" signals that a significant supply of sellers (profit-takers) exists at this exact point, despite the great news.
📊 4. Confluence of Bullish Indicators
Despite today's rejection, the underlying trend is powerfully bullish:
- RSI: The Relative Strength Index is rising on the Daily, Weekly, and Monthly charts .
- EMAs: The short-term Exponential Moving Averages are in a "PCO" (Price Crossover) state on all three timeframes .
This "trifecta" of bullishness across all timeframes suggests today's rejection is likely a pause, not a top.
🧠 5. Future Scenarios & Key Levels to Watch
The next few days will define the trend.
🐂 The Bullish Case (Confirmation)
- Trigger: We need to see a decisive daily close above the horizontal resistance, followed by a break of the main angular trendline.
- Target: This would confirm the breakout and open the path to the ₹1,255 level.
🐻 The Bearish Case (Rejection)
- Trigger: If today's failed close is a bull trap and the momentum is lost.
- Target: The price will likely fall to retest the primary support level at ₹890 .
Yatra Online (D): Strongly Bullish, Fundamentally-Driven BOThis is a high-conviction breakout, driven by explosive quarterly earnings. The stock has successfully broken its short-term consolidation but was temporarily rejected at its multi-year high. The underlying momentum is exceptionally strong.
🚀 1. The Fundamental Catalyst (The "Why")
The technicals are being driven by fundamentals. Today's +11.88% surge on massive 35.31 Million volume is a direct response to Yatra's record-breaking Q2 2026 earnings , which featured:
- Net Profit up 96% year-over-year.
- Revenue up 48% year-over-year.
- A raised full-year EBITDA guidance from the company.
📈 2. The Long-Term Context (The Setup)
- The Bottom & Reversal: After making its all-time low in March 2025 , the stock has been in a strong, sustained uptrend.
- The Consolidation: From August 2025, the stock entered a sideways trend, building a base for its next move. Volume was declining during this period—a classic sign of accumulation.
🎯 3. Today's Action (The "Two-Resistance Battle")
Today's price action was a textbook example of a breakout hitting two resistance levels:
- Resistance 1 (CLEARED): The short-term horizontal resistance from September 2025 (at ~₹172 ). The stock decisively broke and closed above this level.
- Resistance 2 (REJECTED): The long-term horizontal resistance from January 2024 (the previous multi-year high). The stock breached this level intraday to make a new ATH, but failed to close above it . This is a key sign of selling pressure or profit-taking at the old high.
📊 4. Key Technical Indicators
Indicator analysis confirms the bullish power across all timeframes:
- RSI: The Relative Strength Index is rising on the Daily, Weekly, and Monthly charts .
- EMAs: The short-term Exponential Moving Averages are in a "PCO" (Price Crossover) state on all three timeframes .
🧠 5. Future Scenarios & Key Levels to Watch
The path forward is now clearly defined by the two resistance levels identified.
🐂 The Bullish Case (Confirmation)
- Trigger: The stock must now get a decisive daily close above the long-term resistance (the Jan 2024 high it was rejected from today).
- Target: Once it clears that final hurdle, the path is open to price target of ₹205 .
🐻 The Pullback Case (Healthy Re-test)
- Trigger: If the stock is unable to continue the immediate momentum (due to the rejection) and pulls back.
- Target: The price will likely fall to re-test the resistance-turned-support at ₹172 . A "bounce" off this level would be a textbook, healthy confirmation of the breakout and a new buying opportunity.

Nestle India – Retest Before the Final Push HigherNestle India appears to be unfolding a clean five-wave impulsive structure. After a powerful Wave 3 rally backed by strong volume expansion, the stock has entered a typical mid-trend pause — a falling wedge consolidation representing Wave 4.
The correction has so far retraced near the 0.382 Fibonacci level around ₹1,247, perfectly aligning with the prior breakout zone from Wave 1 highs. This overlap suggests that the current dip is more of a healthy retest than a trend reversal.
As long as the price action holds above ₹1,238.20, the bullish structure remains valid. A breakout above ₹1,311 — the Wave 3 high — would likely trigger Wave 5, opening room for upside continuation toward the ₹1,340–₹1,360 zone.
Both the 100-day and 200-day SMAs are sloping upward, reinforcing the medium-term bullish bias. Meanwhile, RSI remains steady in the 60 range, showing no signs of exhaustion — exactly what you want to see before a possible Wave 5 extension.
In short: the setup is healthy, confluence is strong, and risk is clearly defined. A decisive move above ₹1,311 could mark the start of Nestle’s next leg higher.
Invalidation: Below ₹1,238.20
Bias: Bullish continuation (Wave 5)
Timeframe: Daily
Disclaimer: This analysis is for educational purposes only and does not constitute investment advice. Please do your own research (DYOR) before making any trading decisions.

Bharat Forge (D): Strongly Bullish, Multi-Resistance BreakoutThis is a high-conviction breakout event. The stock has decisively broken out of a 17-month corrective pattern, shattering two major resistance levels simultaneously. This move is supported by a powerful confluence of bullish indicators across all timeframes and is underpinned by strong fundamental results.
📈 1. The Long-Term Context
- The Correction: After hitting its All-Time High (ATH) in June 2024 , the stock entered a 10-month corrective downtrend.
- The Reversal: This trend reversed in April 2025 , and the stock began a new recovery.
- The Consolidation: This recovery was capped by two distinct resistance levels, forcing the stock into a consolidation phase where, volume was drying up (a sign of accumulation).
🚀 2. The Decisive Breakout (Today's Action)
Today, the stock broke this stalemate with explosive force:
- The Surge: A powerful +5.55% rally on high-conviction volume of 4.81 Million shares.
- The Dual Breakout: This move shattered both key resistance levels at once:
1. The long-term angular resistance (from the June 2024 ATH).
2. The short-term horizontal resistance (from June 2025, at the ₹1,362 level).
- The Catalyst: This technical breakout is supported by strong Q2 earnings, which act as a fundamental driver, giving the move a higher probability of success.
📊 3. Confluence of Bullish Indicators
This breakout is not isolated. It is confirmed by a rare "trifecta" of bullish signals on Daily, Weekly, and Monthly timeframes:
- RSI: The Relative Strength Index is rising on all three timeframes .
- EMAs: The short-term Exponential Moving Averages are in a "PCO" (Price Crossover) state on all three timeframes .
- SMAs: A recent SMA Golden Cross (50-day crossing 200-day) is active, confirming the new long-term uptrend.
🎯 4. Future Scenarios & Key Levels to Watch
This breakout provides a very clear road map based on identified levels:
🐂 The Bullish Case (Momentum Continues)
- Trigger: If the current momentum is sustained, the stock is in a new uptrend.
- Target 1 (Short-Term): ₹1,525
- Target 2 (Medium-Term): ₹1,625
🐻 The Pullback Scenarios
- Scenario A (Healthy Re-test): The momentum pauses, and the stock pulls back to test the "resistance-turned-support" level at ₹1,362 . A bounce from here would be a textbook confirmation and a secondary buying opportunity.
- Scenario B (Breakout Failure): If the breakout is a "fakeout," the stock will fail to hold ₹1,362 and will likely fall to the next major support level at ₹1,305 .

Torrent Pharma (D): Strongly Bullish, Blue-Sky BreakoutThis is a high-conviction breakout. The stock has broken out of a 4-month consolidation, setting a new all-time high on high volume. The move is strongly supported by all indicators and a powerful fundamental catalyst.
📈 1. The Dominant Pattern: ATH Breakout
- The Consolidation: After making its previous ATH in July 2025, the stock entered a 4-month sideways trend.
- The "Lid": A horizontal resistance line formed at this ATH (approx. ₹3,787 ) restricted all forward movement.
- Volume Contraction: Volume was "drying up" during this consolidation phase. This is a classic bullish sign of seller exhaustion and accumulation.
🚀 2. The Decisive Breakout (Today's Action)
- The Surge: Today, the stock shattered this resistance with a 6.63% surge , backed by a high-conviction volume of 1.65 Million shares.
- The New ATH: This move resulted in a new all-time high, pushing the stock into a "blue-sky" price discovery phase.
- The Catalyst: This technical move is not speculative. It is driven by strong Q2 2026 earnings (30% profit growth), confirming that institutions are buying on good news.
📊 3. Key Technical Indicators
Indicator analysis confirms the bullish momentum across all timeframes:
- RSI: The Relative Strength Index is rising on the Daily, Weekly, and Monthly charts .
- EMAs: The short-term Exponential Moving Averages are in a "PCO" (Price Crossover) state on all three timeframes.
🎯 4. Future Scenarios & Key Levels to Watch
⚠️ A Note of Caution (The "Fakeout" Risk)
The risk is a "bull trap" or "fakeout." The correct thing to watch for, is bearish divergence (i.e., if the stock makes another new high, but the RSI makes a lower high).
🐂 The Bullish Case (Confirmation)
- Confirmation: The ideal "textbook" move would be a re-test . We want to see the stock pull back to the ₹3,787 level and "bounce," confirming the old resistance has become new support.
- Target: If the bullish momentum continues, the next logical target is ₹4,100 .
🐻 The Bearish Case (Breakout Failure)
- Trigger: The breakout fails, and the stock loses momentum (a "bull trap").
- Confirmation: The price falls and closes back below the ₹3,787 support level, invalidating the breakout.

Trent Ltd – Double Zigzag Correction in PlayAfter topping out at ₹8,345, Trent has been locked in a larger corrective structure that now appears to be unfolding as a W–X–Y double zigzag on the weekly chart.
Wave Count
Wave W bottomed at ₹4,715 as a clear ABC.
The rally to ₹6,261 completed Wave X.
Price is now progressing in Wave Y, where:
Wave A has unfolded,
Wave B topped at ₹5,674,
Wave C is expected to continue lower.
Key Levels
Target 1 (1.0 extension): ₹4,370
Target 2 (1.618 extension): ₹3,565
Stop-loss / Invalidation:
Trading level: ₹5,674 (Wave B high)
Structural level: ₹6,261 (Wave X high)
RSI Check
RSI remains below 50, confirming bearish momentum.
Conclusion
The correction appears incomplete with scope for another leg down before a larger recovery can begin. While the working invalidation sits at ₹5,674, structurally the bearish count holds until ₹6,261 is broken.
Disclaimer: This analysis is for educational purposes only and does not constitute investment advice. Please do your own research (DYOR) before making any trading decisions.

Sobha (W): Bullish, Breakout ConfirmationThe stock has decisively broken a 17-month angular downtrend line, signaling a major change in character. The underlying momentum on higher timeframes (Weekly & Monthly) is strong, suggesting this is the start of a new bullish leg.
📈 1. The Long-Term Context
- The 2024 Peak: After hitting its All-Time High (ATH) in June 2024 , the stock entered a prolonged 10-month correction.
- The 2025 Bottom: This downtrend found its bottom in April 2025 , and the stock has been in a reversal/recovery phase since.
- The Resistance: This recovery was consistently blocked by a strong, angular resistance trendline formed from the June 2024 ATH.
🚀 2. The Decisive Breakout (This Week's Action)
This week, the 17-month pattern was broken:
- The Move: The stock decisively broke out and closed above this long-term angular resistance trendline for the first time.
- The Surge: This breakout was confirmed with a +5.10% surge for the week, backed by 1.2 Million in total weekly volume.
- Volume Context: This breakout comes after a period of low, consolidating volume, which often precedes a significant move.
📊 3. Key Technical Indicators
The underlying momentum on higher timeframes strongly supports this breakout:
- EMAs: Short-term Exponential Moving Averages are in a "PCO" (Price Crossover) state on both the Monthly and Weekly charts, confirming a bullish trend.
- RSI: The Relative Strength Index is rising on both the Monthly and Weekly timeframes, showing that buying strength is building and sustaining.
🎯 4. Future Scenarios & Key Levels to Watch
This breakout provides a clear road map based on identified levels:
🐂 The Bullish Case (Momentum Continues)
- Trigger: If the current momentum is maintained, the breakout is confirmed.
- Target: The first major target is the ₹2,060 level, which represents the next significant resistance zone near the 2024 highs.
🐻 The Bearish Case (Re-test Scenario)
- Trigger: The initial momentum is lost, and the stock pulls back to verify the breakout.
- Confirmation: A "re-test" where the stock drops to touch the old resistance trendline, which should now act as new support.
- Support: This re-test level is at approximately ₹1,620 . A bounce from this level would be a secondary, high-conviction buy signal.

Thangamayil (M): Strongly Bullish, Blue-Sky BreakoutThis is a high-conviction breakout. The stock has broken out of a year-long consolidation base, created a new all-time high, and is supported by explosive volume and powerful fundamental results.
📈 1. The Long-Term Context (The "Big Picture")
- Logarithmic View: On a long-term logarithmic chart, this move is a continuation of a major uptrend.
- The Consolidation: After hitting its previous All-Time High (ATH) in October 2024, at ₹2,567.50, the stock entered a year-long sideways consolidation.
- Drying Volume: During this phase, volume "dried up," which is a classic bullish sign of seller exhaustion and accumulation by new buyers.
🚀 2. The Decisive Breakout (The November 2025 Event)
- The Surge: In the first week of November 2025, the stock shattered this consolidation with a massive +40.17% surge.
- High-Conviction Volume: This move was backed by exceptional, non-speculative volume of 3.67 Million shares, confirming strong institutional interest.
- New ATH: This surge pushed the stock into "price discovery" mode, creating a new all-time high.
📊 3. The Fundamental Catalyst (Why it's Breaking Out)
This powerful technical breakout is fully supported by blowout fundamental news, which gives the move high validity:
- Massive Profit: The company reported a sharp Q2 profit turnaround (from a net loss last year to a ₹58.5 Cr net profit).
- Record Sales: The company also announced record-breaking sales in October , crossing the ₹1,000 Cr mark for the first time in a single month.
🎯 4. Future Scenarios & Key Levels
- Bullish Indicators: The short-term EMAs are in a PCO state and the RSI is rising , confirming the momentum is strong and on the side of the buyers.
🐂 The Bullish Case (Price Discovery)
- Trigger: If this momentum is sustained, the stock is in "blue-sky" territory with no overhead resistance.
- Target: Projected target of ₹4,150 is a logical next-level based on technical extensions.
🐻 The Pullback Case (Support Test)
- Trigger: If the momentum pauses or a pullback occurs (which is healthy after a 40% surge).
- Support: The most critical level to watch is the old resistance-turned-support zone at ₹2,560 - ₹2,570 . A re-test and "bounce" off this level would be a textbook confirmation of the new support and an ideal entry point for those who missed the initial breakout.

Hero MotoCorp: Wedge Signals Wave 5 ExhaustionAfter a strong five-wave impulse from ₹3,344 to ₹5,717, Hero MotoCorp appears to have completed a textbook rally, with Wave (5) showing all signs of exhaustion.
The final leg developed into a rising wedge , a common terminal pattern that often precedes short-term pullbacks. Momentum loss is also visible on the RSI , which has been forming lower highs within a descending channel — a classic sign of fading strength.
From an Elliott Wave perspective, the advance from Wave 4 (₹4,195) to Wave 5 (₹5,717) aligns closely with the 1.0 Fibonacci projection of internal Wave (1), suggesting a complete internal impulse.
Should a correction unfold, the 0.382–0.5 retracement zone (₹4,810–₹4,530) — measured from the entire rally (₹3,344–₹5,717) — could become a potential accumulation area for the next bullish sequence (Wave 2 or B).
Summary :
Wave 5 likely completed inside a rising wedge
RSI bearish divergence confirms exhaustion
Next potential buy zone: ₹4,810–₹4,530
Structure remains bullish over the long term, but a short-term correction looks due
Disclaimer:
This analysis is for educational purposes only and does not constitute investment advice. Please do your own research (DYOR) before making any trading decisions.

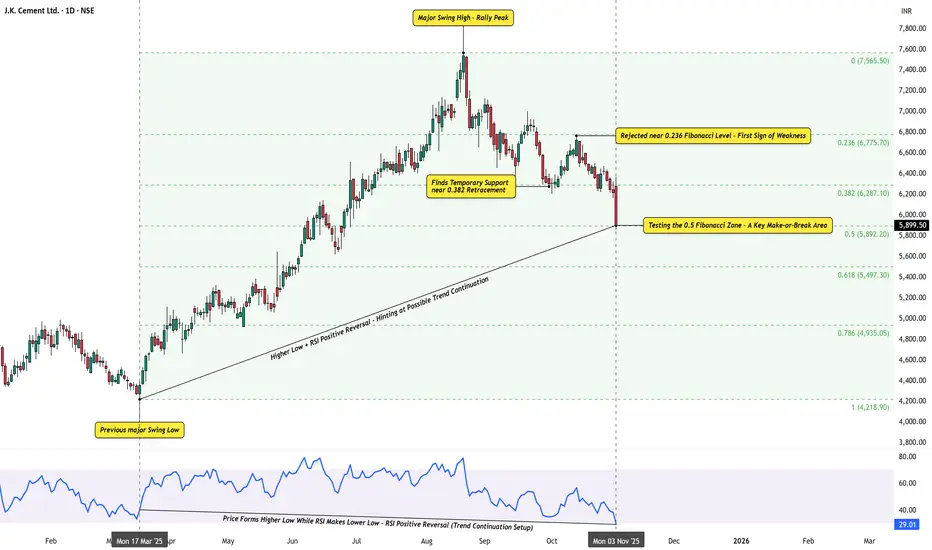
Fibonacci in Action – A Lesson from J.K. CementFibonacci retracement is one of the simplest yet most consistent tools for studying how markets correct within trends.
To understand it better, here’s a clean example from J.K. Cement .
After a strong uptrend from the March 2025 swing low to ₹7,565 , the stock began to retrace. Notice how price behavior respected the Fibonacci structure:
It bounced from the 0.382 level , illustrating a temporary reaction point.
Later, it faced resistance near 0.236 , where rallies often stall during corrective phases.
The 0.5 retracement zone now serves as a classic testing ground that often helps define trend continuation or deeper correction.
Even the RSI pattern offers insight — price forms a higher low while RSI makes a lower low, a textbook positive reversal setup that often aligns with trend studies.
The purpose of this example isn’t prediction, but to show how Fibonacci ratios and RSI behavior interact — highlighting rhythm, structure, and market psychology in motion.
Disclaimer: This analysis is for educational purposes only and does not constitute investment advice. Please do your own research (DYOR) before making any trading decisions.
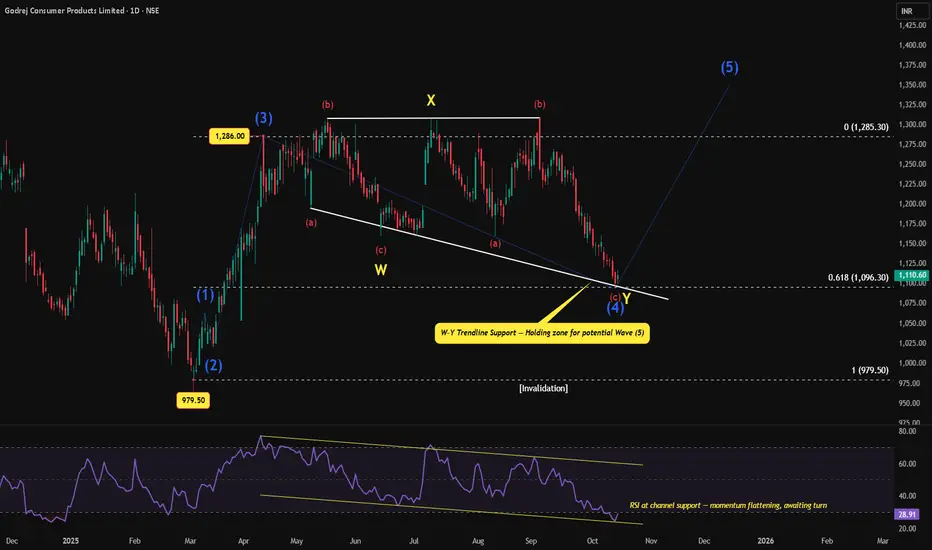
Godrej Consumer Products: Wave (4) Double Combo Testing SupportWave (4) seems to have evolved as a double combination (W–X–Y), with prices now testing the W–Y trendline support near the 0.618 retracement (~₹1,096).
The structure has been slow and overlapping — typical of a Wave (4) correction.
RSI too rests at channel support , hinting at momentum exhaustion.
A steady hold above this zone could pave the way for Wave (5) , but confirmation is still pending.
Invalidation remains below ₹979.50 .
Strategy:
Watch price behavior near the current support zone. Patience here pays more than prediction.
Disclaimer:
This analysis is for educational purposes only and does not constitute investment advice. Please do your own research (DYOR) before making any trading decisions.
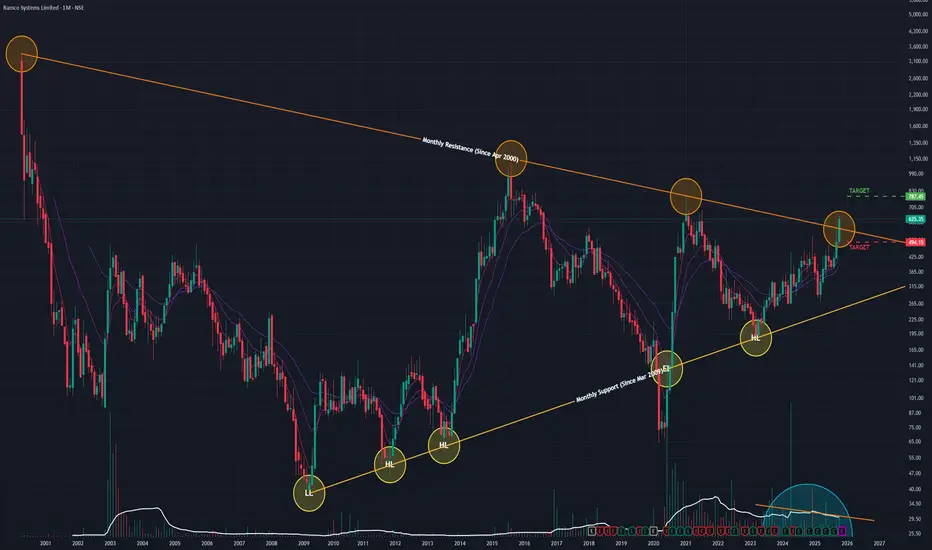
Ramco Systems (M): Extremely Bullish, Multi-Decade BreakoutThis stock is displaying one of the most powerful bullish technical signals possible: a decisive breakout from a 25-year angular resistance trendline . This is a major, long-term secular trend change.
📈 1. The Long-Term Context
- The 25-Year Pattern: Since its peak in April 2000, the stock has been held down by a massive, multi-decade angular resistance trendline.
- The Bottom & Reversal: The stock formed its ultimate bottom in March 2009. Since then, it has been in a slow, 16-year recovery, forming a pattern of Higher Lows against this unbreachable resistance.
- Volume Contraction: Volume was declining (or contracting) during the final phases of this consolidation. This is a classic sign of seller exhaustion right before a major breakout.
🚀 2. The Decisive Breakout
In October 2025, this 25-year pattern was shattered:
- The Surge: The stock surged +26.61% in a single month.
- High-Conviction Volume: This move was backed by a massive spike in volume ( 2.77 Million shares), confirming strong institutional interest and the validity of the breakout.
- The Close: Most importantly, the stock closed firmly above the 25-year trendline, signaling the "lid" has finally been broken.
📊 3. Key Technical Indicators
The underlying momentum supports this new long-term trend:
- RSI: The Relative Strength Index is rising, showing that strong buying momentum is accelerating.
- EMAs: The short-term Exponential Moving Averages are in a "PCO" (Price Crossover) state, confirming the new bullish trend is in effect across timeframes.
🎯 4. Future Scenarios & Key Levels to Watch
This breakout provides a very clear road map.
🐂 The Bullish Case (Confirmation)
- Confirmation: The "gold standard" for a breakout of this magnitude is a successful "re-test." We want to see the price pull back to the old trendline (now new support, around ₹560 ) and "bounce," confirming the breakout is genuine.
- Target: Once confirmed, the next logical technical price target is ₹787 .
🐻 The Bearish Case (Breakout Failure)
- Trigger: If the momentum is not sustained, and the breakout is a "fakeout" (a "bull trap").
- Confirmation: The stock fails to hold its gains and closes back below the broken trendline (around ₹560 support level) on high volume.
- Target: This failure would invalidate the immediate thesis and likely lead to a sharp sell-off.
City Union Bank (M): Strongly Bullish, Testing All-Time HighThis is a powerful long-term breakout setup. After a 4.5-year consolidation, the stock has broken its primary resistance and is now challenging its 2020 all-time high. The bias remains strongly bullish as long as the key support at ₹200 holds.
📈 1. The Long-Term Context
- The 2020 Peak: After hitting its All-Time High (ATH) in January 2020, the stock experienced a significant fall, losing nearly half its value.
- Multi-Year Base: For the next 4.5 years (from late 2020 to 2025), the stock traded in a wide, sideways consolidation range.
- The "Lid": This entire consolidation was capped by a formidable horizontal resistance trendline (formed since Nov 2020) at approximately ₹200-₹210 .
🚀 2. The Current Breakout (The Decisive Move)
- Initial Breakout: The stock first broke above this multi-year resistance in June 2025.
- Confirmation: After the breakout, the stock successfully "re-tested" this old resistance level multiple times, confirming it had flipped into new support.
- The Surge: The surge in October 2025 confirmed this new support was valid, pushing the stock decisively away from the breakout zone and confirming the move was not a "fakeout."
📊 3. Key Technical Indicators
- Volume: Volume contracted (dried up) during the long 3-month consolidation phase before the October surge. This is a classic bullish sign of accumulation.
- Long-Term EMAs: The stock is trading well above its 100-day and 200-day EMAs, confirming the long-term trend is firmly bullish.
- Short-Term Indicators: Note: Following a minor pullback from the October highs (from ~₹240 to ~₹228), the very short-term indicators have cooled off. The short-term EMAs and RSI (Relative Strength Index) have dipped from "overbought" to neutral, which is a healthy reset before a potential next move.
🎯 4. Future Scenarios & Key Levels to Watch
The path is now defined by two critical levels:
🐂 The Bullish Case (ATH Breakout)
- The Hurdle: The final hurdle is the ATH resistance zone from January 2020 (approx. ₹249 ). The stock is currently less than 10% below this level.
- Trigger: A decisive, high-volume breakout and close above the ₹250 mark.
- Target: A successful breakout would put the stock into "blue-sky" price discovery target of ₹335 .
🐻 The Bearish Case (Breakout Failure)
- Trigger: The stock fails to break the ATH, and momentum fades.
- Confirmation: A high-volume rejection from the ATH, followed by a break below the critical support.
- Support: The most important level to watch is the old resistance-turned-support at ₹200 . A break below this would invalidate the bullish breakout thesis.
