Aarti Industries Cmp 659 dated 14-12-2022 Strong Support LineAarti Industries Cmp 659 dated 14-12-2022
1. Taking Support @ the long & strong support
Line.
2. RSI Positive Divergence
3. Good RRR, low risk trade.
4. Volume Rise
Buy @ Cmp for a target of 675-685-700-715-740
SL 635
Disclaimer :
I am not a SEBI registered Analyst so please do your own Analysis before taking any action.
The above view is shared just for educational purpose.
By no means shall be responsible for any losses amounting out of it incase if any trades on it.
It is just a view, pls trade at your own risk.
Oscillators


Indigo Cmp 1992 dated 9-12-2022 Dark Cloud at TopIndigo Cmp 1992 dated 9-12-2022
1. Dark Cloud Cover Candle Stick at top of the
Chart. (Bearish Candle stick)
2. RSI negative divergence.
Sell below 1985 for target 1970-1945-1905-1890
SL 2035
Disclaimer :
I am not a SEBI registered Analyst so please do your own Analysis before taking any action.
The above view is shared just for educational purpose.
By no means shall be responsible for any losses amounting out of it incase if any trades on it.
It is just a view, pls trade at your own risk.

Poonawala Fincorp: Triple Bottom formationNSE:POONAWALLA is near the supply area.
A triple bottom formation seen around 300 price level.
In Hollow Candlestick patten a hollow green candle formed after a down swing, indicates price to move up
Well support from volume
RSI is trending upwards.
Trade :
Buy: Above 305, SL: 300, T: 309/311/316
Sell: Below 300, SL: 304, T: 296/292

Comex Gold(XAUUSD): Monday - 12/12/22Supports : 1790, 1786, 1781, 17754
Resistance : 1796-1797 supply zone, 1806
Right now FXOPEN:XAUUSD is in intraday uptrend clearly. A few points to be noted:
The price is in an uptrend regression channel as shown in the chart (blue-pink channel).
In last 3 days in hourly chart, one can see the price is making higher highs, however RSI is not able to cope up with the higher highs (shown as dotted green line). So there is a clear negative divergence in the hourly chart indication of momentum exhaustion .
1790-91 will be the most crucial level to watch for. The fib 61.8% is there as well. A breakdown of that level means the uptrend channel also broken. SL: 1795.
On higher side, 1805-1806 is the level above which, if price sustains, can go Long with SL of 1996.

NIFTY: Breakout on 15min TFNifty gave a breakout on 15min TF towards the late end of today's session.
Daily RSI has also bounced from 60 levels. Since W and M RSI are already >60, Daily RSI>60 indicates super bullishness going ahead.
Nifty seems good for buy on Dips.

Positional trading opportunity AARTIINDAarti industries is at 200 EMA on weekly timeframe.
And upon observing RSI, a clear Positive divergence can be spotted.
This is a good positional trading opportunity.
Do your own analysis before taking any position.

Multi Timeframe Analysis on ACCELYA The chart above says it all.
Daily TF Analysis :- If you look at daily TF you will find this stock made a high of 1530-1540 last year, then it fell down.
This year in November 2nd week it broke out that level and right now it is retesting that previous resistance level.
From price action point of view this is a good entry point.
Hourly TF Analysis :- in hourly time frame a good support can be seen forming, right now the RSI is also at 23 (Highly Oversold).
15 Minute TF Analysis :- in M15 the RSI value is at 21, indicating oversold condition in this timeframe also.
Conclusion :- this stock can be a good candidate for swing as well as positional trading.
For swing trade Entry would be - 1530, SL - 1480, Target - 1670 (Risk : Reward = 1 : 2.8).
Disclaimer - Do your own research before taking any Trades.

India VIX - Future Possibilities #IndiaVixNSE:INDIAVIX - Weekly Chart
For the time being, it appears that 12 is a good support level and 16 is a good resistance level.
Please keep in mind that #IndiaVix is a simple concept that describes how quickly and unpredictably the Nifty 50 index is expected to change over the next 30 days.
Consider volatility to be negligible/dead below 15.
Above 23, consider jitters/pessimism in market sentiment.
Consider fear in the market sentiment above 28.
At 10-11 range, I expect markets to top out, which may result in profit booking or distribution at higher levels. At this VIX level, I would be extremely cautious of the market because there is a negative correlation between the India Vix and the Nifty 50, which is also reflected in the charts. Markets typically peak when the VIX is at its lowest, and markets typically bottom when the VIX is at its highest. This is an important input for index trades.
You'll also notice that I've drawn yellow vertical lines for the last six years to indicate the first week of January, when volatility begins to rise before the budget session ( also reflecting with red arrows ). I would expect the VIX to begin rising around December 15th to December 18th and may hover around 18 to 20 levels right before budget ( indicated with 2 double red arrows )
p.s - Please note any negative news can spike VIX by 10% in no time
Let's see how the story develops. Best wishes!
Disclaimer -
- The opinions expressed here are my own. This is for my own records as well as what I see on charts.
- If you are referring to this, please keep in mind that it is only for educational and research purposes.
- Past performance is no guarantee of future results.
- You must accept responsibility for any decision you make. DO NOT TAKE THIS AS AN INVESTMENT RECOMMENDATION.
- It's your hard-earned cash. Trade / Invest wisely, keeping in mind your trading style, goals and objectives, time horizon, and risk tolerance.
- Before investing, conduct your own research and consult with a financial advisor.
TIA!

Bearish RSI divergence in GLENMARKAs seen in today's trading session, GLENMARK stock is trading in bearish RSI divergence pattern, so reversal entry will take new high level of 445- and its short reversal target can be upto below 420 level.

USDINR: Bearish Divergence in hourly chartIn FX_IDC:USDINR here are the features we can see:
There is a clear bullishness throughout the session. I would say Very Bullish. All candles are hollow and green in hourly charts.
There is a bearish divergence in the #USDINR hour chart. Price highs are not sustained by RSI new highs - shown in the photo
Most likely: the uptrend will pause as there is a momentum missing.
So Dec Future is a short candidate for USDINR.

Natural Gas (MCX): Week of 05/12/2022In Hourly chart, MCX Natural Gas (NG) is showing a positive divergence. It's clear.
The price is making lows, but the RSI is making higher low. Means price will go up to follow the RSI momemtum.
Max OI for Dec'23 expiry: 550 has max Call and PUT (2.5K total - that's pretty high in NG terms).
Trade Plan:
Expecting price will bounce back from CMP upto 560. Then will again retest this 550-535 zone and may consolidate there.
Trade:
Buy zone: On breakout of 560, SL: 540, T: 600
Sell zone: On breakdown of 530, SL: 550, T: 500

Granules India: BULLISHThe stock looks bullish in short term and offers a small trade for long due to following reasons:
1) The stock is rebounding from a demand zone from which it gave a strong rally
2) RSI Divergence is also in formation
The stock may go up to the marked supply zone at which we also see significant price action.
Only for educational purposes.

Bajaj Finserve Cmp 1639 dated 1-2-2022 Support & ReversedBajaj Finserve Cmp 1639 dated 1-2-2022
1. Taking support @ support Line & taking
reversal.
2. GOOD RRR.
3. RSI Reversal
Buy @ Cmp for target 1675-1700-1750-1785 SL 1600
Disclaimer :
I am not a Sebi registered Analyst so please do your own Analysis before taking any action.
The above view is shared just for educational purpose.
By no means shall be responsible for any losses amounting out of it incase if any trades on it.
It is just a view, pls trade at your own risk.

NIFTY ANALYSIS AND INTRADAY PICKSNIFTY ON 30-11-2022
The Bullish sentiments continued and the Bulls had upper hands throughout the session and the Index defended 18600 comfortably and compelled the Bears to throw the towel which finally led to short covering in the final hours and consequently Index made a new all time high of 18816.05.
AUTO and METAL emerged as the leaders with the gains of 1.72% and 1.81% respectively while profit booking was observed in PSU BANK which remained the only index closed in Red.
NIFTY closed at 18758.35 with a gain of 0.75% making a Bullish candle on daily chart.
Technical View : (Daily Chart)
NIFTY has made a Bullish candle which indicates ( in combination of other indicators) the Bullish sentiment.
NIFTY is moving above EMA 13, 21, 34 and EMA 21< EMA34<EMA13 which can be interpreted as the short and mid-term trend is positive.
RSI at 73.02 indicates that one should become cautious as Index has technically entered into the overbought zone and it is most likely that profit booking from higher level be observed during tomorrow’s session.
Support and Resistance : Daily Chart
18700-650 will work as the first support level for NIFTY and below this 18600 will hold strong support during tomorrow’s session.
On the upper side NIFTY will face resistance in the range of 18750-800 (This level is based on Options Data).
View for Traders:
As discussed above that technically Index is already in overbought zone and hence traders must trade with a cautious outlook during tomorrow’s session.
However, it doesn’t mean that there is any effect on the current bullish sentiments.
The only thing a trader should do at current levels is to trade with discipline i.e. trade with strict Stoploss.
If the other factors are considered then we find that Global cues are positive as US and Europe both have closed in Green with significant gains after the statement made by Powell in US.
The buying from FII is positive.
Hence, considering all these factors it seems lucrative to buy NIFTY in the range of 18700-750 for target of 18850-875. SL may be put below 18700.
Though it seems unwise to sell NIFTY but as tomorrow is weekly expiry hence, the sellers may take their chances near 19000 for target of 18900-850. SL may be put above 19025.
TOMORROW’S INTRADAY PICKS
1. HDFC BANK
Buy in the range of 1608-1612
Target 1631
SL 1595.
2. BHARAT FORGE
Buy in the range of 855-857.
Target 872
SL : 847

Rising Momentum in Asian PaintsMAcD indicates that the momentum is rising in asianpaints. Expecting a Target of 3188+ in the next few days.
#swingtrading

ultracement longterm buyultratech cement
buy 7000
stoploss 6800
target 7800
ultratech cement multi pattern breakout

Pidilite Cmp 2728 dated 29-11-2022 Triangle & RSI BOPidilite Cmp 2728 dated 29-11-2022
1. Ascending Triangle Bo @ 2720.
2. RSI BO
Buy @ Cmp for target 2750-2785-2840-2895
SL 2650
Disclaimer :
I am not a Sebi registered Analyst so please do your own Analysis before taking any action.
The above view is shared just for educational purpose.
By no means shall be responsible for any losses amounting out of it incase if any trades on it.
It is just a view, pls trade at your own risk.

Short - Ambuja Cements - Daily!(Daily - 11/29)
A) Bearish H&S pattern formation uncovering
B) Head and left shoulder has bearish divergence on Stochastic
C) MACD indicator already bearish
D) Volume decreasing from peak to peak
E) Failed testing of previous High H1 in Sep
F) possible short below 555 with the breaking of Monthly Pivot R1

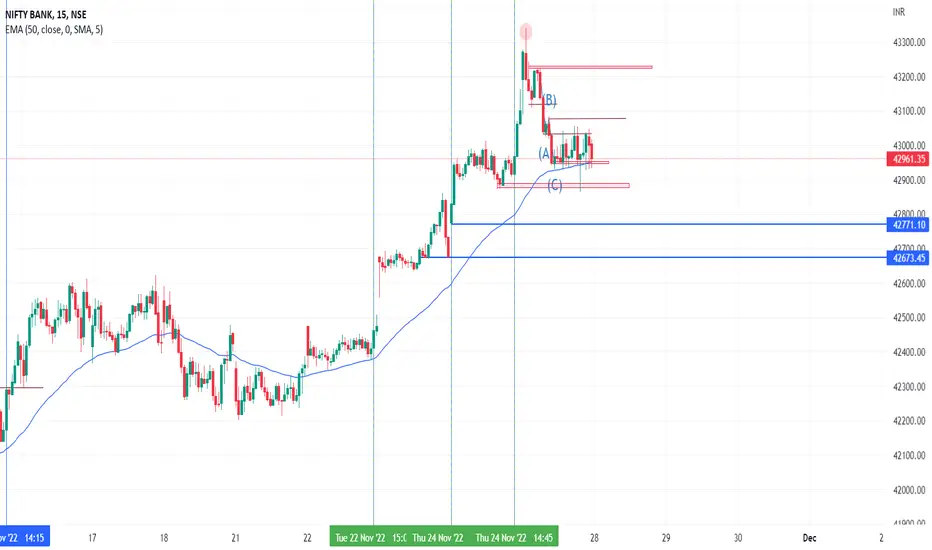
Bank Nifty Cmp 42984 dated 25-11-2022Bank Nifty Cmp 42984 dated 25-11-2022
1. Dark Cloud Cover Candle @ top of the chart
Sell only below 42850 for target 42500-42350-42000
SL 43200
Disclaimer :
I am not a Sebi registered Analyst so please do your own Analysis before taking any action.
The above view is shared just for educational purpose.
By no means shall be responsible for any losses amounting out of it incase if any trades on it.
It is just a view, pls trade at your own risk.

Eicher Motors Cmp 3414 dated 25-11-2022 Bullish Candle @ bottomEicher Motors Cmp 3414 dated 25-11-2022
1. Fridays Candle has Engulfed last 4 days
candle.
2. RSI reversal & BO.
Buy above 3425 for target 3450-3500-3550-3600
SL 3350 (closing basis)
Disclaimer :
I am not a Sebi registered Analyst so please do your own Analysis before taking any action.
The above view is shared just for educational purpose.
By no means shall be responsible for any losses amounting out of it incase if any trades on it.
It is just a view, pls trade at your own risk.

Trend line with RSI and MACD back test trend line with RSI and MACD and cross over 60 in 15 min and 5 min best result....
MPHASIS CMP 1941 DATED 24-11-2022 BULLISH PIERCING CANDLEMPHASIS Cmp 1941 dated 24-11-2022
1. After a correction of 22 % from recent high of
2447 today reversal sign seen on chart.
2. Bullish Piercing Candle @ bottom of chart.
3. RSI reversal
4. On weekly chart Hammer candle is made.
Buy above 1950 for target 2050-2150-2235-2300
SL 1895
Disclaimer :
I am not a Sebi registered Analyst so please do your own Analysis before taking any action.
The above view is shared just for educational purpose.
By no means shall be responsible for any losses amounting out of it incase if any trades on it.
It is just a view, pls trade at your own risk.
