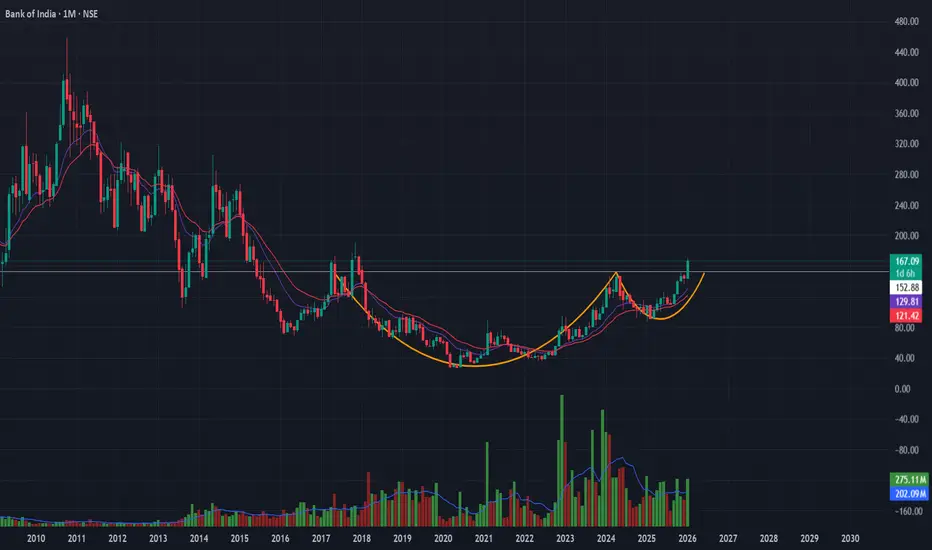
Bank of India | Cup & Handle Breakout SetupStructure:
Long-term Cup & Handle pattern nearing completion on monthly timeframe, indicating accumulation after a prolonged base.
Confirmation Signals:
-Volume expanding on rallies
-RSI above 50 and rising
-OBV trending higher → accumulation visible
-Price holding above short-term EMAs
Trade Plan:
-Buy: Sustained breakout above ₹151
-Targets: ₹199 → ₹268
-Stop-loss: ₹134 (ATR-based, structure-valid)
-Risk–Reward: ~1:5
Community ideas
#XAU/USD Sell Trade Scenario.Here’s an up-to-date XAU/USD Sell trade outlook (technical + fundamental) to help you assess whether positioning for a Downside makes sense right now.
Thank You......

GIFTNIFTY IntraSwing Levels for 29th JAN 2026GIFTNIFTY IntraSwing Levels for 29th JAN 2026
🚀Follow & Compare NIFTY spot Post for Taking Trade
💥Level Interpretation / description:
L#1: If the candle crossed & stays above the “Buy Gen”, it is treated / considered as Bullish bias.
L#2: Possibility / Probability of REVERSAL near RLB#1 & UBTgt
L#3: If the candle stays above “Sell Gen” but below “Buy Gen”, it is treated / considered as Sidewise. Aggressive Traders can take Long position near “Sell Gen” either retesting or crossed from Below & vice-versa i.e. can take Short position near “Buy Gen” either retesting or crossed downward from Above.
L#4: If the candle crossed & stays below the “Sell Gen”, it is treated / considered a Bearish bias.
L#5: Possibility / Probability of REVERSAL near RLS#1 & USTgt
HZB (Buy side) & HZS (Sell side) => Hurdle Zone,
*** Specialty of “HZB#1, HZB#2 HZS#1 & HZS#2” is Sidewise (behaviour in Nature)
Rest Plotted and Mentioned on Chart
Color code Used:
Green =. Positive bias.
Red =. Negative bias.
RED in Between Green means Trend Finder / Momentum Change
/ CYCLE Change and Vice Versa.
Notice One thing: HOW LEVELS are Working.
Use any Momentum Indicator / Oscillator or as you "USED to" to Take entry.
━━━━━━━━━━━━━━━━━━━━━━━━━━━━━━━━━━━━━━━━━━━
⚠️ DISCLAIMER:
The information, views, and ideas shared here are purely for educational and informational purposes only. They are not intended as investment advice or a recommendation to buy, sell, or hold any financial instruments. I am not a SEBI-registered financial adviser.
Trading and investing in the stock market involves risk, and you should do your own research and analysis. You are solely responsible for any decisions made based on this research.
"As HARD EARNED MONEY IS YOUR's, So DECISION SHOULD HAVE TO BE YOUR's".
━━━━━━━━━━━━━━━━━━━━━━━━━━━━━━━━━
❇️ Follow notification about periodical View
💥 Do Comment for Stock WEEKLY Level Analysis.🚀
📊 Do you agree with this view?
✈️ HIT THE PLANE ICON if this technical observation resonates with you. It will Motivate me.
━━━━━━━━━━━━━━━━━━━━━━━━━━━━━━━━━
💡 If You LOOKING any CHART & want for Level and ANALYZE?
Share your desired stock names in the comments below! I will try to analyze the chart Levels, patterns and share my technical view (so far my Knowledge).
If Viewers think It can identify meaningful setups. Looking forward to hearing from all of you — let's keep this discussion going and help each other make better trading decisions.

Nifty Realty - An Ignored HIDDEN GEM at solid Risk RewardThis is a ratio chart of Nifty Realty compared to NSE 500
A classic cup formation is being seen on multi year level where nifty realty is in a rising channel formation making higher lows for past 2-3 times since covid
Right now index has taken support again at channel low and reversal looks likely
A series of higher lows, increasing volumes, rising channel and a cup formation all together indicate good solid bullishness on real estate stocks outperforming cnx 500.

VEDL - Multi year breakoutThis a 3M time frame chart. Simple, clean and elegant. Please note this a very broad time frame chart so this cannot be a swing trade or short term trade, the minimum time of investment should be 6M.
We can target a return in the range of 60%-100%

NATIONALUMDoing a retest after Multiyear breakout. Expecting it to hold. If successful, 240-250+ on the cards.
With Infra and EV Spend, this stock will surely will be in play.
For tracking purposes only

Nifty50 analysis(29/1/2026).CPR: narrow + ascending cpr: trending day.
FII: 480.26 bought
DII: 3,360.59 bought.
Highest OI: 25500and25300 put oi and 25300 and 25200 call oi.
P.C.R: 0.8 mild bullish.
Resistance:25500.
Support : 25150
conclusion:
My pov:
1.the first price resistance is 25450 if it crossed then bulish.
2.until 24900 is crossed below down only bullish pov.
3.today trending day so plan accordingly.
What IF:
1.if price breaks 24900 and closed in day candle then overall trend continues.
2.bullishness continues if it crossed 25450.
psychology fact:
embrace uncertainty, become skilled don't wait, go for it.
note:
8moving average ling is blue colour.
20moving average line is green colour
50moving average line is red colour.
200moving average line is black colour.
cpr is for trend analysis.
MA line is for support and resistance.
Disclaimer:
Iam not Sebi registered so i started this as a hobby, please do your own analysis, any profit/loss you gained is not my concern. I can be wrong please do not take it seriously thank you.

Range 25050 to 26000 POSITIVE NIFTY PCR
>1 SELLING PRESSURE" is key. Most retail traders buy options, but the "Smart Money" (Institutions) usually sells them.
If Call OI Change is much higher than Put OI Change, the "sellers" are dominating the upside, expecting the market to stay down or sideways.
The PCR (Put-Call Ratio) Change helps you see if the sentiment is shifting. If the PCR Change is decreasing, the market is becoming more bearish relative to the previous day.
Interpreting Data
Looking at the "OTM ONLY" (Out-of-the-Money) section , we can see how professional "sellers" are positioning themselves:
Metric Observation Market Sentiment
Sum of Call OI Change High positive values (e.g., 750,461) Aggressive Call writing. Traders are betting on a "ceiling" for the price.
Sum of Put OI Change Moderate positive value Moderate Put writing. Some support is forming, but it's weaker than the resistance.
PCR OI Change Values like 0.22 When this is low, it indicates the day was dominated by Call additions, suggesting a Bearish or cautious outlook.

Market Outlook & Trade Setup – Wednesday, 29th January 2025🔹 NIFTY
* Previous Close: 25,342
* Expected Range: 25,000 – 25,200
🔹 SENSEX
* Previous Close: 82,344
* Expected Range: 82,000 - 83,000
🌍 Global & Market Sentiment
* DJIA: +12 | S&P: -0.57
💰 Institutional Activity (Cash Market)
* FII: Net Sellers: + ₹ 480 Cr
* DII: Net Buyers: + ₹ 3361 Cr
🔥 Events this Week: US --- Trump Speech & FED Rate announcement
📌 Sectoral Focus
Metal, PSU Bank, Pvt Bank
👉 Commodities in Focus: Gold, Silver, Copper
💯 Important Quarterly Results: Cupid, GHCL, HUDCO, IEX, ITC,REC, Voltas
📈 Trade smart. Manage risk. Stay disciplined.

#BANKNIFTY PE & CE Levels(29/01/2026)Bank Nifty is expected to open flat, indicating a pause in momentum after the recent sharp recovery from lower levels. Such flat openings generally signal indecision in the market, especially when the index is trading close to an important resistance zone. At present, Bank Nifty is hovering near the 59550–59600 area, which has acted as a strong supply zone in recent sessions. This makes today’s trade more level-driven, with higher chances of range-bound movement and sudden volatility around key levels.
From a broader structure perspective, the index has bounced strongly from the sub-58500 region, mainly due to short covering. However, as price approaches higher resistance zones, fresh buying strength needs confirmation. Until that happens, the market may either consolidate in a narrow range or show false breakouts followed by quick reversals. Traders should avoid anticipating moves and instead react to confirmed price action.
On the bullish side, if Bank Nifty manages to sustain above 59550 on a 15-minute closing basis, it would indicate that buyers are gaining control despite the overhead supply. In such a scenario, call options can be considered above 59550. The first upside target would be around 59750, which is a minor resistance and a good zone for partial profit booking. If momentum continues, the next levels to watch are 59850 and then 59950 or higher. Near the 60000 psychological level, strong profit booking is expected, so trailing stop-loss becomes crucial for long positions.
On the bearish side, failure to hold above 59550 followed by a breakdown below the 59450–59400 zone would indicate rejection from higher levels. This would open the door for a corrective move. In that case, put options can be considered around 59450–59400. The immediate downside targets would be 59250 and then 59150. If selling pressure increases, the index could drift toward the 59050–59000 support zone. A clear break below 59050 would weaken the structure further, though such a move would likely require negative global cues or heavy institutional selling.
For intraday traders, the zone between 59450 and 59550 should be treated as a no-trade area, as price action here can be choppy and misleading. The best trades are expected only after the market shows clear acceptance above resistance or below support. Partial profit booking at every target and strict risk management are essential due to the possibility of sudden spikes on either side.
Overall, Bank Nifty is at a crucial decision point. Sustained trade above 59550 favors bullish continuation, while rejection and breakdown below 59400 may lead to a pullback. The session is likely to be volatile but structured, rewarding traders who stick to levels, wait for confirmation, and avoid emotional or over-leveraged positions.

TCS: Structure Hints at a Possible Final PushThe move from the recent highs appears to be a Wave 4 corrective phase , unfolding in an ABC structure rather than an impulsive decline.
Price has reacted near the 0.618 Fibonacci retracement , a typical zone where Wave 4 tends to stabilize.
If this structure holds, Wave 5 could be setting up , but confirmation comes only with a reclaim of the 200-DMA and sustained strength above the recent range.
A break below 3070 would invalidate this count and signal that the correction is still evolving.
Structure first. Bias later.
Disclaimer: This analysis is for educational purposes only and does not constitute investment advice. Please do your own research (DYOR) before making any trading decisions.

AUDJPY : Bulls Defending the Line 106.60 !AUDJPY has undergone a significant correction, sliding from the 109.00 peak down to the 106.20 region. However, the bears have hit a massive roadblock. We are currently seeing a strong reaction from a historical demand zone (105.80 – 106.00), marked by the clear rejections in the shaded circles on the chart.
🔍 The Critical Battleground: 106.00 – 106.60
The price is currently hovering around 106.57. This "buffer zone" between current levels and the demand floor is make-or-break for the next major move.
🚀 The Bullish Scenario (Hold & Bounce)
If buyers can maintain support above 106.60 and consolidate north of the demand zone, we have a clear path for a recovery.
Target: 🎯 108.15
Rationale: Sustained trading above 106.60 confirms that the historical demand is holding and the correction is over.
One more chance is price slides down till 106 and then bounce back above 106.50 which transforms into re-entry.
⚠️ The Bearish Scenario (Break & Flush)
If the bulls lose their grip and the price slides back through the floor, I’ll be switching my bias.
Trigger: A clean break below 105.85.
Target: 🎯 104.80
Rationale: Once 105.80 fails, the historical support flips to resistance, opening the trapdoor for a deeper sell-off.
💡 Summary: I am watching the 106.60 level closely. As long as we stay above it, the outlook remains cautiously optimistic for a move back toward 108+.

BTCUSD 4H –Demand-to-Resistance Reversal Setup (Structured Long)Market Context
BITSTAMP:BTCUSD is currently reacting from a 4H demand zone after a sharp corrective move from the recent swing high. Price has printed a clear liquidity sweep below prior lows and is now attempting a reclaim of short-term structure.
Technical Breakdown
Strong 4H Demand (D) holding near the 88.9k–89.2k region
Clear reaction + displacement from demand, suggesting active buyers
Price is attempting to reclaim the 4H resistance flip zone (R)
EMA ribbon compression followed by early expansion → momentum shift
Structure aligns with a mean reversion → continuation move
Trade Plan (Illustrative)
Entry: On confirmation above 4H resistance / demand retest hold
Invalidation: Below demand zone low
TP1: ~93.4k (first opposing structure / imbalance fill)
TP2: ~97.7k (daily resistance / premium zone)
R:R remains favorable as long as demand holds and structure is respected
Bias
Neutral → Bullish while price holds above demand
Failure to hold demand invalidates the setup and opens downside continuation
Notes
This is a structure + supply/demand based idea, not a prediction
Best confirmation comes from lower timeframe acceptance and volume expansion
News events may increase volatility—manage risk accordingly
📌 This idea is for educational purposes only. Always manage risk and wait for confirmation.

GODREJPROP: Head & Shoulder pattern and Perfect CorrectionGODREJPROP: Head & Shoulder pattern and Perfect Correction
👉🏼 Godrej Properties Some Facts (as of January 29, 2026)
Godrej Properties, part of the Godrej Group, has been in the spotlight for its strong performance in CY 2025 and upcoming corporate updates. Here's a summary of the most recent developments based on available reports:
🌈1. Upcoming Q3 FY26 Results Announcement
The company's Board of Directors is scheduled to meet on February 5, 2026, to approve the unaudited financial results for Q3 FY26 (October-December 2025). This comes amid expectations of continued growth in bookings, though the realty sector faces headwinds from market volatility.
🌈2. Share Price Performance
As of January 28, 2026, Godrej Properties shares closed at ₹1,550.95 on the NSE, up 2.23% from the previous close, with intraday highs at ₹1,570. However, the stock has been under pressure earlier in the month, hitting a 52-week low amid a broader realty sector decline (down 2.4% on January 20). Historical data shows a dip from ₹1,706 on January 21 to ₹1,638 on January 23.
🌈3. Leadership in Residential Real Estate for CY 2025
Godrej Properties emerged as the leader in India's residential market for the second consecutive year in CY 2025, with record bookings of ₹34,171 crore, collections of ₹18,979 crore, and sales of 16,428 homes across 27.26 million sq. ft. The company launched 41 projects nationwide, reflecting resilience in demand. This positions it strongly for FY26, with new launches like the ultra-luxury Godrej Trilogy in Worli, Mumbai, projecting over ₹10,000 crore in revenue potential.
🌈4. Expansion and Land Deals
Recent expansions include entry into the Hyderabad housing market in January 2026. Earlier in November 2025, the company secured a 75-acre land deal in Nagpur, crossing its FY26 target.
🌈5. Group-Level News Impacting Properties
At the World Economic Forum in Davos (January 2026), Godrej Industries Chairman Adi Godrej indicated interest in acquisitions in consumer goods and animal feed sectors, signaling group-wide growth that could indirectly benefit the real estate arm through synergies.
The realty sector, including Godrej Properties, has faced broader market weakness in January due to FII outflows and global uncertainties, but analysts remain optimistic on its long-term prospects given strong bookings and expansions. For the latest stock updates or Q3 previews, keep an eye on the February 5 board meeting.
💯 INTRADAY & Positional Level will be Updated later. Keep following
━━━━━━━━━━━━━━━━━━━━━━━━━━━━━━━━━━━━━━━━━━━
⚠️ DISCLAIMER:
The information, views, and ideas shared here are purely for educational and informational purposes only. They are not intended as investment advice or a recommendation to buy, sell, or hold any financial instruments. I am not a SEBI-registered financial adviser.
Trading and investing in the stock market involves risk, and you should do your own research and analysis. You are solely responsible for any decisions made based on this research.
"🙏🏼As HARD EARNED MONEY IS YOUR's, So DECISION SHOULD HAVE TO BE YOUR's".

SILVER SPOT VIEWSILVER POSSIBLE MOVES
WAVE 4 102, 100
WAVE 5 120.00 , 125.00
98.00 BELOW SUSTAIN OR CLOSE INVALIDATION
View is for study purpose only , we are not recommend any trade or investment
Always do your own analysis

Tata Steel (4H) - Late Stage Structure: Ending Diagonal in PlayThe price action in Tata Steel on the 4H timeframe is showing characteristics of a potential Ending Diagonal forming near the tail end of the advance.
From the Wave 4 low at 177.33 , the rise has not developed as a clean 5-wave impulse . Instead, the internal structure so far appears corrective , unfolding in three waves , which keeps the Ending Diagonal scenario valid.
Structure Assessment
Wave (iii) of the 5th wave appears complete
The ongoing move is likely Wave (iv)
Cardinal rule of an Ending Diagonal: Wave (iv) must overlap Wave (i) by trading below ~191
If this overlap condition is satisfied, the final Wave (v) is expected to unfold as a three-wave advance , completing the Ending Diagonal.
Implications
Ending Diagonals typically signal trend exhaustion rather than continuation . Once the structure completes, the probability of a larger corrective phase increases.
Invalidation
No overlap below 191 weakens the Ending Diagonal view
A strong impulsive decline instead of a choppy correction would require a reassessment
For now, the focus remains on structure and rule compliance, not prediction.
Disclaimer:
This analysis is for educational purposes only and does not constitute investment advice. Please do your own research (DYOR) before making any trading decisions.

#XAUUSD (MEGICAL INDICATOR) Hello Friend's 👋
This Megical indicator works very well. If you trade using this indicator with the Good risk and reward, you can generate significant profits, as you can see in the chart. And it's works well in the long term Chart 📈

CRUDE FUTURE MCXCRUDE POSSIBLE MOVES
WAVE 4 5710 , 5618
WAVE 5 6050 , 6180
5448 BELOW SUSTAIN OR CLOSE INVALIDATION
View is for study purpose only , we are not recommend any trade or investment
Always do your own analysis

Nifty above 200DMANifty gained to hold above its 200DMA of 25170, expected to stay with positive bias as long as holds above 200DMA. There's no change in overall FIIs positions they hold 88% shorts among net open positions.

ORIENT ELECTRIC AT GOOD SUPPORTThe stock is trading at good support zone and can be worth for considering for short term investment. The candle sticks makes an entry with Risk Reward.

#BNB/USD Buy Trade Setup.Here’s an up-to-date BNB/USD Buy trade outlook (technical + fundamental) to help you assess whether positioning for a Upside makes sense right now.
Thank You......

Long @ 70: Support zones at 95 and 70HOOD share price has taken a beating and is down from its all time high of c.154, currently holding 104.5 (200DEMA.) However, the fall to 50 WEMA does not look farfetched at which point we can expect a temporary bounce back of 5/10% depending on overall market/index move... decision making move can be expected around 10th Feb i.e. its results day and one can track whether it reverses up or goes for its journey to previous resistance zone of 70.. a reversal from 70 seems to have a higher chance.
Long at 70.

OIL INDIA (OIL) — Breakout Confirmed | Strength with CautionOIL India has delivered a powerful upside move, entering a fresh price zone backed by strong market participation. The chart and data clearly indicate a shift in control toward buyers.
What the Market Is Telling Us 📊
Strong Breakout with Participation
The stock has decisively moved above a long-standing resistance area and is currently trading near ₹490.50.
This breakout is supported by heavy buying activity, reflecting strong interest from market participants.
Price is now well above its earlier trading zones, signaling a clear change in structure.
Market Sentiment
OIL India has been an outperformer compared to the broader market in recent sessions.
Momentum remains strong; however, the sharp rise also suggests the stock may be short-term stretched.
Increased volatility is possible after such a fast move, so disciplined positioning is important.
How to Approach from Here 🔍
Chasing at higher levels may carry risk. A controlled pullback could offer better risk-reward opportunities.
The earlier resistance area is likely to act as a support zone going forward.
As long as price holds above this zone, the broader trend remains constructive.
Final View
OIL India’s breakout reflects strength and renewed buying confidence. While the trend favors the upside, patience and selective entries remain key after a sharp rally.
—
Ayushi Shrivastava
NISM-Certified Research Analyst
⚠️ Disclaimer:
This post is for educational purposes only and does not constitute investment or trading advice. Please do your own research or consult a financial advisor before making any trading or investment decisions. We are not responsible for any profit or loss arising from the use of this information.
