Chart Analysis – Ujjivan Small Finance Bank (Monthly)Time frame: Monthly
Current Price Zone: ~₹63
Trend Structure: Long-term recovery with bullish continuation
1️⃣ Pattern Observation
The chart clearly shows a large Cup formation from 2019–2024.
A smaller cup (handle-like structure) formed during 2024–2025.
Price has now broken above the neckline resistance zone (~₹60–62) with strong momentum.
➡️ This is a classic Cup & Handle–type breakout, generally considered bullish on higher time frames.
2️⃣ Price Action & Momentum
Strong bullish candle with ~19% monthly gain, indicating institutional participation.
Higher highs and higher lows confirm trend reversal from long-term downtrend to uptrend.
Breakout is happening after consolidation, which improves reliability.
3️⃣ Key Levels
Immediate Support:
₹60–61 (previous resistance turned support)
₹55 (major structure support)
Resistance / Targets (based on structure):
₹68–70 (near-term psychological zone)
₹78–82 (measured move from cup depth, medium term)
₹90+ possible in long term if trend sustains and fundamentals support
4️⃣ Risk Factors to Watch
Any monthly close below ₹60 may indicate a false breakout.
Sharp vertical moves can lead to short-term pullbacks before continuation.
Broader market or banking sector weakness may impact momentum.
⚠️ Disclaimer
Disclaimer:
The above analysis is based solely on technical chart patterns and historical price action. It is for educational and informational purposes only and should not be considered as investment advice. Stock market investments are subject to market risks. Please consult a qualified financial advisor before making any investment decisions. Past performance does not guarantee future results.
Community ideas

The "Smart Money" Approach// WTI Oil: Bullish BOS & Demand RetesWTI is showing strong bullish momentum on the 1H timeframe. We just witnessed a clear Break of Structure (BOS) to the upside, signaling a continuation of the recent trend.

AVNT future potential level?This AVNTUSDT structure is tightening fast and when compression reaches this level, the next expansion usually isn’t small.
Price is approaching a decision point that could define the next multi-week move.
📌 Pattern Overview
AVNT is currently trading inside a descending wedge, a structure often seen during trend exhaustion phases.
Sellers are still active, but each push lower is getting weaker while buyers are quietly stepping in at higher lows.
This tells us distribution pressure is fading, and the market is preparing for a directional breakout.
📉 Key Levels
Support
• 0.3009 — Structural base of the wedge and prior demand reaction
• 0.2400 — Breakdown level where bullish structure fully fails
Resistance
• 0.3787 — Immediate supply + wedge resistance (decision level)
• 0.8736 — Major higher-timeframe resistance and upside objective
📈 Market Outlook
Bias remains neutral → bullish, but confirmation is still required.
Momentum shifts only after a clean close above 0.3787.
This is the type of zone where institutions wait for confirmation, not anticipation allowing liquidity to build before expansion.
🧭 Trade Scenarios
🟢 Bullish Scenario
• Entry trigger: 4H candle close above 0.3787
• First target: 0.45
• Second target: 0.87
• Reasoning: Wedge breakout + trend reversal structure favors upside continuation once supply is cleared
🔻 Bearish Scenario
• Breakdown trigger: Loss of 0.3009 support
• Target: 0.24
• Why: Failed structure confirms sellers remain in control and invalidates the reversal thesis
⚠️ Final Note
Don’t chase the breakout let price close and confirm before committing risk.
If you want more clean, no-noise chart breakdowns like this, follow for daily market structure analysis.

DAILY FOREX SCAN Session – 20 (28.01.26)Scanning multiple forex pairs to filter high-quality trade setups. No trades are forced—only structure-based opportunities.
Note: There may be a delay in this video due to upload processing time.
Disclaimer: FX trading involves high leverage and substantial risk, and losses can exceed your initial investment. This content is for educational purposes only and should not be considered financial advice. Trade at your own risk.

Sell if good soon possible be awareOANDA:XAUUSD
Gold is touching a very long time uper trend line can cause sell

UNIONBANK Price Action1. Set up - Breakout
2. Trend - Bullish
3. Strength - strong, as pull back
4. Rounding pattern TP is reached too

#AUD/USD Sell Trade Scenario.Here’s an up-to-date AUD/USD Sell trade outlook (technical + fundamental) to help you assess whether positioning for a Downside makes sense right now.
Thank You......

#USD/JPY Buy Trade Scenario.Here’s an up-to-date USD/JPY Buy trade outlook (technical + fundamental) to help you assess whether positioning for a Upside makes sense right now.
Thank You......

Why Chart Patterns Matter ?Chart patterns reflect real-time battle between buyers and sellers. Every high, low, candle close, and wick communicates intentions of institutions, retail traders, and algos.
For traders, chart patterns help in:
Identifying trend direction
Spotting reversal before confirmation
Planning entries, stop-loss, and take-profit zones
Understanding supply–demand imbalance
Filtering noise in volatile markets
Because patterns repeat across timeframes and markets (stocks, options, forex, crypto), they become reliable tools — especially when aligned with volume spikes and market structure breaks.

Finnifty Intraday Analysis for 28th January 2026 NSE:CNXFINANCE
Index has resistance near 27275 - 27325 range and if index crosses and sustains above this level then may reach near 27550 - 27600 range.
Finnifty has immediate support near 26825 – 26775 range and if this support is broken then index may tank near 26550 – 26500 range.
Index is expected to open positive because of the conducive outcome of India EU FTA along with Security and Defense Partnership and low February’26 F&O Contract carry forward. Trend in the short term shall be decided as per formation of F&O contracts in February’26 Month by FIIs, DIIs and Retails.

Midnifty Intraday Analysis for 28th January 2026NSE:NIFTY_MID_SELECT
Index has immediate resistance near 13275 – 13300 range and if index crosses and sustains above this level then may reach 13425 – 13450 range.
Midnifty has immediate support near 13025 – 13000 range and if this support is broken then index may tank near 12875 – 12850 range.
Index is expected to open positive because of the conducive outcome of India EU FTA along with Security and Defense Partnership and low February’26 F&O Contract carry forward. Trend in the short term shall be decided as per formation of F&O contracts in February’26 Month by FIIs, DIIs and Retails.

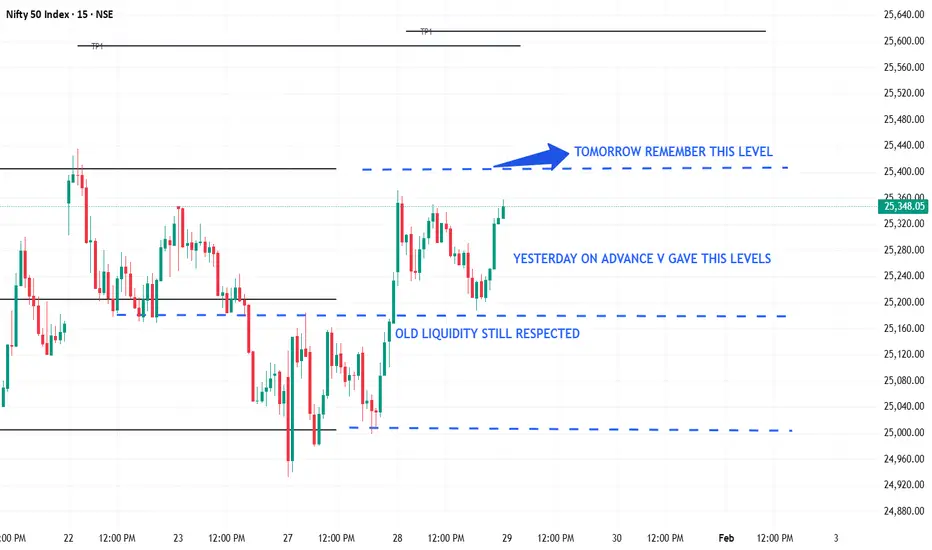
BANK NIFTY“Yesterday’s levels shared in advance.
Today price respected them perfectly.
Fresh levels marked — remember these for tomorrow.”

NIFTY “Yesterday’s levels shared in advance and respected.
Today marking fresh levels — remember these for tomorrow.
Liquidity keeps repeating.”
XAUUSD Might start profit booking.FOMC Today might move a lot during NY. XAUUSD Might start profit booking.

XAUUSD (Gold) | Bull vs Bear Scenerio | 28th Jan'2026XAUUSD (Gold) | Technical Outlook | 28 Jan 2026
Gold (XAU/USD) is trading near 5,291, maintaining a strong bullish trend across intraday, daily, and higher timeframes. Price is holding firmly above all major moving averages (MA5–MA200), confirming trend strength. Momentum indicators (MACD, ADX, ROC, Bull/Bear Power) support further upside, while oscillators (RSI, Stoch RSI, CCI, Williams %R) remain overbought, indicating strong momentum with chances of short-term pullbacks. Volatility remains high (ATR ~59), so key levels are crucial.
Key Levels
Support: 5,232 | 5,198 | 5,135 | 5,101
Resistance: 5,295 | 5,330 | 5,392
Intraday Pivot: 5,232
Breakout & Breakdown
Bullish (Breakout):
Buy Above: 5,295
Targets: 5,330 → 5,392 → 5,400
Trend continuation above resistance
Bearish (Breakdown):
Sell Below: 5,232
Targets: 5,198 → 5,135
Below 5,100 → 5,000–4,950 (correction zone)
Conclusion
Overall trend remains bullish. Buy-on-dips above support is preferred, but avoid chasing near highs due to overbought conditions. Trade strictly on breakout or breakdown confirmation with proper risk management.
Disclaimer :For educational purposes only. Gold trading involves high risk. Always use stop-loss and trade as per your risk appetite.

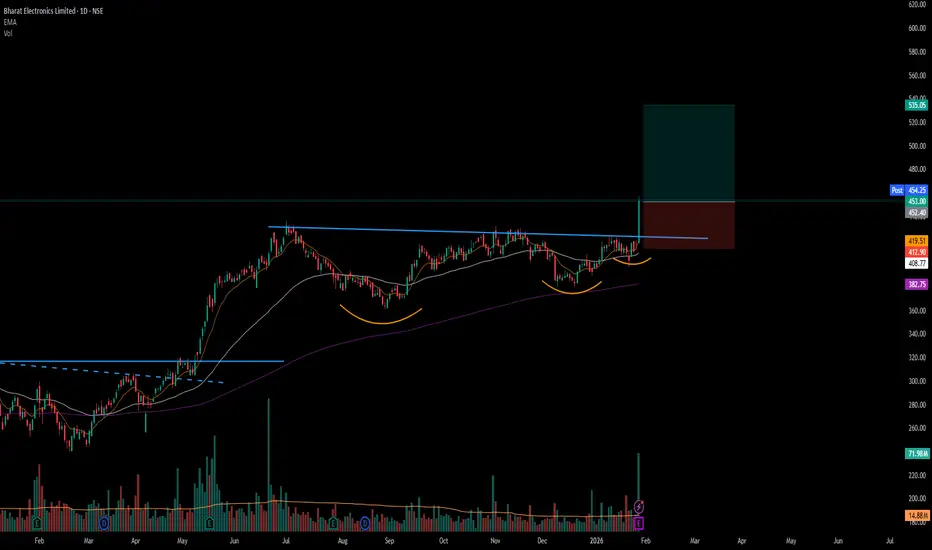
is BEL is getting ready for breakout?🔹 Timeframe: Daily
🔹 Trend Bias: Bullish
Price is moving near a key resistance zone on the daily chart
-Clear horizontal resistance tested multiple times
-Higher lows indicating accumulation
-Price holding above short & medium EMAs
🎯 What to Watch:
-Daily close above resistance for breakout confirmation
-Volume expansion on the breakout candle
Possible Targets once resistance break
target1: 440
target2: 450
Educational idea only. Not financial advice. Always manage risk.

BTC 4H UpdateAre we breaking out or faking out? 📉📈
Bitcoin is at a massive crossroads today, and the $91k level is the only thing that matters right now. We’ve seen some intense "chop" as the market prepares for today's FOMC decision.
My Technical Take:
Bullish Scenario: We need a clean flip of $91,195. If we hold that as support, I’m eyeing $95,621 as the first stop, with a potential run to $98k liquidity.
Bearish Scenario: If $91k stays as a ceiling, we likely visit the $86,355 support again. Keep a close eye on the $83k–$84k demand zone—if we drop there, that's where the real "dip-buying" begins.
The Game Plan: Volatility is the name of the game today. Don’t chase the initial wick; wait for the 4H candle close for confirmation. February is historically strong for BTC, so a breakout here could ignite a massive Q1 rally.
What’s your move? 👇 Are you Longing the breakout or Waiting for the $84k dip? Let’s talk in the replies!
#Bitcoin #BTC #CryptoTrading #FOMC #TechnicalAnalysis #TradingView #Web3

#BEL - VCP BreakOut in Daily Time Frame Script: BEL
Key highlights: 💡⚡
📈 VCP BreakOut in Daily Time Frame
📈 Volume spike during Breakout
📈 Base BreakOut
📈 RS Line making 52WH
📈 MACD Crossover
⚠️ Important: Market conditions are BAD, Avoid entering any Trade. Protect Capital Always
⚠️ Important: Always Exit the trade before any Event.
⚠️ Important: Always maintain your Risk:Reward Ratio as 1:2, with this RR, you only need a 33% win rate to Breakeven.
✅ Boost and Follow to never miss a new idea!✅
Disclaimer: I am not SEBI Registered Advisor. My posts are purely for training and educational purposes. Not a BUY or SELL recommendation.
Eat🍜 Sleep😴 TradingView📈 Repeat 🔁
Happy learning with MMT. Cheers!🥂
GARLAND PATTERN : HINDCOPPER ( Multi Year Breakout/Resistence)🌸 HINDCOPPER: The 15-Year "Garland" Pattern Complete
The Technical Setup: Beyond the Cup & Handle
While amateur analysts will call this a "Rounding Bottom" or a "Cup and Handle," true veterans of the Indian market recognize this as a Garland Pattern.
Why? Because a "Garland" (Mala) is what you put on a photo of someone who has passed away. If you bought HINDCOPPER at the peak in 2010 (around ₹600+), your capital has essentially been "dead" for 15 years. This breakout isn't just a price move; it’s a resurrection.
1. The "Cemetery" Zone (2010 - 2024)
The Long Sleep: For over a decade, this stock was a graveyard for retail investors. Every "dip" was a trap, and every "rally" was a ghost.
The Survivors: If you are still holding from 2010, you aren't a trader; you are a legendary "Bagholder Emeritus." This garland is for your patience.
2. The Resurrection (Jan 2026)
The Breakout: We have finally cleared the ₹625 level. In technical terms, the "Ghost of 2010" has been exorcised.
The Volume: The massive green bars at the bottom are the "Electric Shock" that brought this 15-year-old corpse back to life.
3. Fundamental "Dark" Truths
Copper is the New Blood: The world needs copper for EVs and AI, and HINDCOPPER is finally waking up to realize it’s the only primary producer in the country.
Inflation Reality: ₹600 in 2010 is not the same as ₹600 in 2026. While the price has "broken out," the purchasing power of those 2010 buyers is still in the ICU.
Strategy: How to Trade a Ghost?
Entry: Only if you have a pulse. The breakout at ₹625 is the "Entry of the Century."
Support: ₹600 is now the "Floor of the Mausoleum." If we stay above it, the afterlife looks bright.
Target: ₹850. Let's give those 2010 buyers some actual profit before the next decade begins.

BEL: A TEXTBOOK SYMMETRIC TRIANGLE BREAK OUT• BEL is on uptrend and forming higher high pattern in weekly basis.
• It made a strong parallel channel break out on 2024-May to 2024-Jun.
• Stock was consolidating from 2024-Jul.
• It forms a symmetric triangle and consolidated for last 7 month (211 days!)
• Today (28-01-2026) it gives a strong break out.
• Significate volume surge could be observed.
• An entry could be made near 440-450 zone with a SL below the trendline near 419.
• Consolidation range is 436-360=75 points. Hence Target 1 = 450+75=525 and Target 2 =450+75*2=600.
• Watch out psychological resistance at 500!! Trail and enjoy the bull ride.
• Educational purpose only. Happy learning.

PC Jeweller |360° Analysis for Fresh Buyers and Exit holderPC Jeweller Ltd | Educational 360° Technical Review (Weekly Chart)
Higher-Timeframe Structure (Trend Context)
PC Jeweller completed a strong up-cycle and formed a distribution top in the ₹17–19 zone, where multiple higher highs failed to sustain. The sharp rejection and follow-through selling confirm a trend transition from expansion to correction on the higher timeframe.
Current Price Location (Structure + VWAP)
Price is currently trading around ₹10–11, positioned below the weekly VWAP and below the prior value area near ₹12. This places the stock in a weak-to-neutral structure, where price is reacting but has not yet established a confirmed accumulation base.
Volume Profile & Order-Flow Read
VRVP shows the highest historical volume participation near ₹2.5–3.0, marking the strongest long-term demand zone. The ₹9.5–11.5 range shows relatively lighter volume, suggesting this is a reaction zone rather than a high-conviction accumulation area. CVD remains negative, indicating selling pressure is still present.
Relative Strength Analysis (Custom Indicator Insight)
Using the Stock Relative Strength vs NIFTY Sector Index (JANGID) indicator, PC Jeweller shows relative weakness versus the Consumption sector index. The stock is not outperforming its sector, indicating that capital is currently favoring other consumption names and reinforcing the cautious stance for fresh entries.
Best Zones for Fresh Buyers & Existing Holders
From a structure, volume, and relative strength perspective, the higher-probability demand zone lies between ₹7.5–8.5. Fresh participants may prefer waiting for price interaction or confirmation near this zone. For holders from higher levels, averaging near ₹8–9 offers a better risk framework compared to averaging at mid-range prices.
Educational Trade Framework & Risk Levels
• Fresh buying reference: ₹7.5–8.5
• Averaging reference (for higher holders): ₹8–9 after stabilization
• Recovery / supply zones: ₹12–13.5 (≈ +35–55%), extended ₹15–16 (≈ +70–90%)
• Structural invalidation: Weekly close below ₹7
• This analysis is shared strictly for educational discussion, highlighting structure and relative performance, with risk management remaining the responsibility of each participant.

Part 1 Intraday Institutional Trading How Institutions Trade Options
Institutions use:
Delta hedging
Gamma scalping
Volatility Arbitrage
Neutral strategies
They focus more on:
Probability
Volatility cycles
Liquidity zones
Mean reversion
Understanding institutional behavior helps traders make better decisions, especially when reading volume profiles and OI shifts.

Highlight of the day: Silver again up by 6%Silver rose to a new high by 6% heading towards ₹ 4 lac / kg apparently.
