NZDUSD MULTI TIMEFRAME ANALYSIS Hi traders, this is the complete multi-time frame analysis for this pair. Please feel free to ask any questions in the comment section below. The entry will only be made if all strategy rules are met.
Community ideas

FOXCONN of India - A overlook on DIXON TECHNSE:DIXON
Hey Folks,
Today we are talking about Dixon Technologies aka foxconn of India. the Q3 results shows +68% in PAT. which looks good as headline numbers. but diving deep I found that Dixon tech slides over a thin margin module as it is high-volume producer to marquee clients and that operating margin didn't show up as good as the other metrics, which seems attractive.
So, considering current geopolitics any slight hike in raw material could easily affect the operating cost thus affect on the profits.
But Yesterday, we found out the US INDIA Trade Deal out of blue which likely seemed to give more edge to the company in the export service. also the New budget aligns in favour with the manufacturing sector, that's also likely to give certain edge if the company keep the capital expenditure in check with the expectation to the last quarter.
Now, looking technically for long term perspective on the weekly chart. it has sustained above the 200EMA with a large green candle today. Also it closed above the last key support of 10650 (horizontal line in the chart). next target is the 0.78 level of fib i.e. 11700 to tackle. if it breaks that finds it fair value above that zone. we might see the new high of DIXON in near future.
I do not complicate much in technicals for long term view. So open to discussion how you look at it.
:) Thanks. Happy trading.

AUDUSD MULTI TIMEFRAME ANALYSIS Hi traders, this is the complete multi-time frame analysis for this pair. Please feel free to ask any questions in the comment section below. The entry will only be made if all strategy rules are met.

XAUUSD MULTI TIMEFRAME ANALYSIS Hi traders, this is the complete multi-time frame analysis for this pair. Please feel free to ask any questions in the comment section below. The entry will only be made if all strategy rules are met.

TSM | Bullish Scenario After Liquidity Reaction
NYSE:TSM
Bias: Bullish
Price is currently reacting from a liquidity-driven area. If price retraces toward the 340 zone and holds structure, I will look for bullish continuation aligned with higher-timeframe context.
Invalidation: Acceptance below 318 would negate the bullish scenario.
Upside objective: Fibonacci level around 389.
This is a scenario-based probability framework, not a trade signal. Execution depends on confirmation and risk management.

Trade Catalyst Series - Episode 2 // GOKALDAS EXPORTSHey folks,
Today in new developing events in US-India deals, I have come with another stock to lookout.
This one is focused only for long-term window with the latest Reciprocal tariffs in talk.
1. Macro Overview
The US-India Interim Trade Agreement published today is a structural game changer for Indian textiles.
The Headline: US Reciprocal Tariffs on Indian exports (apparel) slashed from ~50% to 18%.
The Significance: This is not just a rollback; it is a competitive flip. For the last decade, India (tariff ~20%+) lost share to Vietnam and Bangladesh (zero or low duty).
But now new Hierarchy we have :
India: ~18% Duty
Vietnam/Bangladesh: ~20% Duty
China: ~30-35%+ Duty
Result: India is now the most cost-efficient sourcing hub for US brands.
2. Sector Impact: The "China+1" Accelerator
The entire Indian textile export sector moves from "survival mode" to "growth mode."
Exporters were absorbing 10-15% of the tariff burden to keep clients. This cost instantly vanishes, flowing directly to the bottom line.
US brands will likely to shift volume from Vietnam to India capturing the 2% duty spread.
3. Stock Spotlight: Why GOKEX you ask?
Gokaldas Exports is the highest-beta play on this specific catalyst.
~70% of GOKEX’s revenue comes from the US. No other major listed player (KPR Mill, Trident) has this level of direct sensitivity to US tariffs.
GOKEX recently acquired Atraco (Kenya) and Matrix (India). These assets were dragging earnings due to low utilization. With the tariff barrier removed, GOKEX can fill these factories with high-margin US orders.
4. Fundamental Check
Q3 FY26 (Bottom): Net profit crashed 71% YoY to inr14.6 Cr; Margins slumped to 7.7%. This is now priced in as the worst-case scenario.
FY27 Outlook (Recovery):
Revenue is expected to grow 15-20% as order books swell.
Margins: Projected to reduce back to 11-13% + tariff savings.
Valuation: Trading at ~26x depressed earnings. If earnings double in FY27 (base case on margin normalization), forward P/E drops to an attractive 13-15x.
5. Technical Setup - Daily Chart
The stock has already rallied ~40% this week.
Now on daily frame the RSI shows it is in overbought zone due to rush buying of the stock.
Next to watch out is for a minor pull back to the near support zone (here 0.786 level of fib) to make an entry.
the next resistance to watch will be 900. for that I would be monitoring the order book of the company in the next quarter.
6. Key Risks
-> The stock already rallied ~40% on rumors. A short-term dip is highly likely as other traders book profits.
->US Recession: Lower tariffs don't matter if US consumers stop buying clothes. Monitor US retail data closely.
-> A strengthening of rupee could eat into the new margin gains.
7. Final Verdict
I am long on this one so will be keep buying on Dips.
first Entry : 700-720
T1 : 1000
T2 : 1150
SL : 650
The 18% tariff rate is giving Indian exports distinct edge over Vietnam. so major focus after entry will be on the management commentary of order book visibility for Q1 FY27. If this all confirms volume shifts from Vietnam, the stock heads to inr1,000+, achieving our t2 or a new ATH.
Future episodes will explore additional sectors and companies that could emerge as beneficiaries of evolving global trade partnerships. If your eye catches on to some particular stock reflecting on the same let me know in the comments below I will do a episode on it too.

NIFTY WEEKLY /Positional Level Analysis: 09th - 13th Feb 2026 NIFTY WEEKLY /Positional Level Analysis: 09th - 13th Feb 2026
🚀Follow & Compare Daily NIFTY Post o find Strength of LEVEL / Zone.
━━━━━━━━━₹₹₹₹₹₹₹₹₹₹₹₹━━━━━━━━
💥Level Interpretation / description:
L#1: If the candle crossed & stays above the “Buy Gen”, it is treated / considered as Bullish bias.
L#2: Possibility / Probability of REVERSAL near RLB#1 & UBTgt
L#3: If the candle stays above “Sell Gen” but below “Buy Gen”, it is treated / considered as Sidewise. Aggressive Traders can take Long position near “Sell Gen” either retesting or crossed from Below & vice-versa i.e. can take Short position near “Buy Gen” either retesting or crossed downward from Above.
L#4: If the candle crossed & stays below the “Sell Gen”, it is treated / considered a Bearish bias.
L#5: Possibility / Probability of REVERSAL near RLS#1 & USTgt
HZB (Buy side) & HZS (Sell side) => Hurdle Zone,
*** Specialty of “HZB#1, HZB#2 HZS#1 & HZS#2” is Sidewise (behaviour in Nature)
Rest Plotted and Mentioned on Chart
Color code Used:
Green =. Positive bias.
Red =. Negative bias.
RED in Between Green means Trend Finder / Momentum Change
/ CYCLE Change and Vice Versa.
Notice One thing: HOW LEVELS are Working.
Use any Momentum Indicator / Oscillator or as you "USED to" to Take entry.
━━━━━━━━━━━━━━━━━━━━━━━━━━━━━━━━━━━━━━━━━━━
⚠️ DISCLAIMER:
The information, views, and ideas shared here are purely for educational and informational purposes only. They are not intended as investment advice or a recommendation to buy, sell, or hold any financial instruments. I am not a SEBI-registered financial adviser.
Trading and investing in the stock market involves risk, and you should do your own research and analysis. You are solely responsible for any decisions made based on this research.
"As HARD EARNED MONEY IS YOUR's, So DECISION SHOULD HAVE TO BE YOUR's".
━━━━━━━━━━━━━━━━━━━━━━━━━━━━━━━━━
❇️ Follow notification about periodical View
💥 Do Comment for Stock WEEKLY Level Analysis.🚀
📊 Do you agree with this view?
✈️ HIT THE PLANE ICON if this technical observation resonates with you. It will Motivate me.
━━━━━━━━━━━━━━━━━━━━━━━━━━━━━━━━━
💡 If You LOOKING any CHART & want for Level and ANALYZE?
Share your desired stock names in the comments below! I will try to analyze the chart Levels, patterns and share my technical view (so far my Knowledge).
If Viewers think It can identify meaningful setups. Looking forward to hearing from all of you — let's keep this discussion going and help each other make better trading decisions.

BPCL Long Trade Setup: 3:1 Risk/Reward Reversal Play
Analysis
BPCL has shown a potential reversal after a significant downtrend, with a clear break of structure and liquidation of sell-side liquidity. The chart marks a key Fair Value Gap (FVG) entry zone, aligning with a bullish momentum confirmation and a strong recovery from recent lows.
Trade Parameters:
• Entry: After confirmation from FVG/volume imbalance area
• Stop Loss: ₹306 (below recent swing low for risk protection)
• Take Profit: ₹360 (targeting next key resistance zone)
• Risk/Reward Ratio: 3:1
Disclaimer
This idea is for educational purposes only and does not constitute financial advice. Trading involves risk—always do your own research and consult with a professional advisor before making trading decisions. Past performance is not indicative of future results.

BSE Ltd | Bullish Consolidation Near ₹3,000 | Liquidity & Trend
NSE:BSE Ltd (Daiy)
Bullish Continuation | Liquidity-Supported Breakout Setup
BSE Ltd continues to trade in a strong primary uptrend, maintaining a clear higher-high, higher-low structure on the daily timeframe. Price
Trigger: Daily close above ₹3,030 with volume
Price Compressing Near Range High
21 & 50 EMA Acting as Dynamic Support
Trend Intact Until 50 EMA Holds

UNITDSPR: Long candidate SL 1351: TG 2046UNITDSPR, Weekly: 1) The bottom has been tested more than 3 times. This indicates good consolidation in a demand zone 1334.85 to 1237.00... 2) Breakout above IMR 1427.55 (IMR= Important Monthly Resistance), with volume + Subsequent Retest and Then after the confirmation of the up move can be the safe entry for Bulls... 3) Expected price movements are marked with blue arrows.... 4) Long candidate Entry: 1377; SL 1351: TG 2046.

Nifty IT indexThe Nifty IT index is currently facing a period of significant volatility and downward pressure, primarily driven by global tech concerns and specific news regarding rapid advancements in AI.
As of February 7, 2026, here is a professional perspective based on current market data:
Current Market Sentiment
Recent Sell-off: The index experienced its worst weekly performance in four months, falling 6.4% over the past week. A sharp single-day plunge of nearly 6% occurred on February 4, 2026, marking one of its steepest drops in recent years.
The "AI Shadow": Investor confidence has been shaken by the rapid evolution of generative AI tools (such as recent updates from Anthropic), which are perceived as potential disruptors to traditional IT service models.
Valuation & Growth: While the sector is considered fairly valued by some analysts, revenue growth for major Indian IT firms remains subdued in the "poor single digits" in dollar terms.
Major Component Performance
The heavyweights that drive the index have all seen significant one-year declines:
TCS: Down approximately 26.7% over the last year.
Infosys: Down approximately 20.6% over the last year.
Wipro: Down approximately 26.6% over the last year.
Outlook
Technically, the index has broken crucial swing lows and appears to be heading toward the next major support levels at 33,432 or even 30,918 (52-week low) if the current trend continues. While some describe the current sell-off as an overreaction, most analysts suggest avoiding aggressive "bottom fishing" until a clear reversal pattern forms on the charts.

As per Fibonacci the Nifty ENERGY is weak !Based on recent market technical analysis, the view on the Nifty Energy index is mixed, with some indicators suggesting a corrective phase or weakness, while others point to underlying strength.
Based on the Fibonacci retracement levels applied to the Nifty Energy Index chart, "weak" might be a bit of an oversimplification. It is more accurate to say the index is in a state of consolidation with a bearish bias, as it is currently struggling to reclaim key structural levels.
1. The "Line in the Sand" (0.5 Retracement)
The index is currently hovering right at the 0.5 Fibonacci level (36,249.30).
The Good: It has successfully used this level as a floor (support) multiple times throughout late 2025 and early 2026.
The Bad : It hasn't been able to launch a meaningful rally from here. In technical analysis, the longer a price stays at a support level without bouncing strongly, the "weaker" that support becomes.
2. Resistance at the Golden Ratio (0.618)
The true sign of weakness isn't where the price is now, but where it failed to go.
The 0.618 level (38,120.95) is the "Golden Ratio." In a healthy bullish trend, you want to see the price stay above this or reclaim it quickly.
The Nifty Energy Index fell below this level in early 2025 and has consistently failed to even touch it since mid-2025. This indicates a lack of buying conviction.
3. Volume Confirmation
Looking at the volume bars at the bottom:
There was a massive spike in volume during the initial drop toward the 0 level (29,285.65).
The recent consolidation near the 0.5 level is happening on relatively lower/flat volume, suggesting that big institutional players aren't aggressively buying this dip yet.
The Verdict
It isn't "weak" in the sense that it's crashing, but it is technically stagnant. As long as it stays below 38,120, the bears have the upper hand. If it loses the 36,249 level on a closing basis, we could see a slide back toward the 2025 lows.

Nifty Auto IndexCurrent Technical Observation
Leve lSignificance
27,786 Major Resistance: The index has failed to sustain above this 1.0 Fibonacci level.
25,719 Immediate Support: The 0.786 retracement level where buyers might step in.
24,205 Golden Ratio (0.618): This is the "make or break" zone for the long-term uptrend.
The Verdict
The index is currently in a sideways consolidation phase after a massive bull run. While it has "flat" characteristics (moving horizontally), the failure at the 1.11 extension suggests a loss of momentum.
If the index breaks and closes below the 0.786 level (25,719), the "Flat" theory becomes more likely as a deep Wave C would be underway. If it holds, it's simply a high-level consolidation.
It doesn't perfectly fit the textbook definition of an Elliott Wave Flat Correction.
A Flat Correction is a 3-wave structure (labeled A-B-C) that moves sideways. Here is a breakdown of why the chart is slightly different and what the technicals are actually signaling:
Why it’s not a "Standard" Flat
In a standard Flat, the waves usually follow a 3-3-5 structure:
Wave A: 3 waves down.
Wave B: 3 waves up (retracting nearly 100% of Wave A).
Wave C: 5 waves down (ending near the bottom of Wave A).
Looking at the chart:
Over-extension: Your "Wave B" (the recent peak) actually pushed above the previous swing high (reaching the 1.11 Fibonacci extension at 28,912).
Expanded Flat Potential: If this is a flat, it would be an Expanded Flat. In this scenario, Wave B goes beyond the start of Wave A, and Wave C usually drops significantly below the end of Wave A.
Double Top Characteristics: The price has struggled at the 27,786 (1.0 Fib) level twice recently (noted by the red circles), which looks more like a Double Top distribution pattern than a simple flat correction.

Bearish Continuation Setup After Dead-Cat Bounce (1H)
What the chart is saying:
Clear bearish trend: Price has been making lower highs and lower lows. The broader structure is decisively bearish.
Range breakdown: The blue box shows a consolidation range that broke to the downside, confirming continuation rather than accumulation.
Strong sell-off into demand: Price aggressively dropped into the red support zone (~62k–64k), where buyers stepped in hard, creating a sharp bounce.
Relief rally, not reversal: The current move up is a retracement, not a trend change. Momentum looks corrective, not impulsive.
Key resistance zone (~71k–72k):
This green area is previous support turned resistance
It aligns with the breakdown level → classic short opportunity
Planned trade idea (as drawn):
Entry: Into resistance (green zone)
Invalidation: Clean acceptance above resistance
Target: Prior support / liquidity pool around 63k
R:R: Favorable if rejection confirms
Bias:
📉 Bearish below resistance
Only a strong breakout + hold above 72k would weaken the short thesis
What to watch next:
Rejection wicks, bearish engulfing, or momentum divergence at resistance
Volume drying up on the push into the green zone
Failure to reclaim broken structure
⚠️ This setup assumes trend continuation, not a bottom. Until structure flips, rallies are sell-the-rip candidates.

BTCUSD Daily – Bearish Breakdown & Sell-the-Retests Setup
Here’s what the chart is saying, clean and to the point:
Market Structure
Clear distribution → breakdown sequence on the daily.
Price topped near the mid-90Ks, rolled over, and lost the 83–84K demand zone (former support marked in blue).
That loss flipped market structure firmly bearish.
Key Levels
Major breakdown level: ~83–84K (prior demand → resistance)
Supply / entry zone: ~72–74K (blue zone labeled “entry”)
Current support: ~67.4K (thin blue line)
Primary target: ~60–62K (grey demand zone)
Price Action Logic
The vertical sell-off into ~67K suggests impulsive bearish strength, not exhaustion.
The projected path shows a dead-cat bounce / consolidation into ~72–74K.
That zone aligns with:
Prior consolidation
Bearish retest logic
Likely supply from trapped longs
Trade Thesis (as illustrated)
Bias: Short
Entry idea: Sell a rejection in the 72–74K zone
Invalidation: Strong daily close back above ~75K
Target: 60–62K demand (first meaningful higher-timeframe support)
Big Picture
Unless BTC reclaims the 80K+ region quickly, this chart favors continuation lower, not a V-shaped recovery. The structure says rallies are for selling, not buying.

POWERGRID: Trend Reversal Indicators & Key LevelsThe stock of POWERGRID is showing signs of a potential trend reversal after an extended downtrend. Several technical factors across multiple timeframes support this shift in momentum.
The stock has recently managed to close above the 200-day EMA, a level widely monitored for assessing long‑term trend shifts. A golden crossover—where a shorter‑term moving average crosses above a longer‑term one—has also taken place.
This movement has been supported by strong trading volume, adding weight to the possibility of a positive structural change.
A triangle breakout has been observed on the chart, indicating that price has moved decisively out of a prolonged consolidation pattern.
Breakouts supported by volume are often interpreted as signals of improving momentum.
On the weekly timeframe, a bullish MACD crossover has been confirmed.
Weekly MACD signals tend to carry stronger implications for medium‑term momentum, suggesting sustained upward interest.
The RSI has approached the upper band, reflecting strong momentum.
However, this positioning also indicates the possibility of a short‑term pullback or cooling phase.
A potential supply zone around ₹318 may act as an area of temporary resistance.
Key Levels to Monitor:
Possible Supply / Resistance Zone: ₹318
Major Resistance Level: ₹354 (may be tested after consolidation or a short‑term pullback)
Support Zone: Around ₹250 (critical reference level for this setup)
Disclaimer: This analysis is intended solely for educational and informational purposes. It does not constitute financial advice or a recommendation to buy, sell, or hold any security. Investors should conduct their own research and consult a licensed financial advisor before making investment decisions.

INDIGO PAINTS | Daily TF | Swing Buy Setup INDIGOPNTS :- 1D | Buy
Entry: > 1006
SL: 975
T: 1080/1140/1200
For study and learning purposes only. Not financial advice

Bicoin Breaking all Supports - Something distrous happeningIf we see the Fisher, one by one all time frame has gone into sell mode.
At present 9Month 3Month 1Month 1Week Fisher are Negative. Gradual brutal fall is now what BTC is destined.
If this is the case, something dangerous brewing up in the Assets Class across the Board with virtually no safe heaven in view for shelter.
There may be occasions of rise. It can not go on falling daily and on occasions, it may strongly try to bounce except that it will eventually turn out as dead cat bounce.An example may be resent bounce from 61000 to 71000 within 2 days. But since all Fisher have now turned negative, every rise will be an opportunity for sell in the longer term perspective.
Things may change only when in the long term, these Fisher turn positive 1 by 1, but then also, it will be a prolonged process spanning years to gain the lost place.
If you see predictions of further fall, don't ignore them, rather ask your questions based on Fisher crossovers, which is extremely bearish at this time.
On the same principles, in my 3rd December 2025 analyzed that Gold Silver will blast to the Upside and they behaved in same manner as predicted. Again, I wrote about immediate exit from Silver for few weeks. Here, my reason was correct but it took 2 weeks to oblige reason being two important geopolitical issues namely Venezuela and Greenland that kept Silver buoyant for 2 weeks and these events were happening after my publish. But from 2nd week itself cracks appeared and were brutal. So Beware. These technical analysis on Longer term time frame not only rule the market but are also a challenge to AI based trades.

#LICHSGFIN at 506. Nicely poised for a good move. #LICHSGFIN at 506. Decent financials. FIIs/DIIs have a decent stake which is by and large stable. Quarterly results on 31st. Technically the stock has finished sub wave 4 and is now trying to wind up sub wave-2 of primary -5 and start sub -3 of primary -5 for tgt 891. WTF chart is almost identical. DTF chart clearly shows that the stock has completed sub -1 of primary-5 and has retraced more than 81% of sub-1 for sub-2 and is forming a neat a-b-c correction for this sub-2. 100% retracement comes to 495 with sub-3 tgt 781. 1 hr chart gives a near time picture where we can see sub-c of this sub-2 trying to make a 5-wave Diagonal to finish sub-2. Likely culmination of sub-2 is 490-500. Should reverse from 495-500 for sub-3 of Primary-5. STRICT STOP LOSS 485( though I think technically it should hold 494) Keep in WL. Risk reward is pretty decent.

XAUUSD – Brian | M15 Liquidity ReactionXAUUSD – Brian | M15 Liquidity Reaction & Short-Term Structure
Gold is currently trading within a short-term recovery leg after sweeping downside liquidity earlier in the week. The rebound from the lows shows clear liquidity absorption, but price is now approaching a critical sell-side reaction zone, where sellers previously defended aggressively.
On the M15 structure, price has formed a sequence of higher lows, indicating short-term strength. However, this move is still unfolding inside a broader corrective phase, not a confirmed trend reversal. The upper zone around 5034 – 5067 remains a key SELL liquidity area, aligned with prior distribution and intraday resistance.
From a fundamental perspective, recent news around the US commitment to partial UN payments helped stabilize risk sentiment but did not create strong directional conviction. This supports the view of range-based trading rather than impulsive continuation.
Key zones to watch:
Sell zone: 5034 – 5067 (liquidity & resistance)
Intraday reaction zone: current consolidation area
Demand support: previous liquidity sweep lows below
➡️ Scenario:
Price may attempt a final push into upper liquidity before facing rejection. Failure to hold above intraday support would open the door for a pullback back into demand.
In this phase, reaction at liquidity zones matters more than prediction. Patience and structure confirmation remain key.
Follow the TradingView channel to stay updated on real-time market structure and liquidity behavior.

XAUUSD (H2) – Liam's AnalysisXAUUSD (H2) – Liam View
Rally into supply | Volatility risk rising
Gold is rebounding from the 4550–4600 demand base, but the broader H2 structure still points to a selling environment. The current move higher looks corrective, driven by short covering and liquidity rotation rather than a confirmed trend reversal.
From the chart, price is rotating back toward 4900–5030, a zone where previous distribution and liquidity rest. Unless price can accept above this area, rallies should be treated as selling opportunities, not breakout confirmation.
Key technical zones
Major selling zone: 5536 – 5580 (HTF supply)
Near-term reaction zone: 5000 – 5030
Key demand / base: 4550 – 4600
Intraday support: ~4730
Market context
Recent US political headlines and institutional reviews add another layer of headline-driven volatility, increasing the risk of sharp swings and liquidity sweeps. In such conditions, gold often reacts erratically intraday, but higher-timeframe structure tends to reassert itself once the noise fades.
Outlook
As long as price stays below 5030, the bias remains sell-side dominant.
Failure to hold above 4730 would reopen downside risk toward the demand base.
Only a clean H2 acceptance above 5030 → 5100 would neutralize the bearish structure.
Execution note
Avoid chasing momentum in news-driven sessions.
Let price come to levels. Trade the reaction, not the headlines.
— Liam

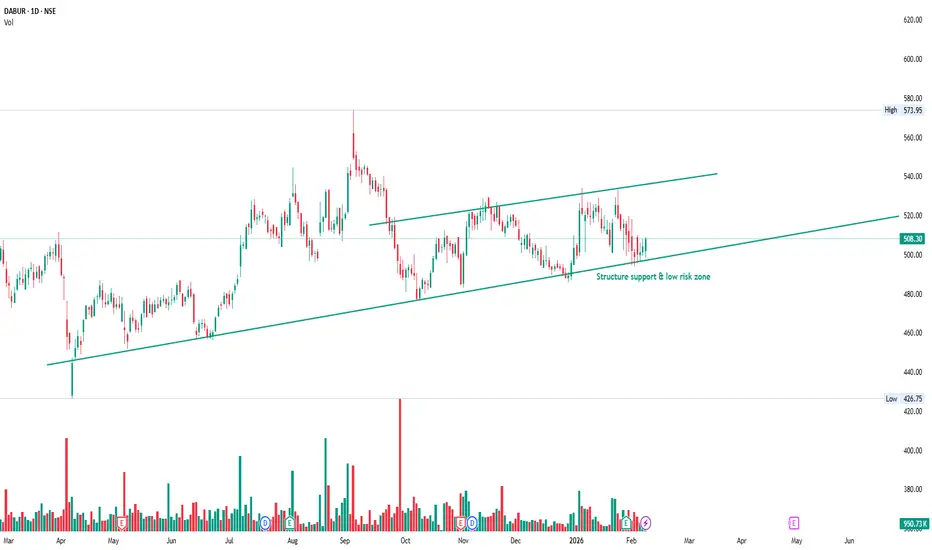
DABUR – Rising Channel Support | Low Risk, High Clarity SetupPrice is trading inside a well-defined rising channel and has now pulled back to the lower boundary of the structure.
This area has repeatedly acted as dynamic support, making risk clearly visible and controllable.
No prediction here — only structure and location.
As long as price holds above channel support, the broader trend remains intact.
A breakdown below this level would invalidate the setup and keep me out.
This is what a low-risk setup looks like:
clear trend, clear support, clear invalidation.
Good trades start with good location, not excitement.
Short setup on Oberoi Realty- Setup: Price has entered a strong supply zone that aligns with the weekly EMA 21, 50 and a broader weekly supply zone, creating confluence for potential rejection.
- Entry: Short positions initiated near the supply zone.
- Stop Loss: Placed just above the supply zone to protect against invalidation.
- Target: First target at ₹1,516.20, with scope to trail further if momentum continues.
- Volume Profile: A notable volume node adds weight to the rejection thesis.
- Structure: Prior pivot levels have already been broken, signaling weakness and validating bearish bias.
📌 Bias: Bearish continuation expected as long as price respects the supply zone
