GBPUSD: Post-BOS Retest | Long Opportunity at Demand ZoneGBPUSD has shown a clear bullish character shift on the 1H timeframe. After a series of Break of Structure (BOS) moves to the upside, the price has created a fresh Demand Zone (Order Block) around the 1.37400-450 level.
Community ideas

SbinThe daily time frame chart shows that the price is bouncing from the trend line support. In the lower time frame, the price has formed a rounding bottom.
Buy above 1048 with the stop loss of 1040 for the targets 1054, 1060, 1068 and 1076.
A rounding bottom pattern can form a candle if it has a pullback. At the same time, in the daily chart, the price should hold the trend line support.
Always do your analysis before taking any trade.

LUPIN 1 Day View 📊 Current Market Snapshot (Latest Available Close)
Price: ~₹2,137.20 (NSE) — price range on the most recent session was ₹2,130.30–₹2,178.00.
Previous Close: ₹2,163.20.
52‑week range: ₹1,795.20 low ~ ₹2,226.30 high.
📈 Daily Pivot & Key Levels (Short‑Term Technical)
🔁 Pivot (Reference Level)
Pivot point: ~₹2,166–₹2,160 zone — this is the central level that often defines bull/bear bias intraday.
🔼 Resistance (Upside Levels)
R1: ~₹2,185–₹2,189 — immediate upside barrier.
R2: ~₹2,206–₹2,208 — next medium resistance.
R3: ~₹2,227–₹2,238 — stronger resistance zone (intraday to short‑term).
🔽 Support (Downside Levels)
S1: ~₹2,143–₹2,119 — initial support from recent pivot structures.
S2: ~₹2,124–₹2,100 — mid downside support.
S3: ~₹2,102–₹2,071 — deeper support if bearish momentum accelerates.
🧠 How to Use These Levels Today
Bullish view: Stay above pivot (~₹2,160–₹2,166) for upside bias toward R1→R2.
Neutral/Range: Between S1 and R1 suggests consolidation — trade bounces within this zone.
Bearish breakdown: A close below S2/S3 can indicate deeper correction — watch S2 as key risk cutoff.
(These are not buy/sell recommendations, just short‑term technical reference points.)

XAUUSD (H1) – Liam Plan (Jan 27) Bullish TrendQuick summary
Gold is still trending higher inside a clean rising channel, but price is now approaching a weak high / liquidity pocket where stop-runs are likely.
Macro backdrop adds fuel for volatility: reports suggest the US is pressuring Ukraine toward territorial concessions as part of peace talks — this kind of uncertainty often keeps safe-haven demand supported, but it can also create fast spikes + fake breaks.
➡️ Today’s rule: follow the uptrend, but only buy at liquidity test points. No chasing highs.
1) Macro context (why spikes are likely)
If markets start pricing a forced compromise in the Ukraine conflict:
risk sentiment can swing quickly,
headlines can trigger instant pumps, then sharp retraces.
✅ Safe approach: let price hit your zones first, then trade the reaction — not the headline.
2) Technical view (H1 – based on your chart)
Price is respecting an ascending channel and building liquidity around key levels.
Key levels (from the chart):
✅ Support / buy liquidity zone: 4,995 – 5,000
✅ Flip / reaction zone: 5,047
✅ Upper resistance / supply: 5,142
✅ Weak High / liquidity target: 5,192.6
✅ Extension target (1.618): 5,240.8
Bias stays bullish while inside the channel, but near 5,192–5,240 we should expect liquidity sweep → pullback behavior.
3) Trading scenarios (Liam style: trade the level)
A) BUY scenarios (priority – trend continuation)
A1. BUY the pullback into the flip zone (cleanest R:R)
✅ Buy: 5,045 – 5,050 (around 5,047)
Condition: hold + bullish reaction (HL / rejection / MSS on M15)
SL (guide): below 5,030 (or below the reaction low)
TP1: 5,085 – 5,100
TP2: 5,142
TP3: 5,192.6
Logic: This is the best “trend-following” entry — buy support, sell into liquidity above.
A2. BUY deep liquidity sweep (only if volatility hits)
✅ Buy: 4,995 – 5,000
Condition: sweep + strong reclaim (fast rejection / displacement up)
SL: below 4,980
TP: 5,047 → 5,142
Logic: This is the strongest liquidity test zone on your chart — ideal for a bounce if price flushes.
B) SELL scenarios (secondary – reaction scalps only)
B1. SELL the weak high sweep (tactical scalp)
✅ If price runs 5,192.6 and shows rejection:
Sell: 5,190 – 5,200
SL: above the sweep high
TP: 5,142 → 5,085
Logic: Weak highs often get swept first. Great for quick mean reversion back into the channel.
B2. SELL extension (highest-risk, but best location)
✅ Sell zone: 5,235 – 5,245 (around 5,240.8)
Only with clear weakness on M15–H1
TP: 5,192 → 5,142
Logic: 1.618 extension is a common exhaustion pocket — don’t short early, short the reaction.
4) Key notes
Don’t trade mid-range between 5,085–5,142 unless you’re scalping with tight rules.
Expect false breakouts near 5,192 and 5,240 during headlines.
Best execution today = buy support, take profits into liquidity.
Question:
Are you buying the 5,047 pullback, or waiting for the 5,192 sweep to sell the reaction?
— Liam

XAUUSD (Gold) 45-Minute Chart – Strong Bullish Continuation AbovTrend:
Gold is in a clear bullish trend. Price has made higher highs and higher lows, accelerating strongly on Jan 28 with a breakout and momentum expansion.
Market Structure:
Earlier consolidation zones (value areas) were broken to the upside, followed by acceptance above prior ranges.
The most recent move shows impulsive buying, suggesting institutional participation rather than a weak breakout.
Volume Profile (VCP):
Previous High Volume Nodes (HVN) around 5,080–5,120 acted as resistance, now flipped into support.
Current price is trading above the Point of Control (POC), which confirms bullish control.
Low volume above indicates price discovery, meaning less resistance overhead.
Key Levels:
Resistance: 5,270–5,300 (current highs / psychological zone)
Immediate Support: 5,120–5,100 (previous value area high)
Deeper Support: 5,020–4,980 (range low & demand zone)
Bias:
Bullish while above 5,100
Pullbacks into previous value areas are likely to attract buyers.
Trading Insight:
Best opportunities are buy-the-dip setups rather than chasing highs.
A rejection with high volume below 5,100 would be the first warning sign of a deeper correction.

GOLD (XAUUSD) Retracement Buy Zones-Long Bias Only**Description:**
Gold is currently in a bullish structure and I am waiting for a **healthy retracement into my marked demand zones**.
My plan is simple: **ONLY look for BUY opportunities** from these zones and ignore sells.
Price previously respected this area as support and also aligns with structure + retracement levels.
If price taps into the zone and shows bullish confirmation (rejection candle / structure shift), I will look for long entries.
**Trade Plan:**
✅ Direction: BUY only
📍 Entry: Inside marked retracement zone
🎯 Target 1: Previous high
🎯 Target 2: Next resistance / liquidity
🛑 Stop Loss: Below the zone (structure invalidation)
**Reason for Bias:**
• Overall trend = bullish
• Zone = previous demand area
• Waiting for retracement, not chasing price
• Risk-reward favorable from this area
⚠️ No trade if price breaks and closes below the zone.
I will wait patiently for price to come to me.
**Disclaimer:**
This is my personal analysis, not financial advice.
Always manage your risk and wait for confirmation before entering.
#XAUUSD #Gold #PriceAction #SupplyAndDemand #Forex #TradingView #BuyZone #SmartMoney #TrendTrading

HINDZINC 1 Month View 📊 Current Price Context (as of late Jan 28, 2026)
Stock is trading near its recent highs around ₹720–₹730 on NSE.
📈 1-Month Key Levels (Support & Resistance)
🔁 Major Resistance Levels
1. ~₹730–₹735 — Immediate resistance around recent highs/upper range of the month (where price struggled on breakout)
2. ~₹750 — Psychological resistance zone above current levels (weekly/medium term trend)
3. ~₹770–₹780+ — Extended upside if breakout sustains (higher supply zone)
(Break above ~₹735 with strong volume can open room toward these higher targets.)
🔽 Immediate Support Levels
1. ~₹695–₹700 — First support pivot zone (near recent consolidation low)
2. ~₹675–₹680 — Next technical support from pivot and short-term averages
3. ~₹650–₹660 — Stronger 1-month base support if the stock pulls back further
4. ~₹620–₹630 — Major support zone if broader weakness emerges (coincides with longer moving averages)
📊 Moving Average Context
The 20/50/100/200-day SMAs/EMAs are generally positioned below the current price, showing positive slope — often interpreted as bullish momentum on the medium-term charts.
📌 Interpretation / Range Estimate (1-Month)
Based on recent trading dynamics and pivot analysis, a reasonable 1-month trading range could be approximately:
Bullish Scenario: ₹735 → ₹770+
Bearish / Pullback Range: ₹700 → ₹650
This gives a sense of where the stock may find near-term resistance and support around the current price action.

GOLD Buy Pullbacks in Bullish TrendMarket Context (M30)
Gold continues to trade within a strong bullish continuation phase, holding firmly inside a well-defined ascending channel. Recent pullbacks are technical retracements for liquidity rebalancing, not signs of distribution or trend exhaustion.
On the macro side, persistent USD weakness, sustained safe-haven demand, and only modest Fed easing expectations keep the broader backdrop supportive for gold. This combination allows upside momentum to remain controlled and constructive rather than emotional.
➡️ Overall bias: Bullish – prioritize BUY setups aligned with the main trend.
Structure & Price Action
M30 structure remains intact with clear Higher Highs and Higher Lows.
Price continues to respect previous demand and key levels, confirming active buyer participation.
No bearish CHoCH has been confirmed.
The current leg is expanding toward higher Fibonacci extensions, reinforcing trend continuation.
Key insight:
👉 As long as structure holds, pullbacks represent opportunity — not risk.
Trading Plan – MMF Style
Primary Scenario – Trend-Following BUY
Focus on patience and execution at discounted levels, not chasing price at extensions.
BUY Zone 1: 5,185 – 5,170
(Short-term demand + channel support)
BUY Zone 2: 5,106 – 5,085
(Key level confluence + trendline support)
➡️ Execute BUYs only after clear bullish reaction and structure confirmation.
➡️ Avoid FOMO at extended highs.
Upside Targets:
TP1: 5,250
TP2: 5,309 (Next ATH extension zone)
Alternative Scenario
If price holds firmly above 5,250 without a meaningful pullback, wait for a break & retest before looking for continuation BUYs.
Invalidation
A confirmed M30 close below 5,044 would weaken the current bullish structure and require reassessment.
Summary
Gold remains in a controlled bullish expansion, driven by structure and macro flow. The edge is not calling the top, but buying pullbacks within demand while the trend remains intact. As long as structure holds, higher prices remain the path of least resistance.

AXISBANK 1 Month View📈 Current Context
As of late January 2026, Axis Bank’s stock is trading around ₹1,300 – ₹1,340 range amid strong recent earnings and price momentum.
📊 1-Month Key Levels (Daily/Short-Term Range)
🔼 Resistance (Upside)
1. ₹1,340 – ₹1,350 – Near recent high/resistance zone (short-term cap)
2. ₹1,355 – ₹1,365 – Next resistance cluster above recent highs
3. ₹1,370 + – Broader higher breakout zone if strong bullish continuation occurs
Note: Weekly/short weekly resistance zones are around ₹1,317-₹1,320 and then ₹1,340-₹1,350.
🔽 Support (Downside)
1. ₹1,280 – ₹1,285 – Immediate support near recent pivot lows
2. ₹1,270 – ₹1,275 – Secondary support zone tracked by moving averages
3. ₹1,260 – ₹1,265 – Broader channel support if price weakens further
🧭 Interpretation for a 1-Month View
Bullish scenario: A sustained break and close above ₹1,350 could extend momentum toward ₹1,365+ in the coming weeks.
Bearish scenario: A break below ₹1,270 might open the path toward ₹1,250 – ₹1,260 support cluster.
Neutral/Range: In sideways conditions, expect most trading between roughly ₹1,270 – ₹1,350.

BANDHANBNK 1 Month View 📊 Current Context (Latest Market Data)
Recent price range: ~₹145–₹152 intraday.
52-week range: ~₹128–₹192.
📈 1-Month Key Resistance Levels
These are levels where price may face selling pressure on upward moves:
Primary Resistances
1. ~₹152–₹153 — near recent highs and short-term swing resistance.
2. ~₹155–₹156 — higher pivot resistance zone seen in short-term technical data.
3. ~₹159–₹160 — aligned with 100/200-day moving averages acting as dynamic resistance.
👉 A break above ₹155–₹156 with volume could open way to ₹160+ short-term.
📉 1-Month Key Support Levels
These are levels where price may find buys/defense if it corrects:
Primary Supports
1. ~₹145–₹146 — recent short-term support and pivot zone.
2. ~₹142–₹143 — recent reaction lows intraday.
3. ~₹138–₹140 — deeper support and previous swing area.
👉 A decisive break below ₹142 may signal further weakness toward ₹138–₹136 on extended weakness.
🧠 Technical Indicators (Short-Term Bias)
RSI around mid-range (~57) — slightly bullish/neutral momentum.
Short-term moving averages mixed but range bound (20D near current price) — suggests range trading in the month.
So short-term technically, price is not in a strong trending breakout but more in a range with potentials to oscillate between support & resistance.

HINDALCO 1 Month View 📌 Current Price Snapshot
Approximate recent price: ₹961–₹975 on NSE.
52-week range: ₹546.45 (low) to ~₹985 (high).
📊 1-Month Technical Levels (Support & Resistance)
🔁 Pivot & Balanced Level
Pivot Level: ~₹954 – ₹963 (central zone where trend bias often flips)
📈 Resistance Levels (Upside Barriers)
1. R1: ~₹959 – ₹960 — first key resistance above current pivot.
2. R2: ~₹969 – ₹970 — near recent short-term highs.
3. R3: ~₹975 – ₹980+ — upper resistance and psychological round number area.
💡 Above ~₹980: breakout build-up zone toward recent swing highs (~₹985).
📉 Support Levels (Downside Floors)
1. S1: ~₹944 – ₹945 — first major support zone.
2. S2: ~₹938 – ₹940 — next lower support within recent range.
3. S3: ~₹929 – ₹932 — deeper support if price slides further.
4. Lower structural zone: ~₹907 – ₹921 — broader support band from longer-term pivots.
📅 Trend & Market Context (1-Month)
Momentum: RSI around mid-60s suggesting moderately bullish momentum without being overbought.
Moving averages: Price trading above major short & mid-term averages (20/50 DMA), indicating bullish bias on the monthly view.
Volatility: ATR indicates normal volatility — not extreme swings.
Interpretation:
✔ Stays bullish above ~₹944–₹945 support.
✔ Upside can extend to ~₹969–₹980 if momentum persists.
⚠ A break below ~₹932 could signal deeper pullbacks toward ~₹907 area.

AWHCL - Clear Breakout with Volume SurgeAWHCL was forming falling wedge for the last 1 year and it now broke the resistance. Volume is huge which supports the breakout. Now the stock is retesting the resistance line before making a move up.
SL would be below 553.
This is not an investment advice

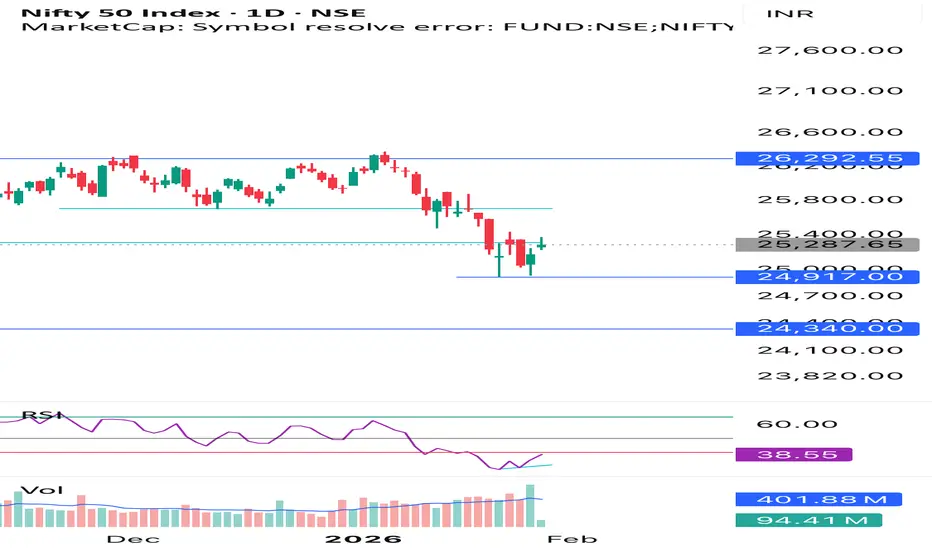
NIFTY KEY LEVELS FOR 28.01.2026NIFTY KEY LEVELS FOR 28.01.2026
Timeframe: 3 Minutes
If the candle stays above the pivot point, it is considered a bullish bias; if it remains below, it indicates a bearish bias. Price may reverse near Resistance 1 or Support 1. If it moves further, the next potential reversal zone is near Resistance 2 or Support 2. If these levels are also broken, we can expect the trend.
When a support or resistance level is broken, it often reverses its role; a broken resistance becomes the new support, and a broken support becomes the new resistance.
If the range(R2-S2) is narrow, the market may become volatile or trend strongly. If the range is wide, the market is more likely to remain sideways
please like and share my idea if you find it helpful
📢 Disclaimer
I am not a SEBI-registered financial adviser.
The information, views, and ideas shared here are purely for educational and informational purposes only. They are not intended as investment advice or a recommendation to buy, sell, or hold any financial instruments.
Please consult with your SEBI-registered financial advisor before making any trading or investment decisions.
Trading and investing in the stock market involves risk, and you should do your own research and analysis. You are solely responsible for any decisions made based on this research.

SILVER CAN FLY PAST 118 Silver is bullish across all timeframes and could soar past a daily close above 118.

GIFTNIFTY IntraSwing Levels for 28th JAN 2026GIFTNIFTY IntraSwing Levels for 28th JAN 2026
🚀Follow & Compare NIFTY spot Post for Taking Trade
________________________________________________________
💥Level Interpretation / description:
L#1: If the candle crossed & stays above the “Buy Gen”, it is treated / considered as Bullish bias.
L#2: Possibility / Probability of REVERSAL near RLB#1 & UBTgt
L#3: If the candle stays above “Sell Gen” but below “Buy Gen”, it is treated / considered as Sidewise. Aggressive Traders can take Long position near “Sell Gen” either retesting or crossed from Below & vice-versa i.e. can take Short position near “Buy Gen” either retesting or crossed downward from Above.
L#4: If the candle crossed & stays below the “Sell Gen”, it is treated / considered a Bearish bias.
L#5: Possibility / Probability of REVERSAL near RLS#1 & USTgt
HZB (Buy side) & HZS (Sell side) => Hurdle Zone,
*** Specialty of “HZB#1, HZB#2 HZS#1 & HZS#2” is Sidewise (behaviour in Nature)
Rest Plotted and Mentioned on Chart
Color code Used:
Green =. Positive bias.
Red =. Negative bias.
RED in Between Green means Trend Finder / Momentum Change
/ CYCLE Change and Vice Versa.
Notice One thing: HOW LEVELS are Working.
Use any Momentum Indicator / Oscillator or as you "USED to" to Take entry.
⚠️ DISCLAIMER:
The information, views, and ideas shared here are purely for educational and informational purposes only. They are not intended as investment advice or a recommendation to buy, sell, or hold any financial instruments. I am not a SEBI-registered financial adviser.
Trading and investing in the stock market involves risk, and you should do your own research and analysis. You are solely responsible for any decisions made based on this research.
"As HARD EARNED MONEY IS YOUR's, So DECISION SHOULD HAVE TO BE YOUR's".
━━━━━━━━━━━━━━━━:===:━━━━━━━━━━━━━━━━━━
❇️ Follow notification about periodical View
💥 Do Comment for Stock WEEKLY Level Analysis.🚀
📊 Do you agree with this view?
✈️ HIT THE PLANE ICON if this technical observation resonates with you. It will Motivate me.
━━━━━━━━━━━━━━━━:===:━━━━━━━━━━━━━━━━━━
💡 If You LOOKING any CHART & want for Level and ANALYZE?
Share your desired stock names in the comments below! I will try to analyze the chart Levels, patterns and share my technical view (so far my Knowledge).
If Viewers think It can identify meaningful setups. Looking forward to hearing from all of you — let's keep this discussion going and help each other make better trading decisions.

Oil India | Daily | Structural BreakoutAfter months of consolidation, Oil India has broken above a key supply zone with strength.
This move signals a trend shift, provided price sustains above the breakout level.
🔍 Technical Highlights:
• Long base → strong expansion
• Horizontal resistance taken out
• Volume supports the breakout
📌 Status: Breakout done, retest awaited
👉 Strength on dips > chasing highs
⚠️ Educational view only. Not a buy/sell call.
#OilIndia #BreakoutStock #PriceAction #TechnicalAnalysis #IndianStocks #SwingTrading #TrendBreakout

SOLARIND 30% upside possible in next 6-8 Months.SOLARIND 30% upside possible in next 6-8 Months.
Fundamentals:
Company has reduced debt.
Company has delivered good profit growth of 35% CAGR over last 10 years.
Technicals:
Stock has been correcting from high of 17800 Since 7 Months.
Looks like the bottom should be formed near 11800-12500 region taking the stock back to last highs of 17800+
LTP - 13200
Target - 18000+
SL - 11500
Timeframe - 6-8 Months
Happy Investing.

Nifty Base FormationNifty is forming at Good Base with small RSI divergence. A close above 40 RSI and 10 EMA in nifty may result in a new short term upward trend
XAUUSD - H1 Gold structurally bullishXAUUSD – H1 Gold remains structurally bullish near all-time highs| Lana ✨
Gold is extending its bullish momentum for a second consecutive session and continues to trade near all-time highs. Price action remains constructive, with the market holding above key structure while deciding between continuation or a deeper pullback into value.
📈 Market Structure & Trend Context
The short-term and medium-term structure remains bullish, with price respecting the ascending channel.
The recent push above previous highs confirms strong demand, but current price action also shows signs of consolidation near ATH.
This behavior is typical after an impulsive rally, where the market pauses to build acceptance or rebalance liquidity before the next directional move.
As long as price holds above the rising structure, the bullish thesis remains valid.
🔍 Key Technical Zones to Watch
ATH Reaction Zone: 5080 – 5110
This is a sensitive area where price may consolidate, fake out, or briefly reject before choosing direction.
Primary Pullback / Buy Zone: 5000 – 5020
A key structural level aligned with prior resistance-turned-support and the midline of the bullish channel.
Secondary Support (Deeper Pullback): 4920 – 4950
A stronger value area if volatility increases or liquidity is swept below the channel.
Upside Expansion Zone: 5180 – 5200+
If price accepts above ATH, this becomes the next upside objective within the channel.
🎯 Trading Scenarios (H1 Structure-Based)
Scenario 1 – Continuation Above ATH:
If price consolidates above 5080–5110 and shows acceptance, gold may extend toward 5180–5200. This scenario favors patience and confirmation rather than chasing immediate breakouts.
Scenario 2 – Pullback Into Structure (Preferred):
A pullback toward 5000–5020 would allow the market to rebalance liquidity and offer a higher-quality continuation setup. Holding this zone keeps the bullish structure intact.
Scenario 3 – Deeper Correction:
If price loses the primary support, the 4920–4950 zone becomes the next key area to watch for buyer response and trend defense.
🌍 Macro Context (Brief)
Gold continues to benefit from heightened geopolitical risks and ongoing trade uncertainty, reinforcing its role as a safe-haven asset.
At the same time, market attention is shifting toward the outcome of the two-day FOMC policy meeting on Wednesday, which may introduce volatility and short-term repricing.
This backdrop supports gold structurally, while also increasing the likelihood of sharp intraday swings around key levels.
🧠 Lana’s View
Gold remains bullish, but near ATH levels, discipline matters more than conviction.
Lana prefers buying pullbacks into structure, letting price confirm, and avoiding emotional trades during headline-driven volatility.
✨ Respect the structure, stay patient near the highs, and let the market come to your levels.

XAUUSD – Bullish Continuation, ATH Expansion Still in PlayGold continues to trade within a strong bullish channel, maintaining its ATH expansion structure. The recent pullback is corrective in nature and shows clear signs of liquidity absorption rather than distribution.
On the macro side, sustained USD weakness, safe-haven flows, and a still-cautious Fed outlook keep gold supported at elevated levels.
➡️ This environment favors trend continuation, not top-picking.
Structure & Price Action
H1 structure remains bullish with Higher Highs and Higher Lows intact.
The recent drop has respected key demand zones and the ascending trendline.
No bearish CHoCH confirmed → downside moves remain corrective.
Price is rebalancing after an impulsive leg, preparing for the next expansion.
Key takeaway:
👉 Pullbacks are opportunities to position with the trend, not signs of reversal.
Trading Plan – MMF Style
Primary Scenario – BUY the Pullback
Focus on patience and structure confirmation.
BUY Zone 1: 5,045 – 5,020
(Rebalance area + intraday demand)
BUY Zone 2: 4,985 – 4,960
(Trendline confluence + deeper liquidity)
➡️ Only execute BUYs after bullish reaction (rejection wicks / structure hold).
➡️ Avoid chasing price at highs.
Upside Targets (ATH Extension):
TP1: 5,106
TP2: 5,198 (upper extension zone)
Alternative Scenario
If price holds firmly above 5,106 without a meaningful pullback, wait for a break & retest to join continuation BUYs.
Invalidation
A confirmed H1 close below 4,960 would weaken the bullish structure and require a reassessment.
Summary
Gold remains in a controlled ATH expansion phase. As long as structure and demand zones hold, the path of least resistance stays to the upside.
The MMF approach remains unchanged: buy pullbacks, follow structure, and let the trend do the work.

ATH Breakout Pullback: Smart Money Reloading at Demand Zone?Price has corrected from an all-time high and is now revisiting a high-quality demand zone that played a key role in breaking previous highs. This is not a random pullback — this is a structurally important retest. Let’s decode what the chart is really saying using pure Supply & Demand and Price Action.
📊 Higher Timeframe & Intermediate Trend Context
The weekly structure remains firmly bullish. Price has already achieved something critical: it broke and closed above the previous all-time high. This single fact changes the entire narrative.
When a market makes a fresh all-time high, it confirms:
• Strong institutional participation
• Absence of historical supply overhead
• A higher probability of continuation over deep reversal
The current move is best understood as a corrective pullback within a dominant higher-timeframe uptrend, not trend reversal.
📦 Demand Zone Logic: Why This Area Matters 🧠
The demand zone currently in play is not just any zone — it is the origin of the rally that led to the all-time high breakout. That gives this zone exceptional importance.
Key observations:
• This zone generated a powerful follow-through move
• It successfully absorbed supply and pushed price into price discovery
• Previous all-time high was broken after leaving this zone
Such zones often act as institutional reload zones, where large players look to re-enter positions during corrections.
🧩 Zone Structure & Strength
• The base is clean and well-defined
• The leg-out was explosive, signaling urgency from buyers
• Very limited basing candles, which increases imbalance
• First meaningful return after the breakout, enhancing freshness
This combination significantly improves the credibility of the zone.
🧠 Market Psychology Behind the Pullback
After an all-time high, weaker hands tend to book profits aggressively, mistaking correction for reversal. Meanwhile, stronger hands wait patiently for price to return to value.
📐 Trade Logic & Risk–Reward Perspective 🎯
The trade idea on the chart is structured around a 1:3 risk-to-reward ratio, which aligns well with:
• Higher timeframe Uptrend
• Strong demand location
• Favourable asymmetry between risk and potential reward
⚠️ Risk Awareness & Execution Discipline ⚖️
Even the best demand zones can fail. No setup is 100% reliable. Always define risk first, respect invalidation, and avoid emotional decision-making. Capital protection is more important than being right.
📌 Final Takeaway 🧭
higher-timeframe uptrend, all-time high breakout, and a controlled pullback into a good demand zone. Now, price action inside this area will decide the next move — reaction matters more than anticipation.
“Big trends are built on deep patience and precise execution.” 🔥📊
Thank you for your support, your likes & comments. Feel free to ask if you have questions.
This analysis is for educational purposes only and not intended as a trading or investment recommendation. I am not a SEBI registered analyst.

Gold Trading Strategy for 28th January 2026🟡 GOLD ($) TRADING PLAN
📊 TREND TRADING (Intraday)
📈 BUY SETUP
🟢 Condition:
➡️ Buy above the high of 30-min candle
➡️ Candle must close above $5244
🎯 Targets:
💰 $5255
💰 $5266
💰 $5277
🛑 Stop Loss:
🔻 Below the low of the breakout candle
📉 SELL SETUP
🔴 Condition:
➡️ Sell below the low of 1-hour candle
➡️ Candle must close below $5125
🎯 Targets:
💰 $5115
💰 $5105
💰 $5095
🛑 Stop Loss:
🔺 Above the high of the breakdown candle
⚡ SCALPING STRATEGY
🔻 SELL SCALPING (Resistance – $5244)
❌ Price tests $5244 zone
❌ 15-min candle rejection observed
📍 Entry:
➡️ Sell below the low of rejected 15-min candle
🛑 Stop Loss:
🔺 Above the high of rejected candle
⏱️ 5–10 points max or trail SL
📌 Trade Management:
🔄 Trail stop once price moves in favor
🔺 BUY SCALPING (Support – $5125)
✅ Price tests $5125 zone
✅ 15-min candle rejection observed
📍 Entry:
➡️ Buy above the high of rejected 15-min candle
🛑 Stop Loss:
🔻 Below the low of rejected candle
⏱️ 5–10 points max or trail SL
📌 Trade Management:
🔄 Trail stop once price moves in favor
⚠️ DISCLAIMER
🚨 This is not investment advice.
📉 Trading in commodities involves high risk.
💸 Past performance does not guarantee future results.
🧠 Trade only with proper risk management.
📌 Always consult your financial advisor before trading.
❗ Author is not responsible for any profit or loss.

indian market option trading indicatoroption Trading view both call and put in same chart
a indicator showing call and put on same chart for trading in options of indian market
visit to get indicator
