Manappuram Finance - Trade Setup📊 Trade Plan:
Entry: Above ₹215 if broken out with volume.
Stop Loss: ₹192.95 (Closing basis).
Target: Watch price action near ₹231 (ATH); safe traders wait for a daily close above it.
Position Sizing: Buy in small quantities and accumulate gradually.
📈 Why This Stock?
Technical Setup:
Trading above key DMAs (Daily Moving Averages).
Stock was in an uptrend (June-Aug 2022) but fell out of the channel and gapped down significantly (Oct 24, 2022).
Now recovering and trading near ATH (₹231), forming another channel.
Entry possible above ₹215 if broken with volume.
Watch for ₹231 breakout with volume (4-year trading range).
Finance index has broken out of base and is trading above key DMAs.
⚠️ Market Conditions & Risks:
We are trading against the trend (LL-LH structure).
The overall market is below the 50 & 200 DMA, indicating potential further dips.
Trades are more prone to failure unless the market structure changes.
Safe traders should wait for confirmation before entering.
📊 Fundamentals (Key Data)
Market Cap: ₹18,107 Cr
Current Price: ₹214
52-Week High/Low: ₹230 / ₹138
Stock P/E: 9.21
ROCE: 13.8%
ROE: 20.6%
🚨 Disclaimer:
⚠️ This is not financial advice. We are trading against the broader trend, meaning the risk of failure is high. Do your own analysis before taking any trade. Always manage risk and trade cautiously! 🚀
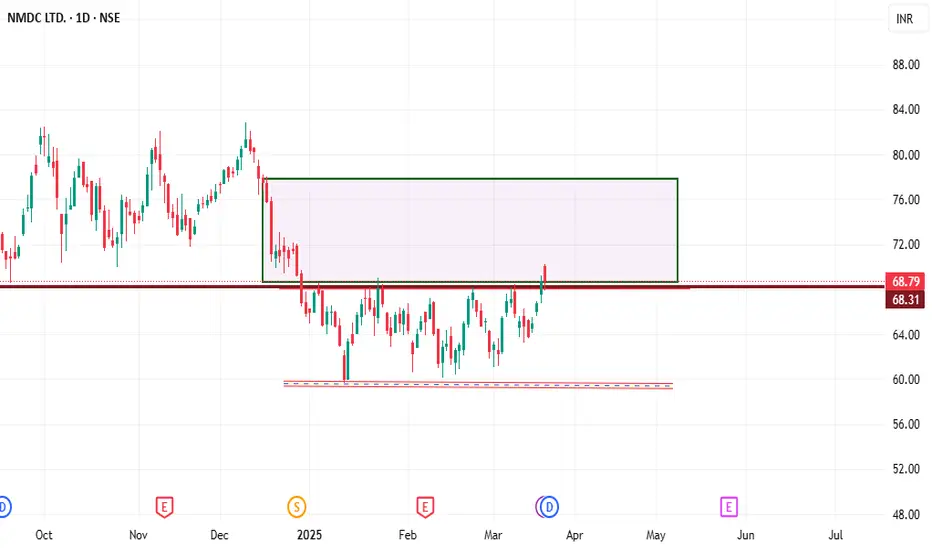
Parallel Channel

consoldation brakout parallel pattern nmdc break consolidation range and made a retest of consolidation highs as well. Stock currently trying to breakout from its previous swing highs, 68.79 approx 2 day same level consoldation is important after give a good breakout . If it breaks this level, next target as per pattern can be 77 and secod is 80 levels ofcaurse stoploss is low swing
Aether Awaits Breakout for Next MoveTopic Statement:
Aether, a relatively new stock listed in 2022, is trading in a sideways channel with defined accumulation and distribution zones, awaiting a breakout for its next move.
Key points:
- Stock is moving in a well-defined sideways channel.
- There are distinct accumulation and distribution zones.
- A breakout on either side of the channel will trigger a directional move.

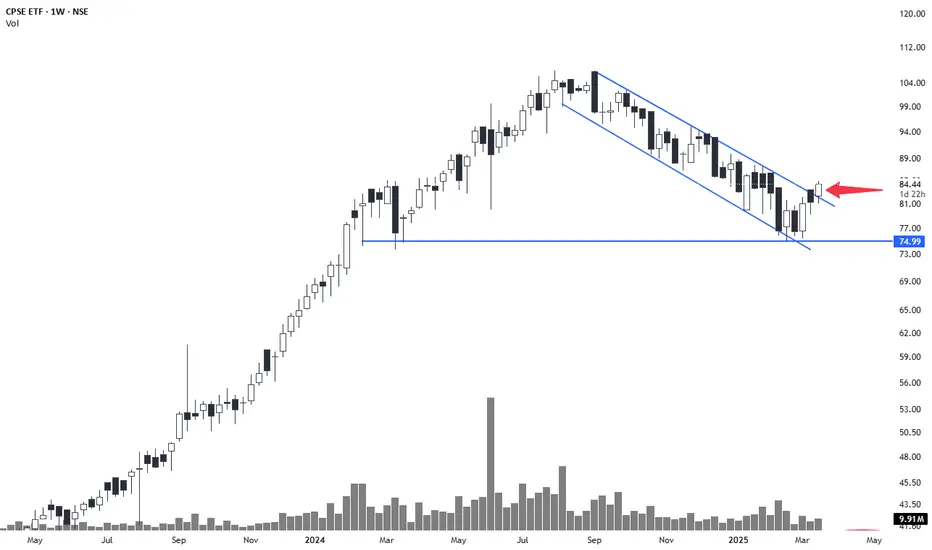
CPSE ETF Weekly BreakoutCPSE ETF breakout is happening from a long descending channel. Took support from previous long term lows 1 year back. Can it sustain the breakout and head towards the previous high is too be seen. It will be a long flag break out if it does.
Is "NIFTY" Going to Exhaust?Hey guys, after half of a decade before climbing to this level from 2020, NIFTY has showed some signs of falling from the high it was peeking in the past months. We see a parallel channel breaking at the point of market with market testing the channel back along with bearish signals on 1hr time frame and other companies falling price indicates that market had been overbought too much and it has to correct before going up again.
Targets we are getting are near 20,000 and 18000. People might find it impossible but it's not, cause if u use fibonacci retracement you will get these levels along with in the years 2015 and 2016 almost 25% fall has been seen an in the years 2011 and 2012 almost 30% fall can be seen and its obvious to all of us that the market are a little too high which can help us cling to the point that NIFTY can experience a bear market.
With this, signing off for today 🙏

Big move ahead for SRF?SRF broke its 3.5 years consolidation range and made a retest of consolidation highs as well. Stock currently trying to breakout from its previous swing highs, ~3000 levels. If it breaks this level, next target as per pattern can be ~3350 levels

Sarda Energy - Swing TradeNSE:SARDAEN today broke key levels with good levels, it again took support near the base where it is being accumulated and is trading in a Flat Channel which makes this a good swing to the upper edge of the Flat Channel if the Flat Channel is broken it can give a good Swing Up again so keep in watchlist and can buy again at lower level of the channel if retraced.
About:
Incorporated in 1973, NSE:SARDAEN is the flagship company of Sarda Group and is engaged in the production of steel, ferro alloys and power.
Trade Setup:
Good be a Good Typical Flat Channel Trade With RSI and MACD Trending Up with Good Volumes.
Target(Take Profit):
Short Swing towards 525 (ATH) and if Flat Channel is Broken Can Give Further Upswing.
Stop Loss:
Today's Candle Low i.e. 473 or Entry Candle Low if Trade Taken in Retracement.
📌Thank you for exploring my idea! I hope you found it valuable.
🙏FLLOW for more
👍BOOST if useful
✍️COMMENT Below your views.
Meanwhile, check out my other stock ideas on the right side until this trade is activated. I would love your feedback.
Disclaimer: "I am not SEBI REGISTERED RESEARCH ANALYST AND INVESTMENT ADVISER."
This analysis is intended solely for informational and educational purposes only and should not be interpreted as financial advice. It is advisable to consult a qualified financial advisor or conduct thorough research before making investment decisions.

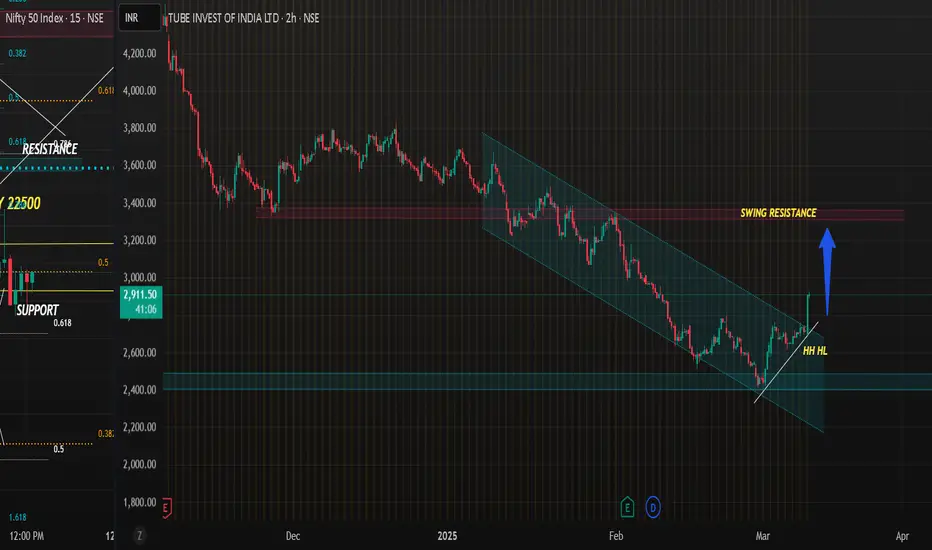
SWING OBSERVATION- TUBE INVESTMENTS
Script bounced from higher TF support 2400 level
with HH HL creation and channel Breakout , May attempt to test 3350 swing resistance
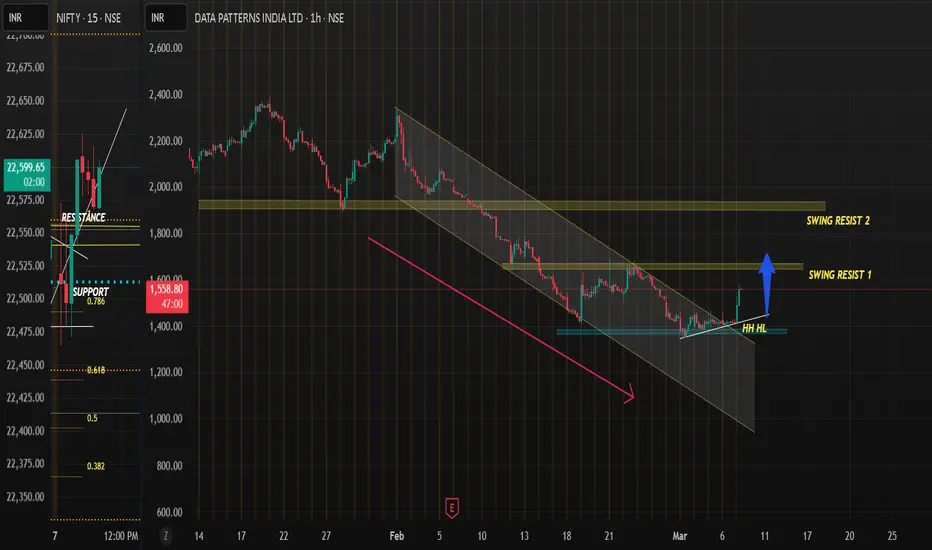
SWING OBSERVATION - DATA PATTERNS
Script showing good intraday momentum bounced from support area creating HH HL around 1420 , broke out of downward channel may test swing resistance 1 around 1670 levels & further 2nd swing Resist.
Nifty bank - Feb month expiry analysisPrice is moving inside a descending channel and now it is consolidating. 48600 zone is important to decide the trend direction further.
Buy above 48620 with the stop loss of 48540 for the targets 48700, 48820,48900, 48980, 49100 and 49220.
Sell below 48440 with the stop loss of 48520 for the targets 48360, 48240, 48160, 48060, 47960 and 47880.
Always do your own analysis before taking any trade.

Nifty - Expiry day analysis Feb 20Price was moving in a range for the past few days and in that process has created a channel pattern. Also I can see a triangle inside the channel.
Buy above 22920 with the stop loss of 22880 for the targets 22960, 23000, 23040, 23100 and 23160.
Sell below 22840 with the stop loss of 22880 for the targets 22800, 22760, 22700 and 22660.
As per daily chart price is at support.
Always do your own analysis before taking any trade.

BLS International - Swing Trade ideaBLS International looks taking support of channel. Trade has a good risk reward.
Please consult your financial advisor before entering position, I have shared material for reference purpose only. Never trade without SL.

Flag and Pole in Nifty. 22500 or 23500?After last week's Trending Pole, Nifty has been sideways this week trading in a range and creating a retracement flag.
Breakout on either side of the Range could lead to a trending move towards the Upper Limit of the Parallel Channel (Green) 23500 or The Midline of the Parallel Channel (Yellow) 22500.
RSI is divergent
Any dip towards 22500 could witness a decent buying.
Trade outside the Flag only.

Godfrey Phillips India: Strong Breakout & Impressive Q3 Results!Hello everyone!
I hope you all are doing great. Today, I bring you a high-potential trading idea in Godfrey Phillips India . The stock has broken out from a downward channel , which indicates a bullish reversal . If the price retraces to the breakout level, the 5,650-5,350 range could be a good entry point. Set a stop loss just below 4,949 , and target the levels of 6,690 , 7,600 , and 8,535 for potential gains. Make sure to follow the levels closely for confirmation.
Now, talking about the fundamentals , Godfrey Phillips has shown great results in its latest quarter. The company’s total income stood at Rs. 1,896.75 crore , which is a solid growth from Rs. 1,482.11 crore . Net profit has also increased to Rs. 332.33 crore , reflecting its strong performance. The EPS also jumped to Rs. 63.92 , showing the company’s ability to keep growing despite the market conditions.
To wrap up , this breakout from the downward channel, along with solid quarterly results, gives me confidence in this trade. The 5,650-5,350 range looks like a solid entry, with a stop loss below 4,949 to manage risk. Focus on the 6,690 , 7,600 , and 8,535 levels as your targets, and let’s watch this play out for solid returns!
Disclaimer: This analysis is for educational purposes only. Please trade responsibly and consult a financial advisor before making any decisions.
If you found this analysis helpful, don’t forget to like, follow, and share your thoughts in the comments below! Your support keeps me motivated to share more insights. Let’s grow and learn together—happy trading!

DLFPrice is moving in a steady down trend. And in that process, price has formed a descending triangle. 680 is the near by resistance and 660 is the near by support.
Buy above 685 with the stop loss of 680 for the targets 690, 695, 702 and 708.
Sell below 676 with the stop loss of 681 for the targets 671, 665, 659 and 652.
Always do your own analysis before taking any trade.

Bank Nifty - Weekly review Feb 17 to Feb 21Price gave nice fall from rising wedge pattern and in that process has formed a descending channel. Now price is testing the upper trend line of the channel. 49000 zone is the trend direction deciding zone.
Buy above 49040 with the stop loss of 48940 for the targets 49140, 49220, 49340, 49460, 49600, 49720, 49850, 49980. 50k is important zone and price may become volatile as buyers and sellers will try to show their strength at that zone. Sustaining above 50100 can give another 500 to 800 points move.
Sell below 48800 with the stop loss of 48900 for the targets 48700, 48580, 48500, 48360, 48200, 48040 and 47950.
Do your own analysis before taking any trade.

Muthoot Finance | VCP Pattern in Play Muthoot Finance | VCP Pattern in Play 🔍
Technical Overview
📈 Trend: Uptrend, trading within an ascending channel.
🔄 Pattern: Volatility Contraction Pattern (VCP) in progress, signaling potential explosive movement.
📉 Correction: The stock corrected ~15% during the recent market sell-off but rebounded strongly, re-entering the channel. It’s now only ~9% off its recent ATH, showcasing resilience.
Key Levels to Watch
✅ Entry Point: Breakout above ₹2279 with strong volume and a wide-range candle.
🎯 Targets:
T1: ₹2492 (R:R = 1:1)
T2: ₹3200+ (post-market stabilization, aiming for R:R = 1:2)
🛡️ Stop Loss: ₹2067.9 (below the most recent swing low to manage risk).
Strategy
1️⃣ Enter 30% position on a clean breakout above ₹2279. Wait for a retest and continuation to add the rest.
2️⃣ If the breakout is sharp and you miss the entry, wait for a retest and continuation before entering, do not enter in FOMO.
3️⃣ Once T1 is hit, book partial profits to lock in gains, given the weak market conditions.
4️⃣ Hold the remaining position as per your risk appetite and trail your SL to protect profits.
Why This Stock?
⭐ Resilience: Despite the correction, Muthoot Finance re-entered the channel, showing strength against market headwinds.
📊 Strong Indicators: RSI is rising, signaling bullish momentum, and the VCP pattern suggests tightening volatility before a potential breakout.
📉 Controlled Drawdown: From its ATH, the stock fell just ~9%, demonstrating relative strength compared to the broader market.
⭐Trading above Key DMAs
Key Risks to Consider
⚠️ Weak Market Conditions: Broader market trends remain bearish, trading below the 200 DMA, increasing the chance of a failed breakout.
⚠️ Volume Dependency: Strong breakout volume is essential to validate the pattern.
⚠️ Market Correlation: Any further market correction could pressure this trade setup and the probability of hitting the SL increases. So trade light.
Who Should Trade This?
1️⃣Aggressive Traders: Can follow the breakout strategy with proper position sizing.
2️⃣Conservative Traders: Wait for market stabilization and a close of NIFTY 50, Nifty 500 above the 200 DMA before entering any trade.
Actionable Insights
🔒 Lock Partial Profits at T1: Secure gains to mitigate risk in this volatile environment.
📈 Trail Your Stop Loss: Once T1 is achieved, manage the trade dynamically to maximize returns.
Disclaimer
This analysis is for educational purposes only and not financial advice. Please conduct your own research and analysis before making any investment decisions. Trading involves significant risk.
Trade wisely and stay disciplined! 🚀📊

Tata Consumer: Healthy Correction Within an Uptrend Topic Statement:
Tata Consumer has undergone a healthy correction while maintaining its position within a broad up-trending channel, offering clear opportunities for channel trading.
Key points:
1. The stock is moving in a broad up-trending channel, making channel trading easy.
2. The stock receives heavy support when approaching or touching the 180-day moving average.
3. The company reported a 6% profit decline QoQ in the third quarter.

SRM CONTRACTORS - At Channel Support The stock has been travelling in an ascending channel respecting the borders in 4 previous instances. Within the channel, we have seen how the stock price action has been repeating itself. As the saying goes history repeats itself, this time again the stock has shown strength at the channel support which in my opinion seems to be indicating a possible rally towards the upper border of the channel. Only time will tell.
Company has reduced debt.
Company is expected to give good quarter
3 Years ROE 34 %

Mahindra & Mahindra: Navigating a Sideways Channel Topic Statement:
Mahindra & Mahindra's stock is rangebound, presenting clear opportunities for channel trading amidst stable third-quarter performance.
Key points:
1. The company reported a 21.7% profit growth in the third quarter.
2. The stock price is moving in a sideways channel, making channel trading straightforward.
3. Heavy resistance is observed at 3200, while 2700 acts as strong support.

PCR Option TradingWhat is a good PCR ratio? A good PCR ratio depends on the market context, but generally, a PCR below 0.7 indicates bullish sentiment (potential market rise), while a PCR above 1.2 suggests bearish sentiment (potential market decline).
The PCR ratio can be interpreted in the following ways: PCR < 1: When the PCR is less than 1, it indicates that there are more open call contracts than put contracts, which can be seen as a bullish sentiment in the market. Traders and investors expect the underlying asset's price to rise.

Divi's Laboratories - Stable PerformerTopic Statement:
Divi's Laboratories has shown resilience amidst the broad market correction, with stable price movements and potential for accumulation near the 180-day moving average.
Key points:
1. Company reported a profit growth of 64% QoQ for the third quarter.
2. Price broke down from the up-trending channel, transitioning into a sideways pattern.
3. Strong resistance is present at the 6000 level.
4. The stock repeatedly approaches the 180-day moving average, presenting a good buying opportunity.

#DVLDhunseri Ventures Ltd's its fundamental data:
- *Market Capitalization*: ₹1,224 crores
- *P/E Ratio*: 4.8
- *P/B Ratio*: 0.4
- *EPS (TTM)*: ₹49.83
- *Dividend Yield*: 1.4%
- *52-Week High/Low*: ₹543/₹302
- *ROA*: 9.8225%
Please note that the data might not reflect real-time changes, and it's always best to verify with a reliable financial platform for the latest information.
