Divi's Laboratories - Stable PerformerTopic Statement:
Divi's Laboratories has shown resilience amidst the broad market correction, with stable price movements and potential for accumulation near the 180-day moving average.
Key points:
1. Company reported a profit growth of 64% QoQ for the third quarter.
2. Price broke down from the up-trending channel, transitioning into a sideways pattern.
3. Strong resistance is present at the 6000 level.
4. The stock repeatedly approaches the 180-day moving average, presenting a good buying opportunity.
Parallel Channel

#DVLDhunseri Ventures Ltd's its fundamental data:
- *Market Capitalization*: ₹1,224 crores
- *P/E Ratio*: 4.8
- *P/B Ratio*: 0.4
- *EPS (TTM)*: ₹49.83
- *Dividend Yield*: 1.4%
- *52-Week High/Low*: ₹543/₹302
- *ROA*: 9.8225%
Please note that the data might not reflect real-time changes, and it's always best to verify with a reliable financial platform for the latest information.

CarTrade Tech- CnH FnP. Keep on Radar📊 CarTrade Tech - Technical Analysis 🚗
Reason for Picking This Stock:
CarTrade Tech has been in an uptrend since March 2023, trading within a rising channel. The stock tends to take support near the 50 DMA and the channel bottom, showcasing strong demand in those areas.
✨ Key Highlights:
1️⃣ Breakout from 3.5-Year Resistance: The stock has broken above a significant 3.5-year-old resistance level of ₹1,622.85 and gave a weekly closing above it.
2️⃣ Chart Patterns:
Cup and Handle (CnH) formation near the 3.5-year resistance.
Flag and Pole (FnP) pattern adds conviction to the breakout.
3️⃣ No Overhead Resistance: The left side of the chart shows no major resistance, providing room for upside movement.
4️⃣ Relative Strength in Market Correction: The stock has held strong during the broader market correction.
🎯 Trading Levels & Risk-Reward (R:R):
Entry: ₹1,835
Stop Loss (Closing Basis): ₹1,514
Positional Target: ₹2,543
SL %: 17.5%
R:R: 1:2
📌 How to Trade:
✅ Wait for Confirmation: A clear breakout with volume and a wide-range candle will strengthen the setup.
✅ Small Position Size: As the market trend is bearish, trade with reduced risk.
✅ Pullback Entry: Look for a pullback to the 50 DMA region or channel bottom for better risk-reward entries.
✅ Add on Base Formation: If the stock consolidates above the breakout level and breaks out again, consider this as a further entry point.
⚠️ Risk Considerations:
🚨 The broader market is trading well below the 50 DMA and 200 DMA, with a death cross in play. Committing large capital at this point may not be advisable.
🚨 This is a pure technical call on a fundamentally weak company. Perform your own due diligence before trading.
💡 Key Points to Watch:
1️⃣ Clear breakout from the Flag and Pole (FnP) and Cup and Handle (CnH) patterns.
2️⃣ The channel top may act as a resistance, so monitor price action near those levels.
3️⃣ Broader market stabilization above the 200 DMA and 50 DMA is crucial for larger capital deployment.
🚦 Final Thoughts:
CarTrade Tech is showing relative strength in a falling market—a key factor for stock selection during corrections. The intention is to highlight opportunities in stocks performing well despite broader market weakness. Trade cautiously and stick to strict risk management. 💪 and do not wait for target to be achieved in this market condition. Try to book partial and trail SL.
📉 Disclaimer: This analysis is for educational purposes only and not financial advice. Always consult your financial advisor before making any trading decisions.

GOLD - TRADING AT CHANNEL RESISTANCE - TIME TO SELL?Symbol - XAUUSD
CMP - 2858
Gold has reached a new all-time high (ATH) of $2861 & trading at rising channel resistance, amidst heightened risks of tariff conflicts and persistent inflation, encountering resistance at the channel trend. However, due to potential political manipulation, the possibility of a market correction exists.
Currently, gold is consolidating above $2840 following its ATH, as it awaits key data such as US employment figures and speeches from Federal Reserve officials. Increased volatility has been observed, driven by conflicting statements regarding former President Trump's tariff policies: tariffs were initially imposed, only to be rescinded a few hours later, highlighting the influence of political decisions. Following a false breakout at the resistance of the ascending channel, gold is now undergoing a correction, partly prompted by news of the temporary suspension of tariff hikes by the United States. Despite these fluctuations, gold remains resilient, supported by the Fed’s cautious stance on rate cuts.
Key Resistance levels: $2860 and $2872
Key Support levels: $2845, $2840, $2818
Should the price fall below the $2840 mark and consolidate beneath this level, a short-term correction towards $2824 - $2815 may occur. However, no significant trend reversal is indicated, and growth may resume from these key support areas.

DIVISLAB Flag and Pole FormationTrade Setup
Entry Level: ₹6,336 🚀
Stop Loss (SL): ₹5,323 (Closing Basis)
SL Percentage: -16.01% 📉
Target Levels:
T1 (Positional Target): ₹7,404 (+16.88%) 🎯
Risk-to-Reward (R:R): 1:1⚖️
Technical Highlights
📌 Flag & Pole: The stock shows a strong flag and pole pattern, indicating bullish potential.
📌 Key DMAs: Trading comfortably above key moving averages (DMAs), adding strength to the setup.
📌 Pullback Bounce: Well-supported bounce after pullbacks.
📌 Volume: Needs improvement for stronger confirmation.
📌 RSI: Decent, supportive of the setup.
Key Strategy
⚡ Wait for Volume Confirmation: Entry should be accompanied by increasing volumes to ensure breakout sustainability.
⚡ Tight Monitoring: Since the R:R is moderate, ensure disciplined adherence to the SL.
⚡ Partial Booking at ₹7,000: Optional for risk reduction before T1.
Risks:
1️⃣ Volume Concern: Weak volume might fail to sustain breakout.
2️⃣ Broader Market Trends: Adverse market movements may impact performance despite strong technicals.
💬 Execute cautiously, and ensure disciplined trading!
⚠ Disclaimer: This is for educational purposes and not financial advice. Please consult your advisor before trading.

MUTHOOTFINThe chart is self-explanatory and shared for educational purposes.
The most prominent feature is the clear upward-trending channel that the stock price has been respecting. This is a significant bullish indicator, suggesting consistent upward momentum. The recent price action shows the stock price touching the bottom of the channel line. This suggests a potential bounce-back towards the upper channel line, further reinforcing the bullish sentiment implied by the channel.
The alignment of the 50-day, 150-day, and 200-day moving averages, with the 50-day being highest, followed by the 150-day, and then the 200-day, is often considered a sign of a potential upward trend.
Risk Management: Always use stop-loss orders to manage potential losses.

NIfty at Channel & 200Ema support in 15 minsHello,
Nifty spot made high around 23800 after the 2025 budget now delhi elections exit polls and some selling there nifty in 15 mins trading at near channel support and there is Ema 200 line along with slow selling volume is not seen as needed for short opportunity RSI adjusting and oversold in 15 mins overall bullish set up forming.

$NSE:LTF NSE:LTF
📊 **L&T Finance Stock Chart Analysis** 📉
In the L&T Finance stock chart, I can identify a clear descending channel pattern forming in recent months (visible from October 2023 to January 2025). This pattern is characterized by:
- Two parallel descending trendlines containing the price action.
- The upper trendline connecting the lower highs (around 151.95, 145.87).
- The lower trendline connecting the lower lows (134.10, 129.20).
Currently, the price appears to be testing the upper resistance line of the channel around the 146 level. The channel has a slight downward slope, indicating an overall bearish bias during this period. However, the recent price action shows some bullish momentum as it's moving towards the upper boundary of the channel. The trading volume has been relatively consistent throughout this pattern formation, with some notable spikes during key price movements. The RSI indicator shown at the bottom also suggests increasing momentum with the recent upward movement. 📈
### Potential Breakout Analysis 📊
- The current price (146.07) is testing the upper resistance line of the descending channel.
- The RSI is showing strength, moving above the 50 level with positive momentum.
- Volume has increased recently, supporting the upward price movement.
### If a Bullish Breakout Occurs Above 146-147 Levels 📈
- **First Target:** Around 151.95 (previous swing high).
- **Second Target:** Could extend to the 159-160 zone (based on previous support turned resistance).
- The height of the channel is approximately 16-17 points (145.87 - 129.20), so projecting this from the breakout point gives a potential target of 162-163.
### Key Points to Watch 👀
- **Volume Confirmation:** Should see above-average volume on breakout.
- **RSI:** Should maintain above the 50 level.
- **Price:** Should close above the channel resistance for confirmation.
### Risk Management ⚠️
- Strong support exists at the 140-141 zone.
- Stop loss can be placed below the 134-135 level (channel support).
**Disclaimer:** These are technical projections and actual price movement may vary. It's important to use proper risk management and not solely rely on technical analysis for trading decisions. 📉📈

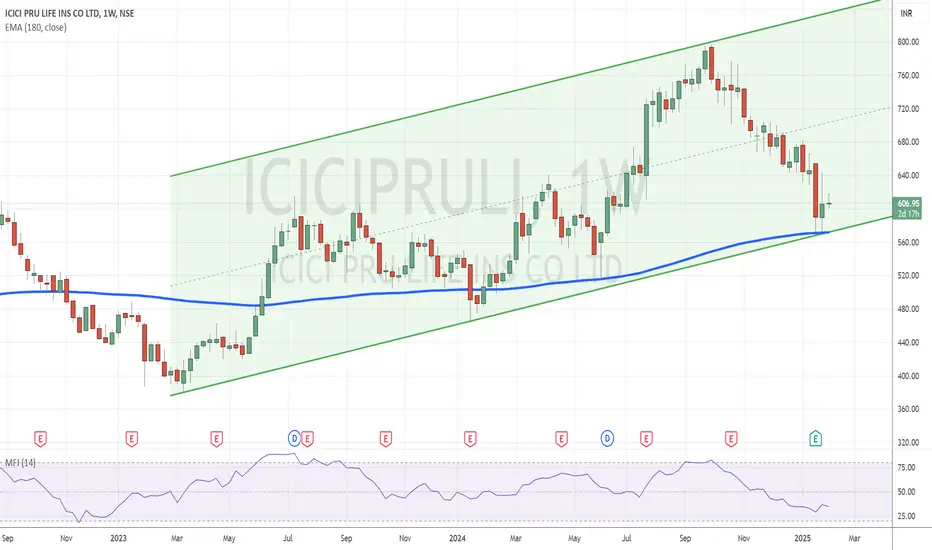
ICICI Prudential: Oversold and Poised for Recovery Topic Statement: ICICI Prudential Life Insurance has made a healthy correction, positioning itself near strong support levels within an up-trending channel.
Key Points:
1. The company reported a robust 43% profit growth QoQ.
2. The price is moving in an up-trending channel, providing clear trading opportunities.
3. The stock is taking support at the lower end of the channel, indicating oversold conditions.
4. The price is near the 180-day moving average, reinforcing the oversold status.
5. Weekly MFI is at 34 which also indicates the price being oversold.
V2 Retail Ltd: CnH Breakout Setup🛒 V2 Retail Ltd: CnH Breakout Setup
Entry: ₹2,002.85
Stop Loss (SL): ₹1,687 (on closing basis; -15.77%)
Target:
🎯 Positional Target: ₹2,323 (+15.98%)
🚀 Why this trade?
Chart Pattern: Clear Cup and Handle (CnH) breakout with the stock trading in an ascending channel.
Trend Confirmation: The stock is maintaining its position above key Daily Moving Averages (DMAs), confirming strength in the uptrend.
Sectoral Tailwind: Budget 2025 brings a positive outlook for the consumption and FMCG sector, supporting this trade's fundamentals.
Volume: Increasing, but it still needs improvement to strengthen the breakout signal.
⚠️ Key Observations and Risks:
Resistance Ahead: The channel top may act as resistance, so price action near these levels should be watched carefully.
Market Context: Broader market trends are weak, making this a counter-trend trade that adds an element of risk.
Volume Concerns: Volume is yet to fully confirm a breakout; a retest is possible.
📚 Educational Insights:
Channel Tops as Resistance: In ascending channels, the upper boundary often acts as dynamic resistance; breakout strength depends on volume.
Risk Management: With a wide stop loss (closing basis), position sizing becomes critical to limit exposure.
This is a positional trade, so short-term fluctuations shouldn’t influence decisions prematurely.
✅ Suggested Approach:
Take small positions initially to minimize risk while testing the market.
Monitor volume and sector strength for additional confirmation.
Avoid over-leveraging in trades with broad SLs, especially in counter-trend setups.
📈💡 "Adapt to market behavior, but always trade with discipline and patience."
Disclaimer: This analysis is for educational purposes only and should not be considered as financial advice. Trading and investing involve significant risk, and past performance is not indicative of future results. Please consult with your financial advisor before making any trading or investment decisions. Always manage your risk and trade responsibly.

Cummins - Weekly Set-up (Long)Cummins is close to completing Wave 4. (Maybe last dip to 2500)
Wave 5 targets 5000, 7000.

Bharat forge - Weekly Set-up (Long)Bharat Forge seems to have completed Wave 4.
Wave 5 targets 1800, 2200

BOMBAY SUPER SEEDS LTD [BSHSL]- DESCENDING CHANNEL PATTERN1. Pattern Analysis: What We See
- Pattern Name: Descending Channel with Double Bottom Breakout.
- What is Happening?
- The stock has been moving downwards within a descending channel for the last two years. This means the price has been repeatedly bouncing between two downward-sloping lines (the upper red resistance line and the lower blue support line).
- Recently, the price broke above ₹173, which was the resistance level of the descending channel and the breakout point for a double bottom pattern (a strong bullish reversal pattern).
- Why is This Important?
- A breakout from such long-term patterns, especially with strong volume, indicates that the trend is changing from bearish to bullish.
- The stock is showing strength and is now poised to move higher if it holds above ₹173.
2. Volume Analysis: What the Numbers Tell Us
- Recent Volume Behavior:
- Over the past two weeks, we’ve seen a sharp increase in trading volume. This suggests that big players (like institutions) are buying the stock in anticipation of higher prices.
- This spike in volume aligns perfectly with the breakout above ₹173, adding confidence to the bullish signal.
3. Price Action: What the Candles Show
- Recent Candlesticks:
- The last few candles on the chart are big and bullish (wide bodies with strong upward movement).
- The stock is now trading near ₹170–₹173, showing strength after the breakout.
4. Bullish Signal Confirmation
- Breakout Confirmation:
- The stock has crossed and stayed above ₹173, confirming the breakout.
- This is a clear sign of a bullish trend reversal.
- Key Levels to Watch:
- Support (Safety Net): ₹150 is the critical support level. If the stock falls below this, the bullish setup could weaken.
- Resistance (Next Hurdles):
- First Target: ₹200 (psychological and historical resistance).
- Second Target: ₹260 (next major resistance based on the pattern).
5. Entry, Targets, and Stop Loss
- Recommended Entry:
- You can consider entering near ₹173 if the stock holds above this level with good volume.
- Targets:
- First Target: ₹200 (short-term).
- Second Target: ₹260 (medium-term).
- Stop Loss:
- Keep a stop loss at ₹150. This ensures that if the stock moves against the setup, your losses are minimized.
Disclaimer:
This analysis is for educational purposes only and should not be considered as investment advice. We are SEBI-registered research analysts, and while the information shared is based on thorough technical analysis, you are strongly advised to consult your financial advisor or analyst before making any investment decisions. Markets carry risks, and past performance does not guarantee future results.

Laurruslabs - Potential Breakout Opportunity🚀 Laurruslabs - Potential Breakout Opportunity
🔑 Early Entry: ₹627.5
💥 ATH Level: ₹725
📊 Positioning & Strategy:
💰 Entry Point: ₹627.5
⚠️ Stop Loss (SL): ₹498 (20.9% downside risk)
🎯 Target 1: ₹725 (15% upside potential)
📈 Positional Target 1: ₹829 (~32% upside from entry)
🌟 Long-term Target: ₹999 (~59% upside from entry)
📍 Key Levels & Action Plan:
Laurruslabs has been in an upward trajectory since April 2023 📈.
It consistently takes support near the 200 DMA, signaling strength in its trend 🔄.
27 Jan 2025 saw a red candle with huge volume 📉, but the stock quickly bounced back 🚀.
The ATH level at ₹725 is key 🔑. A breakout above ₹725 would confirm a 3.5-year resistance breakout and All-Time High.
💡 Action Strategy:
For Safe Traders:
📉 Book partial profits at ₹725 and trail SL to lock in gains 📊.
For Risk-Tolerant Traders:
👀 Watch for a breakout above ₹725. If confirmed with 3-5X volume 📈 and a clean breakout candle, consider adding more 🚀.
🔢 Risk-to-Reward (RR) Calculations:
From Early Entry to Target 1 (₹725):
Upside: ₹725 - ₹627.5 = ₹97.5 (15% upside) 📈
Downside (SL): ₹627.5 - ₹498 = ₹129.5 (20.9% downside) ⚠️
Risk-to-Reward Ratio (R:R): 1:0.72 (Risk is higher than reward here, so position sizing is key 🧑💼)
From Early Entry to Positional Target (₹829):
Upside: ₹829 - ₹627.5 = ₹201.5 (32% upside) 📈
Downside (SL): ₹627.5 - ₹498 = ₹129.5 (20.9% downside) ⚠️
Risk-to-Reward Ratio (R:R): 1:1.56 (Better reward for the risk taken ✅)
From Early Entry to Long-Term Target (₹999):
Upside: ₹999 - ₹627.5 = ₹371.5 (59% upside) 📈
Downside (SL): ₹627.5 - ₹498 = ₹129.5 (20.9% downside) ⚠️
Risk-to-Reward Ratio (R:R): 1:2.87 (Excellent reward for the risk taken 🎯)
⚠️ Risks Involved:
📉 Market Conditions: The overall market is in a LH LL structure, so we are trading against the trend 📊, which adds extra risk 🔥.
🔥 27 Jan 2025 Candle: The red candle with high volume is concerning, but no follow-through happened 📉. The stock bounced back quickly, which we can consider as a shake-out 🌪️.
📏 Position Sizing: Due to the deep stop-loss (20.9%), position sizing is crucial to manage risk effectively ⚖️.
"The stock market is a device for transferring money from the impatient to the patient." — Warren Buffett
💬 Disclaimer:
This analysis is educational and not financial advice. Always do your own research 📚 and consult a professional advisor 💼 before making any trading decisions. Stock market investments are risky, and past performance doesn't guarantee future returns 💡.

Coal India. Buy the Dip?Stock: Coal India (COALINDIA)
Current Price: ₹385.05
Technical Analysis:
1⃣ Descending Channel: The stock is trading within a descending channel, forming a base with a potential double-bottom pattern.
2⃣Structure: Lower Lows (LL) and Lower Highs (LH). The overall market structure remains weak.
3⃣200-DMA: Stock is trading below its 200-day moving average, indicating caution for bullish momentum.
Trading Plan:
Entry: Above ₹400.30 on a breakout candle backed by 3x-5x volume.
Stop Loss (SL): ₹352.55 (closing basis).
Target Levels:
T1: ₹428.30 (7.00%, R:R 0.8:1)
T2: ₹458.50 (14.55%, R:R 1.6:1)
Positional T1: ₹517.20 (29.20%, R:R 3.7:1)
Positional T2 (ATH): ₹544.30 (36.00%, R:R 4.7:1)
Key Observations:
Dividend Payout: Suitable for long-term investors accumulating during dips.
Weakness Trigger: A weekly close below ₹360 could indicate further downside. Risky traders may short below this level.
RSI: Needs improvement to signal bullish strength.
Momentum Play: Not recommended for short-term traders. Wait for structural change above ₹400.
What to Watch During Breakout?
Volume Surge: Wide-range breakout candle backed by 3x-5x average volumes.
Sustainability: Ensure a close above ₹400 to confirm a breakout.
Disclaimer:
This analysis is for educational purposes only. Always conduct your own analysis and consult a financial advisor before trading. Trade responsibly and manage risks.

Asso Alcohol-Darvas box breakout and Retest done.
✅Stock is in an uptrend
✅Broke out of a base and retested
✅Trading above Key DMAs
✅consolidating right above the base forming base on
base with narrow-range candles
Keep this in your sight and find long opportunity.
CMP: 1128.75
Entry: 1132
SL: 935(Closing Basis)
Risk: 17.3%
Reward: 20.7%
The view shared is for educational purposes. Please do your due diligence.

GOLD - BEARSIH STRUCTURE FORMING. WILL IT BREAK CHANNEL SUPPORT?Symbol - XAUUSD
Gold has recently tested lower levels of rising channel and is now engaging with trend support, creating volatility in the market. The strengthening of the U.S. dollar is exerting downward pressure on the precious metal. Gold appears to be entering a corrective phase, with the market gradually shifting from a bullish to a bearish outlook due to increasing demand for the dollar, driven in part by concerns over potential trade wars arising from U.S. policies under former President Trump's administration.
The issue of tariffs imposed by the U.S. remains unresolved. Meanwhile, traders are closely monitoring U.S. economic data, including durable goods orders and consumer confidence, as well as the Federal Reserve's upcoming meeting, with its outcome expected to be released on Wednesday.
From a technical perspective, after the breakdown of the bullish market structure, the price is currently testing the support of the established channel. It is unlikely that this support level will be breached on the first attempt, and the price may experience a corrective move towards 2745 or potentially the imbalance zone, such as the 2750-2760 range, before resuming its downward trajectory due to selling pressure.
Key resistance levels: 2745, 2751, 2760
Key support levels: 2735, 2718
If the price fails to breach the 2745 resistance level and retreats to 2735, this could signal a potential break of trend support. In that scenario, an impulsive move towards 2718 may materialize. However, if the 2745 resistance level is overcome, gold could test the 2750-2760 range before continuing its downward movement which is more likely.

HALIs it the first sign of top formation in HAL.
parallel channel upper edge is touched from the bottom. Monthly candle is also doji, follow through will be interesting to watch

Wipro's Steady Climb with Cautionary Signals Topic Statement:
Wipro's recent strong quarterly performance has led to a significant surge in its stock price, indicating a potential bullish trend.
Key Points:
1. The company reported a robust 24.6% QoQ profit growth for the third quarter.
2. The stock is trading in an up-trending channel, making channel trading convenient.
3. A double top pattern has emerged, indicating potential resistance.
4. Buying at the lower end of the channel, near the 180-day moving average, offers an oversold entry point.

IREDA CMP 207 Weekly Chart Forming Parallel channelIREDA is forming Parallel Channel on Weekly chart.
RSI 14 is going up slowly. Price is trying to cross 20 EMA line on weekly basis.
Resistance around 229-234, 260-264 and ATH 310
Support 189, 170
Target 1 : 310
Target 2 : 540++
Probable Time Period : 3-5 Months

Nifty Weekly Review Jan 27 - Jan 31Price moved in range between 23000 to 23400 through out this week. 23000 is a strong support zone. Price is bullish as long as it is sustaining above 23000.
In daily time frame price is testing support zone and should move above it to be bullish.
Buy above 23060 with the stop loss of 23010 for the targets 23100, 23140, 23190, 23240, 23300, 23360, 23420 and 23460.
Sell below 22960 with the stop loss of 23000 for the targets 22920, 22880, 22820, 22760 and 22720.
Do your own analysis before taking any trade.

Persistent Systems: A Promising Opportunity?Persistent Systems is currently trading in an ascending channel, indicating an ongoing uptrend 📈. After correcting nearly 20% from its all-time high (ATH)—which coincided with the channel top—it has now broken above a key trendline with strong volume and a wide-range bullish candle 💪.
📊 Key Technical Analysis:
🎯 Entry: ₹6,365
⛔ Stop Loss (SL): ₹5,538 (closing basis)
🏁 Targets:T1 (Previous ATH): ₹6,790 (+7%)
Positional Target: ₹7,681 (+21%)
Long-Term Target: ₹9,094 (+43%)
📌 Technical Highlights:
1⃣Persistent has bounced back from the 50 DMA, showing strong respect for this critical support level
2⃣Closed above the 50 DMA with a strong bullish candle (minimal upper wick, significant volume).
3⃣Trendline Breakout
4⃣RSI is rising, indicating upward momentum.
5⃣Channel top could act as resistance—keep an eye on price action near T1 levels.
🧮 Position Sizing:Start with 20-30% of your planned allocation at ₹6,365.
If ₹6,790 is broken with volume, consider adding more.
Partial profits can be booked at T1, with the remainder trailed for higher targets.
⚠️ Respect the SL (Stop Loss), as it represents a 12.45% risk.
📈 Why Persistent Systems Looks Attractive for Long-Term Consideration:
1. 🌟 Growth Drivers:
AI Integration: AI is a core focus for Persistent’s growth strategy, with significant investments in AI-driven solutions 🤖.
Strategic Acquisitions: Acquisitions like Starfish Associates (contact center modernization) and Arrka (digital governance and AI cybersecurity) enhance Persistent’s offerings.
📊 Revenue Momentum: The company has reported 18 consecutive quarters of revenue growth, recently achieving a robust 18.4% YoY increase.
🏆 Industry Recognition: Named the fastest-growing IT services brand in the 2024 Brand Finance India 100 report, highlighting its competitive edge.
2. 🛠️ Expansion Plans:
Focused on AI-led, platform-driven services to drive innovative solutions for clients.
Strengthened executive leadership to support non-linear growth through mergers, acquisitions, and large deals.
3. 💹 Respecting Key Support Levels:
Persistent has consistently respected the 50 DMA, a strong indicator of investor confidence and support at this level.
These factors, coupled with the company’s strategic focus on AI and consistent execution, make Persistent Systems an attractive consideration for long-term investment.
🌍 Broader Sector Context:
The IT sector is holding up well despite market volatility, and Persistent’s positioning in emerging technologies like AI ensures it is aligned with future trends 🔮.
💡 Final Thoughts:
This trade is against the trend, so trade light and manage risk effectively ⚖️. The channel top could pose resistance, but the overall structure and long-term prospects are promising. The probability of trades failing is high when the market is in a downward trend. Please keep that in mind.
If you find this analysis insightful, like and share to help others make informed decisions 👍.
Follow me for more educational trading ideas and detailed stock analysis 📚.
❗ Disclaimer: This is for educational purposes only. Please consult with your financial advisor before making any trading or investment decisions.

EMCUREAfter great IPO listing, it failed to sustain the bullish strength gained initially.
now it fails to retain the bulls. This is the time to test the company strength
Bears are ready
