NIFTY Budget Day buying opportunityNifty 50 is travelling in a descending channel from all time high. It has broken the mid-point of the channel and can drop approx 4% more to reach the bottom line.
NSE is conducting a special trading session on Saturday 1st Feb, when the new budget will be presented. This co-incides with the bottom of the channel, so I expect Nifty to drop approx 4% more in the next 7 sessions.
It should bounce from the bottom line which is also a support zone from Election Day and before, take a rejection from the channel mid-point, take support from the top of the zone, then go upwards to the top line of the channel.
Parallel Channel

Expiry day analysis - 21 Jan SensexPrice is moving in an upward channel and now it is at channel support. Sustaining above 77000 is important to be bullish.
News can affect normal market movement.
Buy above 77120 with the stop loss of 77020 for the targets 77200, 77320, 77400 and 77520.
Sell below 76900 with the stop loss of 76980 for the targets 76820, 76700, 76620, 76540 and 76440.
Do your own analysis before taking any trade.

SWING (KEP WATCH)Script opened huge gap up bouncing after clearing parallel channel (bottom near support area -1750) right now trading at another swing area -1900 level. 1935 can be levels to watch out for further continuation

SWING (KEEP WATCH) - BHARAT DYNAMICS BDLscript in good momentum after Higher High- Higher Low creation on move from support area around 1110 and also clearing major trendline, can test 1300 levels

Indus Ind BankI have found interesting patterns in different time frame. In lower time frame price has formed an ascending triangle, and it is testing the bottom of the channel. Also price is consolidating in a narrow range.
In daily time frame, price is forming a descending triangle and testing the upper trend line of the channel.
So two time frames with different direction. In which direction price will move?
We can expect more range move if price fails to gain trend strength.
Buy above 974 with the stop loss of 966 for the targets 982, 990 and 998.
Sell below 960 with the stop loss of 970 for the targets 950, 938 and 926.
Do your own analysis before taking any trade.

National Aluminum Co Ltd - Looks Good.Candidate looks good for swing trade with target of 240 INR. and S/L of 180 INR. CMP 205.54 INR.
Reason
Swing Trade
Touch Point reversal
MACD Cross Over
Continuation Wedge (Bullish) Pattern formation
PLEASE NOTE THAT:
This chart analysis is only for reference purpose.
This is not buying or selling recommendations.
I am not SEBI registered.
Please consult your financial advisor before taking any trade.

IDBIBANK PARELLEL CHANNEL BREAKOUTIdbibank breaking parellel channel weekly basis
breaking 20ema taking #support at 200ema
with huge volume,strong rsi
#target 107 sl 65
#q3result on 20 january
NO BUY/SELL RECOMENDATION

SWING TRADE (OBSERVATION) - RELIANCE INDUSTRIESScript is showing breakout from trendline after retest on prominent support area (parallel channel) as shown , if momentum continues may head to higher resistance area of 1320

CNXPSUBankin past 5 years this has given good run up in parallel channel. It would be interesting to watch how channels break down. but before that it has dead cat bounce to be watched

CNXPSUBANKInverse head and shoulder formation gives a confirmation that price has reversed well from lower end of the parallel channel and ready to move up. middle resistance zone has be bo and retested as well.

GrasimPrice gave two side move today and in that process it has formed an ascending channel. And now price is at the channel support.
Buy above 2326 with the stop loss of 2306 for the targets 2348, 2372, 2394 and 2408.
Sell below 2285 with the stop loss of 2305 for the targets 2268, 2240, 2210 and 2192.
Do you own analysis before taking any trade.

HDFC Life Recovers Post-Quarterly ResultsTopic Statement: HDFC Life has shown a strong recovery after posting a 14% QoQ growth in Q3 earnings, with the stock taking support at the 61.8% retracement level and breaking above its down trending channel, indicating a trend reversal.
Key Points:
1. Company reported a 14% QoQ growth in 3rd-quarter earnings.
2. Price took heavy support at the 61.8% retracement level.
3. Price jumped by 8% after the results, creating a gap.
4. Candle closed above the down trending channel, signaling a trend change.

SWING (OBSERVATION) - LTTS
Script opened Gap up -bounce from support around 4637 and showing good intraday momentum clearing a parallel channel around 5200
Can be considered for long position if momentum sustains

Kaynes bouncing from channel support and 50 D
#Kaynes Technology. Looks good for a Swing.
Entry: Buy Small quantities in CMP(6547)
Stop Loss (SL):Marked at ₹5,806.30,
Target (T1): ₹7,697
✅Channel Pattern: The price is moving within an ascending channel, respecting both the upper and lower trendlines.
The recent pullback appears to have tested the lower trendline support, followed by a bounce.
✅The stock is trading above the 200-day moving average (yellow line), signifying a bullish long-term trend.
✅Stock Takes support at 50 DMA. Right now it is bouncing from channel support and 50 DMA.
✅A sharp green candle on strong volume indicates renewed buying interest at current levels.
📎Strategy:
Buy at CMP in small quantities to reduce risk, as per the chart's suggestion.
📎Watch for:A strong close above the middle of the channel for confirmation of bullish momentum toward the target.
Exit the trade if the price breaches the ₹5,806.30 stop-loss level.
⚠️Overall Trend is bearishI'm Not sure if this is the beginning of a bear market or a Bull Market Correction. So keep the positions limited. Do not go full-on. Keep your capital safe and manage the risk properly.

Bank NiftyBank nifty surprised me today by giving more trending movement compared to nifty. Bank nifty was lacking trending moves once its weekly expiry was reduced to monthly expiry. 😢
Coming back to the analysis, price is moving within a channel today. Price is testing the lower trend line of the upward channel and sustaining current level is important to be bullish.
Buy above 48740 with the stop loss of 48660 for the targets 48820, 48900, 48980, 49100, 49180 and 49360. Sell below 48560 with the stop loss of 48640 for the targets 48480, 48400, 48300, 48220 and 48100.
Do your own analysis before taking any trade.

FSL taking support at Channel Bottom and Bouncing...Stock: Firstsource Solutions Ltd.
📎Chart Pattern: Ascending channel with a recent pullback.
✅Key Levels:Entry: ₹380.35
✅Target (T1): ₹423.10
✅Stop Loss (SL - Closing Basis): ₹344.70
📎 Observations:
✅Stock is consolidating within a rising channel and has bounced from its lower trendline.
✅The 50DMA(Green) and 200DMA(Yellow) are acting as strong supports, suggesting bullish momentum.
✅RSI and volume remain aligned with the uptrend.
📎Risk-Reward:
It is favourable for swing and positional traders. Further additions above 423 would be possible if we get a clean breakout with volume. EveryPullback to 50/200 DMA is a buying opportunity.
⚠️Overall Market sentiments are weak and we are trading against the trend.
Disclaimer: This analysis is for educational purposes only, not financial advice.

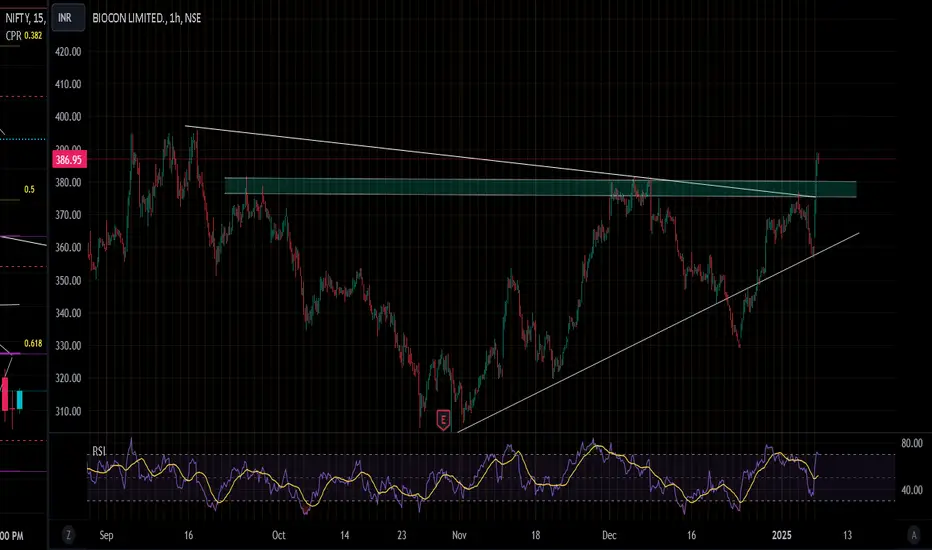
SWING TRADE- BIOCONScript showing a good bounce from 50ma with HH HL formation , also clearing prominent rejection area (parallel channel and trendline breakout) above 360 which can also act as good SL
HCLTECH's Resilient Bull RunTopic Statement: HCLTECH is on a strong bull run, resilient to the recent market correction, with a healthy profit growth and price trading at its lifetime high within an up-trending channel.
Key Points:
1. Company reported a 7.5% profit growth QoQ.
2. Price is moving in an up-trending channel, simplifying channel trading.
3. Trading at its lifetime high.

Nifty 50 at a Critical Support: Rebound or Further Decline?Hello everyone, i hope you all will be doing good in your life and your trading as well, today i have brought a daily timeframe analysis on Nifty which is trading within a Bearish Falling Channel and recently broke down from a smaller Bullish Channel , indicating continued weakness. It is now approaching a Strong Support Zone , which could either lead to a rebound or a fall toward 22,246 if the support breaks. The RSI shows bearish divergences aligning with past declines, while recent bullish divergence suggests possible support. This is a key level to watch closely.
Disclaimer: This post is for educational purposes and not financial advice. Always do your research and manage your risk.
Don’t forget to like and follow for more trading ideas like this. Check out my profile @TraderRahulPal for other detailed insights into technical and fundamental setups. Let’s grow together!

AARTIINDafter falling from the high of 1000
it has been inside the parallel channel since past 2 years
now after mild retracement it may try to break the channel towards up
but 680 is crucial level which it may not be able to break and has to consolidate further

OFSS Bull Run with Oversold OpportunityTopic Statement: OFSS is on a bull run, with the stock price moving in an up-trending channel and currently touching the lower part, making it oversold.
Key Points
1. Stock price is moving in an up-trending channel, hence channel trading is clear.
2. Price is currently at the lower part of the channel, indicating it is oversold, hence an opportunity is present.

SWING (OBSERVATION) - NAVIN FLOURO CHEMscript in high intraday momentum with huge candle bounce from support area (green channel ) supported by volumes trading near a resistance area . Keep watch for sustained momentum above 3870

Eicher motors breaks 6 month long consolidationStrong candle on 2nd Jan 2025 with big volume breaking out of 6 month resistance near 5k.
Good to add for 10k target on pullbacks time period 6months to 1 year.
Entry near 5k-4950 stop will be 4673
