CHOLAFIN - ReassessmentThe last time I posted the chart, the inverted Head and Shoulder pattern was evident and it had signaled that the downward trajectory has been arrested. However, the analysis was premature and with the very close Stoploss we were safely out of the stock. That is the benefit of having a stoploss.
Since then the stock has gone on to form a nice base respecting that bottom zone the Inverted Head and Shoulder had arrested and also now it is making a more evident Triple Bottom on the Support line of the Ascending Channel.
I believe the stock is now ready for an up move.
Parallel Channel

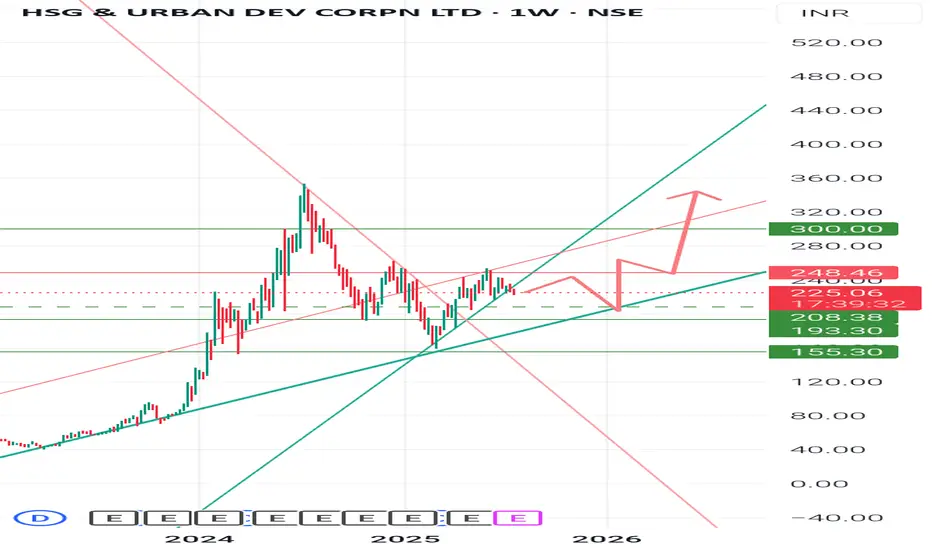
Hudco : Long with support 210 to 360Keep adding small quantity on every dip of Hudco for 1-2 years.. It will touch 360 .
There is support and demand zone 240-210.. Stock will consolidate in this range for few months, so have patience, good things take time. 👍
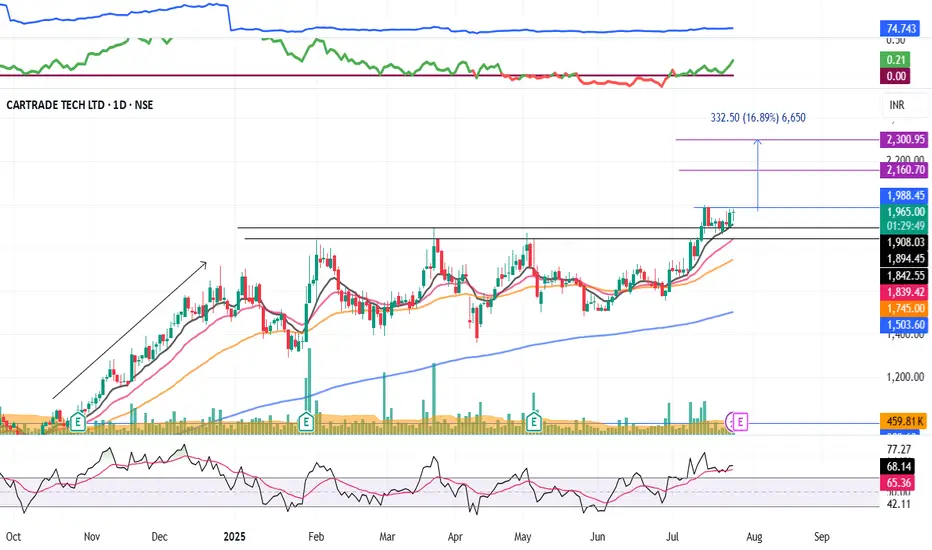
CARTRADE : Momentum pick#CARTRADE #swingtrade #momentumstock #breakoutstock #basingpattern
CARTRADE : Swing Trade
>> Good Base formation
>> Breakout + Retest done
>> Good Strength & Volume dried up
>> Trending setup
Swing Traders can lock profit at 10% and keep trailing
Pls boost, comment and follow us for more such analysis
Disc : Charts shared are for Learning purpose and not a Trade recommendation. consult a SEBI Registered Advisor before taking position in it.
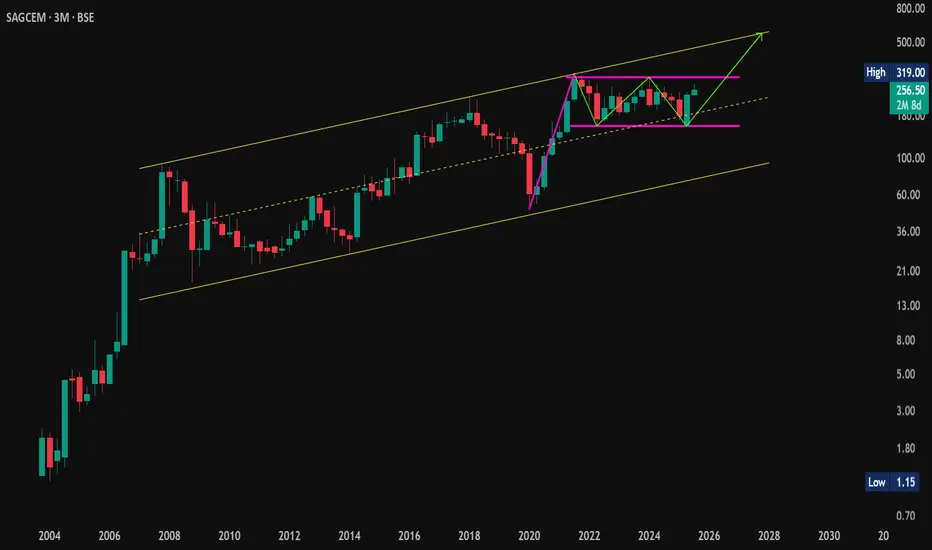
Flag + W Pattern Combo on Monthly! | #SagCem On Radar🔍 #OnRadar
#SagCem (Sagar Cements Ltd.)
🚩 Flag + W Pattern Combo on Monthly!
📈 Chart Timeframe: Monthly & Quarterly (Educational Observation Only)
📊 Technical Structure Overview:
A rare confluence of bullish patterns spotted:
🚩 #FlagPattern — classic continuation structure
🔻🔻 #WPattern (Double Bottom) — bullish reversal signal
🔼 Both developing inside a long-term #AscendingChannel
🎯 Potential Pattern Projections:
Flag Target: 560+
W Pattern Target: 450+
🛡 Support Zones:
255
234–209 (Demand cluster)
❌ Pattern Invalidation:
Below 155 on Monthly Closing Basis (MCB)
🧠 Educational Note:
When multiple bullish structures align on higher timeframes, they often lead to explosive moves—if validated by breakout and volume.
⚠️ Disclaimer:
This is not a buy/sell recommendation. Shared strictly for educational and technical study purposes. Always consult your financial advisor before acting on any market insights.
#PriceAction | #TechnicalAnalysis | #ChartPatterns | #FlagPattern | #Wpattern | #AscendingChannel | #InsideBar | #LongTerm
Angel One Struggles to Recover After Weak Earnings, Stuck in DowTopic Statement:
AngelOne remains under pressure after a sharp profit decline, trading within a downtrending channel as it struggles to regain bullish momentum.
Key Points:
* The stock is moving in a clearly marked downtrending channel, allowing for structured channel-based trading
* It received strong support at the 50% Fibonacci retracement level around 2000, helping limit further downside
* Price generally faces resistance above the 100-day EMA, which continues to cap any rebound attempts
* A breakout above the channel could signal a trend reversal, but the poor quarterly results may delay any significant upside move

TATVA LONGElliott Wave analysis shows that the stock has completed waves (i), (ii), (iii), (iv) and (v) downside. Currently, the stock is undergoing correction wave (a), (b), and (c) in a daily time frame.
stock is currently in Wave (a).
Wave (a) will unfolded in five sub waves in red colour.
Wave iii (in red colour) of wave (a) will unfold in five sub waves ( in black circle) on the chart.
Wave levels are shown on the chart.
Level of Invalidation
The starting point of Wave (i) has been identified as the invalidation level at 788.5. If the price falls below this level, it can indicate that the expected Elliott Wave pattern is not as it seems.
I am not a registered Sebi analyst. My research is being done only for academic interests.
Please speak with your financial advisor before trading or making any investments. I take no responsibility whatsoever for your gains or losses.
Regards
Dr Vineet

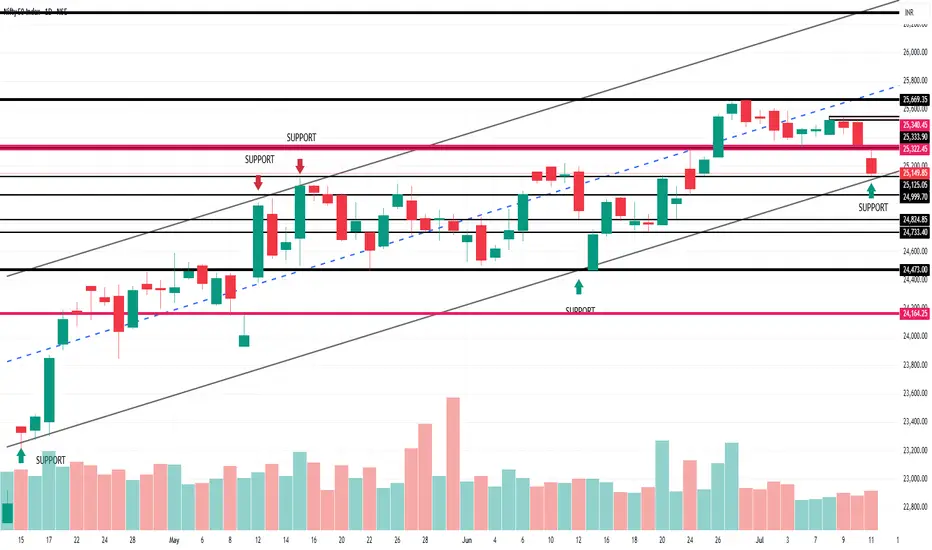
Nifty : possibility of a parallel channel break down• Nifty is trading in upward trending parallel channel for last 2 months.
• Multiple datapoint has confirmed the parallel channel.
• Nifty recently formed a M pattern and a lower low in 1 D time frame.
• Daily close is near to bottom of the channel.
• Closing below 25100 will confirm the channel break.
• Possible target is 24164 which will feel the downside gap.
• Wait and watch to catch the big fish.
• Happy trading!!!
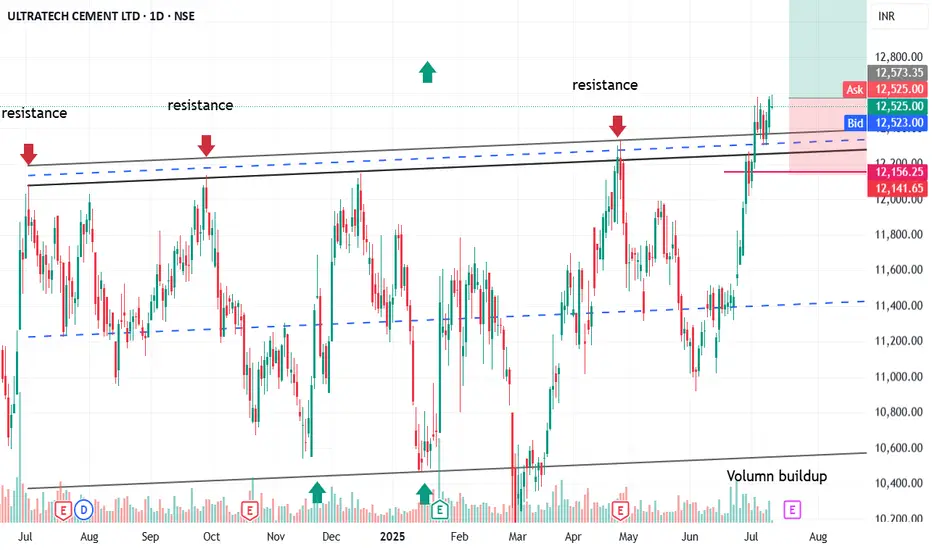
ULTRACEMCO : A opportunity to get 1: 4.5 RR in channel BO• Ultra tech was moving in parallel channel from Q3-2024.
• A perfect channel could be fitted on the stock.
• Last 1 weeks there is a significant volumn spike in the stock.
• Last week closing was above the channel
• If this week closing is above previous week closing then bullish move confirmed
• Swing stop loss is 1214
• Target are channel length + 12500 that is 12500 + 2000=14500 in the chart.
• An opportunity of 1: 4.5 RR in swing trending.
• Already retested the support
• Go long only when todays daily close is above yesterdays close. As index looking week tread with caution and sl.
• Idea is for educational purpose and explore the price action learning with trading psychology.
• Have fun traders!!! 😊
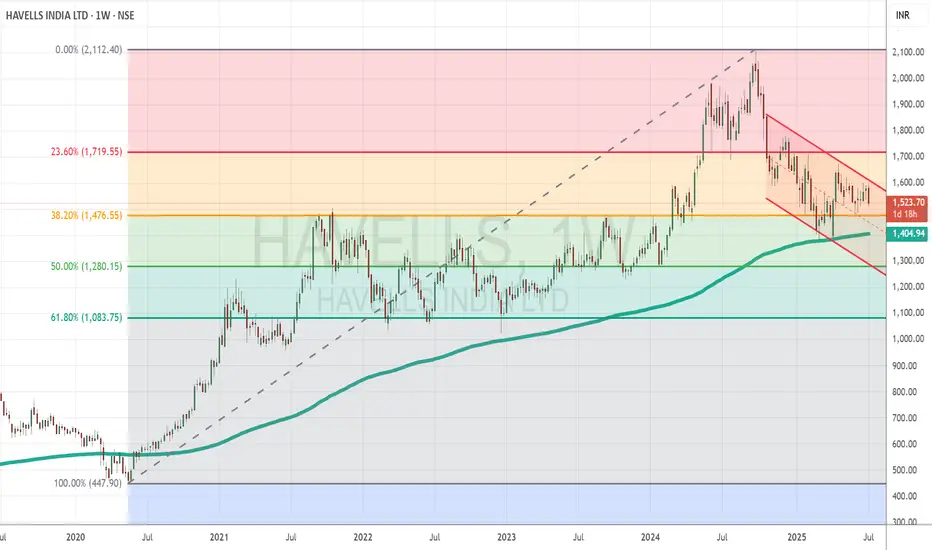
Havells India Shows Early Bullish Signs After Strong Support at Topic Statement:
Havells India has corrected but is showing early bullish signals, supported by key technical levels and poised for a breakout from its short-term downtrend.
Key Points:
* The price corrected to the 38.2% Fibonacci retracement level, where it received strong support
* It touched the 200-day EMA, which acted as a deflection point, preventing further downside
* Currently moving in a short-term downtrending channel, the stock is likely to resume strong bullish momentum once it breaks above this channel
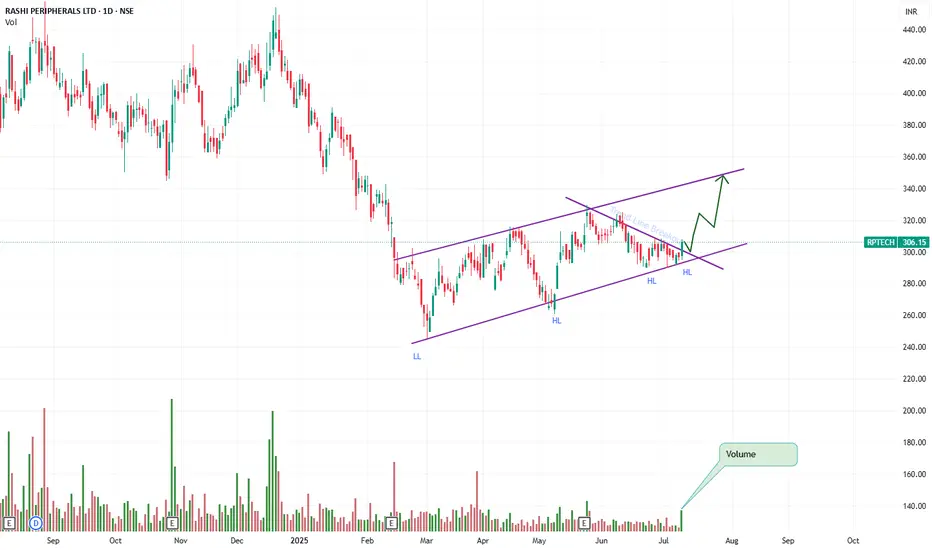
Rashi Peripherals Long Setup channel pattern 1:2 RRRashi peripherals following channel pattern and forming HH and HL.
Swing Trade
Buy Rashi Peripherals
Above: 306
add few quantities near 300-302
Stop Loss: 292
Target 1 : 325
Target 2 : 340
Trade as per your risk-taking capacity.
Stock has broken trendline with volume also form W pattern on channel support ready for up move to touch upper channel resistance.
Buying at 300 will give 1:4 RR
Nestle India Climbs Strongly Within Bullish Channel, Eyes PotentTopic Statement:
Nestle India is moving steadily upward in a strong bullish channel, setting up for a potential breakout as it approaches previous highs.
Key Points:
* The stock is trading in an up-trending channel, making it ideal for channel-based trading strategies
* It recently retraced to the 23.6% level and is now recovering, maintaining overall strength
* A previous double top suggests that a rise to those highs could trigger a breakout if resistance is cleared
* The price consistently rebounds when touching the 200-day EMA, reinforcing it as a strong dynamic support level

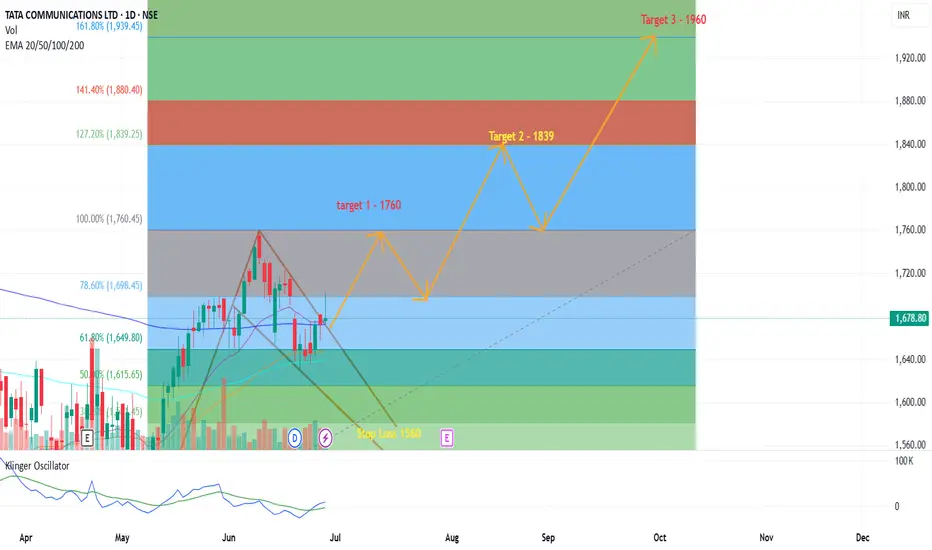
Accumulate Tata Communication - Target 1960Tata Communications has given a breakout from the trading channel on daily basis.
Following are the targets in coming months
Target 1 - 1760
Target 2 - 1839
Target 3 - 1960
Stop Loss - 1579
Natural GasThis chart analysis is for educational purposes only.
Natural Gas is reversing from the channel bottom, marked by a strong bullish candle, and is anticipated to continue its upward momentum with high probability.

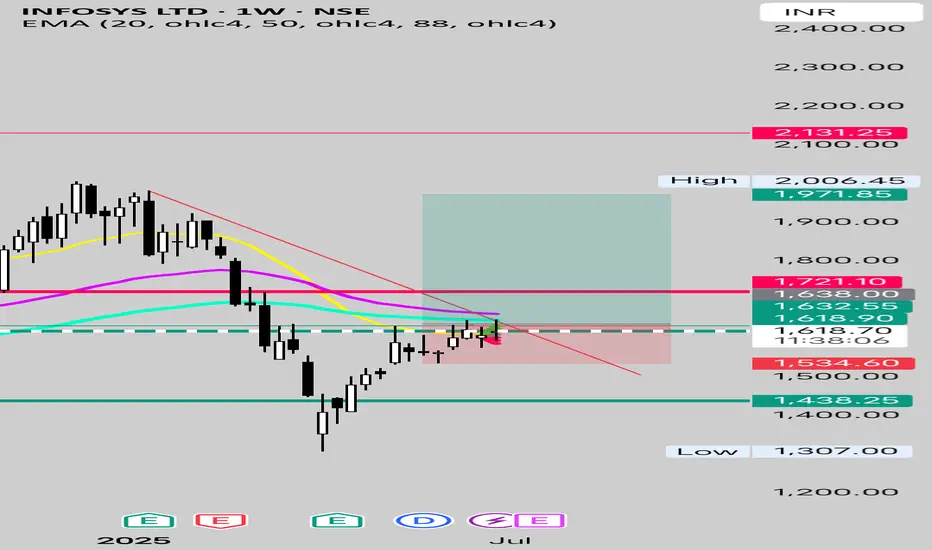
Infosys Ready For 30% Potential UpsideFrom 2000 to 2020
Over period of 20 Years ( Observe The Marked Circles)
Infosys on Monthly TF has Bounced And Rallied Sharply Everytime it has Touched 88 ~ 100 MEMA after Crossing the 20-50 MEMA and has traded in a Parallel Channel which provides a Stable And Solid Structure to Match the Fundamental Growth of the Stock.
Ever Since The Mega Breakout of 2020 after crossing 1.618 Fib Extension of the Rally that began in 2000
We have Upgraded the Channel
We are Near the Trendline and have been consolidating for about 8 Weeks without any signs of Bearishness.
This Prolonged consolidation followed by Trendline break and Historical Higher Monthly TF Support makes good case for Potential Upside of about 30% from CMP 1618 which will gain momentum above 1720.
Targeting 2000~2100 which happens to coincide with Upper End of the Parallel Channel
Look for the Inv Head and Shoulder in Formation in Short term for Swing Trade
Hereby Sharing a Short term Potential Trade with Longer Term Perspective in The Description above.
Buy Above 1638
SL below 1530
TP 1950~ 2000
R:R = 3
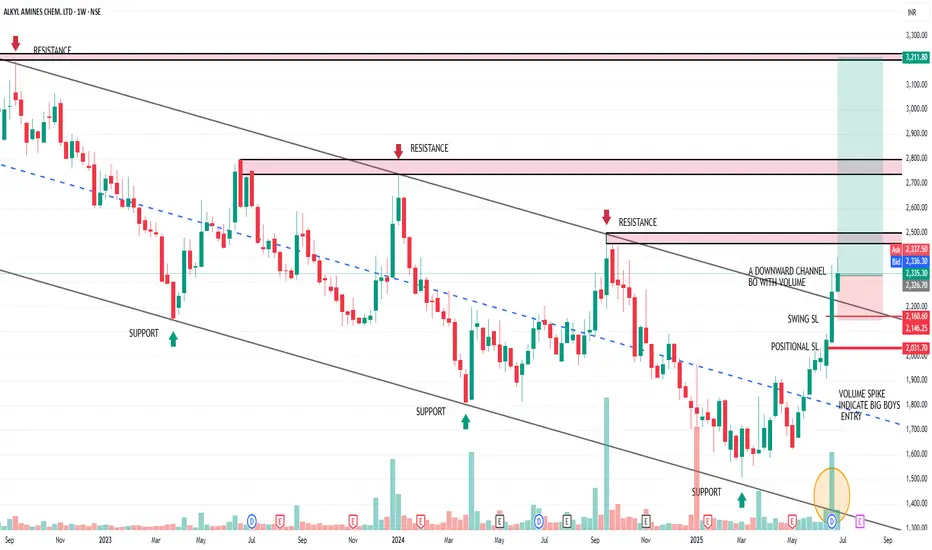
ALKYL AMINES: A classical channel BO with 1:7 RR• AlKYL AMINES was moving in a downward parallel channel from Q4-2022.
• A perfect channel could be fitted on the downtrend
• Last 3 weeks there is a significant volumn spike in the stock.
• Last week closing was above the downward channel
• If this week closing is above previous week closing then bullish move confirmed
• Swing stop loss is 2160
• Positional sl is 2031
• Target are mentioned in the chart.
• An opportunity of 1: 5 RR in swing trending.
• Positional trader may hold this trade till ATH @4725 with a 1: 7 RR.
• Idea is for educational purpose and explore the price action learning with trading psychology.
• Have fun traders!!! 😊
Gold Still Above Support Zone 3300Bears have Some reason to worry.
Rightly so, since we are Hovering around Right Shoulder
If Bears Fail to capitalise on this opportunity to Enter Shorts again..
We could well be Looking at ATH Aiming 3600 3700
Rationale
Taking Support at 20 50 DEMA
Weekly support at 3300
Prolonged Consolidation has allowed RSI and MACD to cool down and Yet Trade in Bullish Territory

Sensex - Expiry day analysis July 1Trend deciding zone is 83500. And also now price is at the lower trend line of the channel from here price can bounce or break the channel.
Buy above 83600 with the stop loss of 83480 for the targets 83700, 83820, 83940, 84060 and 84200.
Sell below 83380 with the stop loss of 83500 for the targets 83280, 83200, 83040, 82900, 82780 and 82660.
Always do your own analysis before taking any trade.

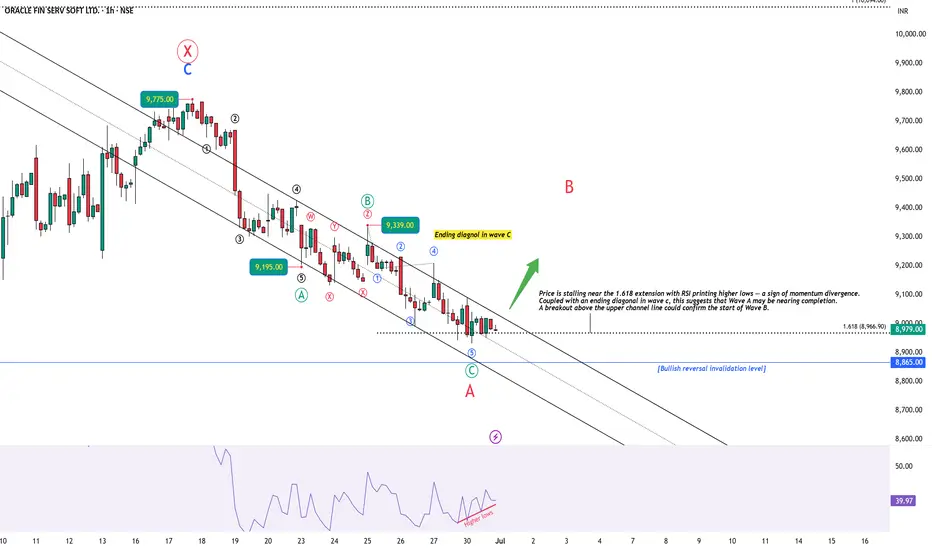
OFSS: Setting Up for a Relief Rally?🔍 Introduction
This analysis starts from the 1-hour timeframe, where price action shows signs of exhaustion at the tail end of a 5-wave decline. A classic ending diagonal in wave c, along with bullish RSI divergence, points toward a potential short-term reversal — possibly the start of Wave B in a larger A-B-C corrective structure. We then zoom out to place this setup within a broader W-X-Y correction that began from the 13,220 high.
🕐 1H Chart: Ending Diagonal + RSI Divergence into Key Zone
Following the peak at 9775, price has been declining in what appears to be a ABC zigzag correction. Subwave 5 (within wave c) exhibits ending diagonal behavior, with overlapping internals and weakening thrust. Importantly, RSI has been printing higher lows, diverging strongly against lower price lows — a signal of potential bottoming.
Price is also testing the 1.618 Fibonacci extension level. A decisive breakout above the upper trendline would confirm a likely transition into Wave B.
🟢 Watching closely for a decisive breakout / close above the channel.
📆 Daily Chart: W-X-Y Structure from 13,220 High
Zooming out, ORACLE FIN SERV is unfolding a W-X-Y correction from its 13,220 high:
Wave W completed as a zigzag down to 7038.
Wave X unfolded as a zigzag rally, peaking at 9775. Notably, Wave C of X did not reach 100% of Wave A — signaling internal weakness.
Wave Y is now developing as a red A-B-C structure, with Wave A possibly ending near the 8930 level.
🧠 Conclusion & Key Levels to Watch
Wave A of Y appears to be nearing completion, supported by:
Ending diagonal structure in wave C (1H)
RSI bullish divergence
Price stalling at 1.618 extension
A breakout above the channel could mark the start of Wave B — potentially retracing 38–61.8% of the drop from 9775
📌 This setup offers both short-term and structural clues. I’ll post follow-ups as this unfolds.
⚠️ Disclaimer
This post is for educational purposes only and does not constitute financial advice. Please do your own research and manage risk appropriately.
XAUUSD Bullish Reversal from Channel Support | Gold Buy SetupAnalysis Overview:
Gold has been trading inside a clearly defined descending channel (marked by the orange trendlines). After a strong bearish move, price has reached the lower boundary of this channel, which is acting as dynamic support.
Key Technical Details:
Descending Channel Support: XAUUSD has tested the lower trendline multiple times and is currently showing rejection wicks, suggesting potential exhaustion of selling pressure.
Demand Zone: The shaded horizontal area represents a prior consolidation and minor support level that aligns with the channel bottom, adding strong confluence.
Entry: Planned buy entry at the current level near channel support, anticipating a bounce.
Stop Loss: Placed below the recent swing low and outside the channel, to allow room for volatility while protecting against continuation of the downtrend.
Target: The mid-to-upper boundary of the descending channel, aiming for a favorable risk-reward ratio.
Market Context: The higher timeframe trend remains bearish overall, so this is a short-term reversal (counter-trend) setup within the channel structure.
Trade Plan Rationale:
Expecting a corrective move upward within the descending channel as price retests previous supply zones and dynamic resistance. This setup is based on:
Confluence of channel support and demand zone
Multiple rejection wicks showing buyers stepping in
Potential mean reversion towards the channel midpoint
Disclaimer:
This is my personal analysis on XAUUSD and not financial advice. Always do your own research and manage risk carefully.

Niftyparallel channel formation in progress
however thr is a supply on high arnd 2400-24350 levels.
mostly breadth is oversold, and stocks near support. good chance to bounce

NVDAgood parallel channel setup on daily chart. results are few days away. any closing above 132 may be very good for short term

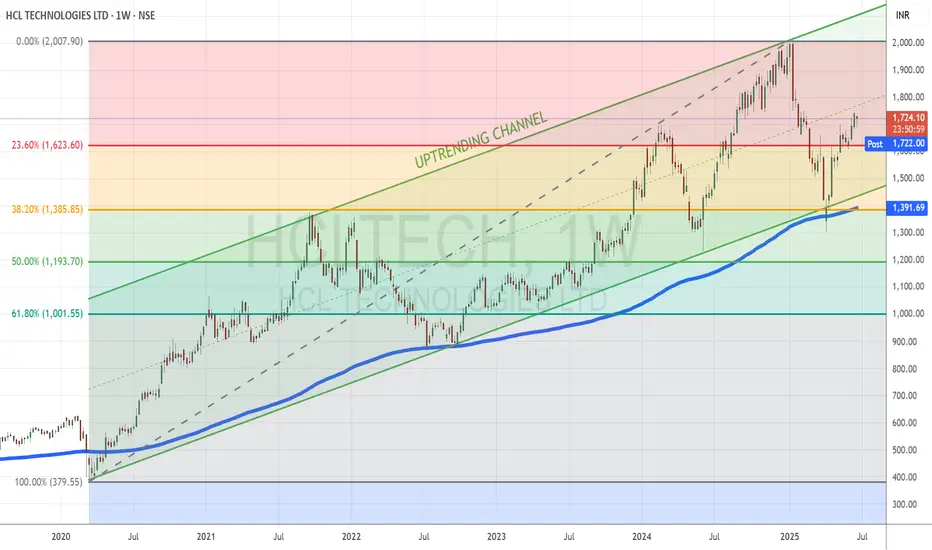
HCL Tech Recovers Strongly, Eyes Resistance at Key Double Top LeTopic Statement:
HCL Tech has rebounded with the broader market, recovering from key support near 1400 and now approaching a critical resistance zone.
Key Points:
* The stock is moving in a mildly bullish up-trending channel
* The stock corrected down to the 38.2% Fibonacci retracement level around 1400 and has since staged a recovery
* The 180-day moving average at 1400 provided strong support, confirming it as a key technical level
* Price is now moving toward the 2000 mark, where it may face stiff resistance due to the potential formation of a double top candlestick pattern
AU bank: A parallel channel break out1. AU bank was consolidating in a downward trending channel.
2. Stock was trading near channel top and moving in a tight range
3. Today 2nd Jund 2025 a bullish marubuzo candle made the range and channel break out.
4. target near ALT round 813
5. SL below ema 21 in day timeframe near 685 zone.
