BPCL : Trading the Confluence of Price Action & Macro TailwindsThe stock has been consolidating within a defined range over the past few weeks and has recently started forming a solid base. While the breakout volume isn’t a classic “God-candle,” price action continues to hold firmly above key moving averages, which is a constructive sign. That said, the price is somewhat extended from the EMAs, increasing the probability of a mean-reversion move. Hence, the stop loss needs to be placed wider rather than just below the basing structure.
The conviction behind this trade comes largely from the current Goldilocks macro environment we’re witnessing in early 2026. With global crude prices remaining comfortably low, BPCL is benefiting from strong marketing margins across petrol and diesel, supporting near-term earnings visibility.
On the fundamental side, a major catalyst is the Government’s LPG compensation package. BPCL is expected to receive a significant share of the ₹30,000 crore payout allocated to OMCs, which materially improves cash flows in H2 FY26. This inflow also acts as a strong deleveraging trigger, further strengthening an already improving balance sheet that has seen a steady decline in debt-equity levels over recent quarters.
So took this position with 1% risk on the net capital.
📢📢📢
If my perspective changes or if I gather additional fundamental data that influences my views, I will provide updates accordingly.
Thank you for following along with this journey, and I remain committed to sharing insights and updates as my trading strategy evolves. As always, please feel free to reach out with any questions or comments.
Other posts related to this particular position and scrip, if any, will be attached underneath. Do check those out too.
Disclaimer : The analysis shared here is for informational purposes only and should not be considered as financial advice. Trading in all markets carries inherent risks, and past performance is not indicative of future results. It’s essential to conduct your own research and assess your risk tolerance before making any investment decisions. The views expressed in this analysis are solely mine. It’s important to note that I am not a SEBI registered analyst, so the analysis provided does not constitute formal investment advice under SEBI regulations.
Patterntrading

NIFTY : 50 D EMA Breach – A Key Level to Track📊 NIFTY – Technical View
• Nifty has closed below the 50-Day EMA, signalling short-term trend weakness.
• The previous 50 D EMA breach occurred around 25th September 2025.
• Notably, during that phase, the critical swing low formed just before the EMA breach was respected, acting as a strong base for the subsequent rally.
• A similar structure is visible now — the recent critical low before the current 50 D EMA breach becomes a key level to track.
• Price rejection near the upper channel / ATH zone highlights distribution at higher levels.
• As long as Nifty trades below the 50 D EMA, rallies are likely to face selling pressure.
I currently hold a position in NIFTYBEES. If the market fails to recover from current levels, there is a high probability that the stop-loss on this position may get triggered. I will continue to manage the trade strictly based on price action and risk parameters.
🧠 Market Character: Transitioning from buy-the-dip to selective, risk-managed trades.
⚠️ Focus: Protect capital, track the marked critical low, and stay reactive.
📢📢📢
If my perspective changes or if I gather additional fundamental data that influences my views, I will provide updates accordingly.
Thank you for following along with this journey, and I remain committed to sharing insights and updates as my trading strategy evolves. As always, please feel free to reach out with any questions or comments.
Other posts related to this particular position and scrip, if any, will be attached underneath. Do check those out too.
Disclaimer : The analysis shared here is for informational purposes only and should not be considered as financial advice. Trading in all markets carries inherent risks, and past performance is not indicative of future results. It’s essential to conduct your own research and assess your risk tolerance before making any investment decisions. The views expressed in this analysis are solely mine. It’s important to note that I am not a SEBI registered analyst, so the analysis provided does not constitute formal investment advice under SEBI regulations.

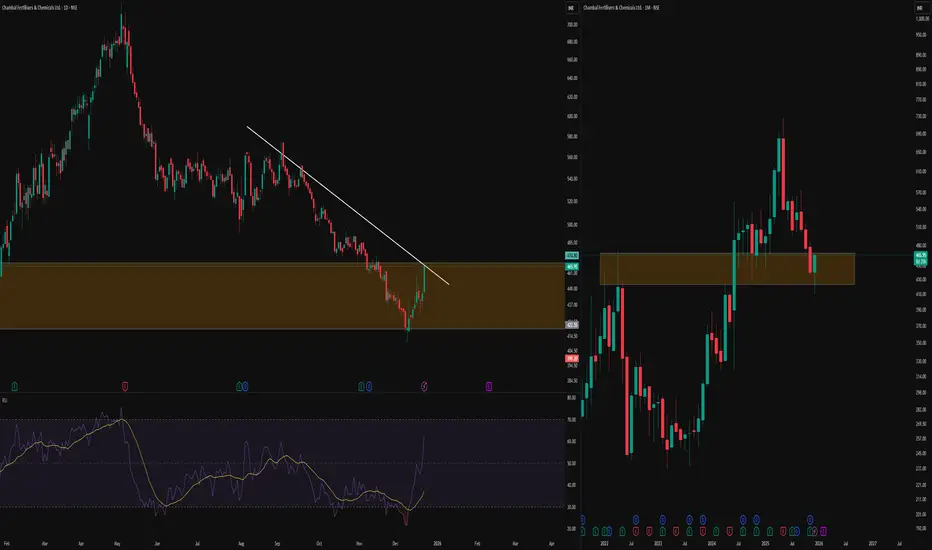
Daily vs Monthly: Counter Trendline Meets Cup Structure-This TradingView post contrasts multi-timeframe analysis, showing a clean counter trendline (CT) a white line connecting swing highs on the daily chart (left) with the monthly chart (right) revealing a classic cup pattern in the orange zone
-Key Concepts Explained
A counter trendline (CT) maps resistance from successive lower highs, highlighting areas where upward moves repeatedly stall and create liquidity zones below prior peaks. The cup breakout on monthly shows price emerging from a rounded base, followed by sustained action above the rim with multiple retests of those prior levels, demonstrating how higher timeframes contextualize lower timeframe lines.
-Educational Value
Observing CT interactions alongside cup structures illustrates price respect for dynamic resistance across timeframes, aiding in understanding market rhythm without directional assumptions. Traders use such alignments to study historical behavior at key zones.
Disclaimer: Educational content only. Not SEBI registered. No investment advice—do your own research
LXEO FLAG & POLELXEO made a FLAG & POLE formation and breakout. We can expect flag target to $12.8 and pole target to $15.5. Entry price above $10.35 with a stoploss of $8.9
We can expext strong resistance at $11.5
Please make your own analysis before taking any trade.

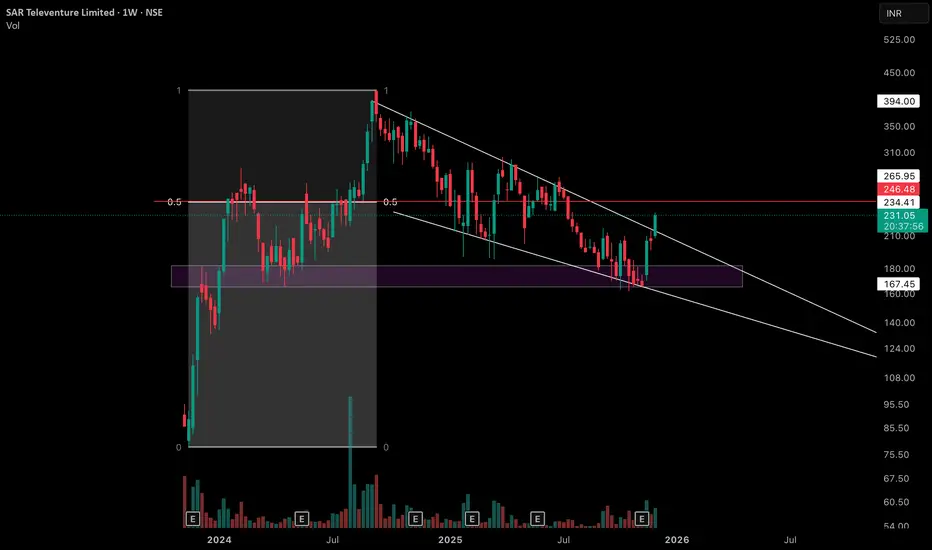
Weekly Equilibrium at Former Supply Zone with 4 observationsObservation 1 - On this weekly chart of SAR Televenture Limited, price has created an interesting equilibrium between the major swing low and the all‑time high swing high, with the 0.5 level highlighted by the red horizontal line as a key mid‑point reference.
Observation 2 - The purple zone marked on the chart was earlier a clear supply / resistance area but has now flipped into a support zone, getting respected multiple times over the past several weeks.
Observation 3 - After printing its all‑time high, price has moved into a sequence of lower highs and lower lows, but each leg has remained relatively controlled instead of showing any one‑sided, sharp liquidation move. This creates a broader consolidation structure where volatility is present yet contained.
Observation 4 - The white lines on the chart represent the upper and lower rejection boundaries of this consolidation channel, and most of the recent candles are developing within these two lines.
Disclaimer: This post is purely for educational and informational purposes, intended to study price structure and market behavior on the weekly timeframe. It is not investment advice or a recommendation to buy or sell any security; traders and investors should do their own research and consult a registered financial professional before making any decisions.
How to approach any Trade like a PROI make educational content videos for swing / positional trading
Charts used in this video are 3 months older for experience sharing using Bar replay feature of Trading view .

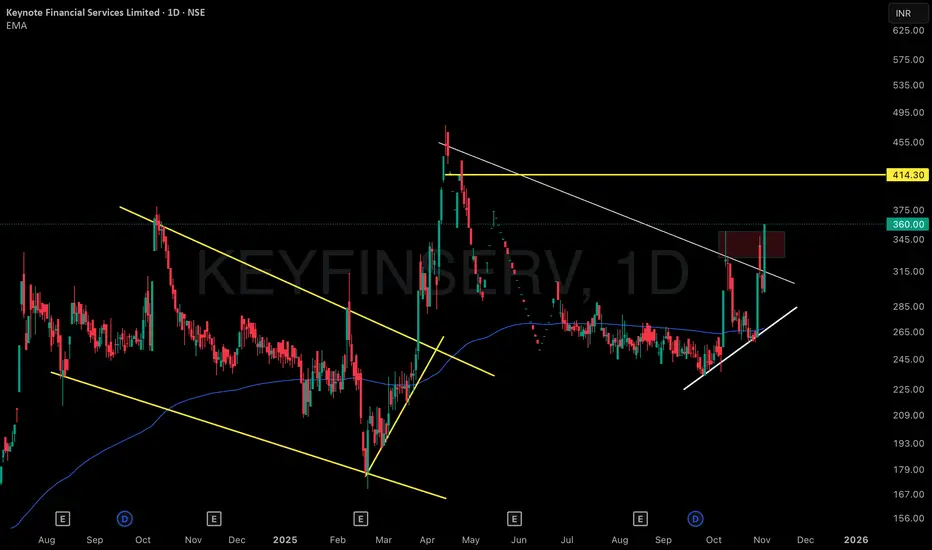
Recurring VCP Structures: Multi-Phase Consolidation & Expansion1 . This chart distinctly showcases a series of visually captivating Volatility Contraction Patterns (VCPs) across multiple phases, elegantly demarcated by yellow trendlines that map out both historical and present consolidation zones. Each contraction zone is marked by repeated, precise touches on trend boundaries, reflecting steady accumulation followed by eruptive volatility and sharp price expansions—almost like a pattern “echo” cycling through the chart.
2 . The highlighted VCP structures reveal not just one, but several contraction-and-expansion cycles, creating an intricate tapestry of market behaviour. Note how each phase includes a concentrated period of sideways price movement, where activity compresses before unleashing swift, directional breakouts. The interplay of these phases turns the chart into a textbook reference for sequential VCP observation, with periods of quiet consolidation—almost like calm before a storm—setting the stage for pronounced volatility bursts.
3 . Recent activity amplifies this effect: vivid volatility swings transition rapidly into tight consolidation, echoing earlier pattern cycles and further emphasizing the recurring structural nature. These technical formations, combined with strong boundary touches and clear momentum surges, make the chart an excellent study in pattern recognition, volatility monitoring, and visual market structure analysis—all shared purely for observational insight, with no predictions or directional bias.
XAUUSD Analysis - Levels and Pridiction#Gold (XAU/USD) Technical Analysis - October 27, 2025
Current Market Status: Retracement on Higher Time Frame,
Lower Timeframe Bearish Breakdown⚠️
Gold is trading at 4,033.67, having broken down from the previous #consolidation zone. The market has violated key support levels and is now showing clear bearish momentum with multiple technical confirmations.
Critical Technical Developments:
1️⃣ Triangle Pattern Breakdown (1H Chart)
The 1-hour chart reveals a confirmed triangle #pattern breakout to the downside. After breaking below the triangle support, price attempted a retest of the breakdown level around 4,093-4,144 but was rejected, confirming the pattern's validity. This is a classic bearish continuation signal.
2️⃣ Demand Zone Invalidation
A crucial demand level that previously held multiple tests has now been completely invalidated. The chart explicitly notes: "Demand Level to be invalidated to move the Price Further Down" - this condition has been met, opening the path for deeper downside movement.
3️⃣ Minor Trend Shift Level Breach
Price has broken below the **Minor Trend Shift Level** at approximately 4,093, confirming a shift from bullish to bearish short-term structure. This level now acts as resistance.
Target Zones (High Probability):
🎯 Immediate Targets:
- 3,945 - Next support cluster (current proximity)
- 3,845 - 0.5 Fibonacci retracement level (PRIMARY TARGET)
- 3,719 - 0.618 Fibonacci retracement level (EXTENDED TARGET)
The Fibonacci levels in green boxes, are the key magnetic zones for price action.
📉 Bearish Continuation (70% Probability)
Price continues lower toward 3,845, potentially extending to 3,719 if selling pressure intensifies. This move would represent a healthy correction within the broader uptrend from the yearly lows.
📈 Bullish Reversal (30% Probability)
Requires reclaiming 4,144 with strong momentum AND holding above it on daily timeframe. Only then would the bearish structure be invalidated.
Conclusion:
Gold remains in a confirmed downtrend on lower timeframes with clear downside targets visible. The invalidation of demand zones and triangle breakdown provide strong bearish confirmation. Traders should focus on the 3,845-3,719 zone as the primary area of interest for potential reversal setups. Until price reclaims 4,150+, the path of least resistance remains **DOWN**.
Risk Management: Use proper position sizing as volatility remains elevated. The 3,845 level will be crucial - watch for buyer reaction there.

Full Replay Breakdown! From Planning to Execution of a TradeWatch as I use the Bar Replay feature to walk you through the planning, execution, and post-trade phases of a real swing trade. Don’t miss these actionable insights, mindsets, and mistakes from start to finish for smarter trading decisions!
Chart used is older than 3 months for explanation

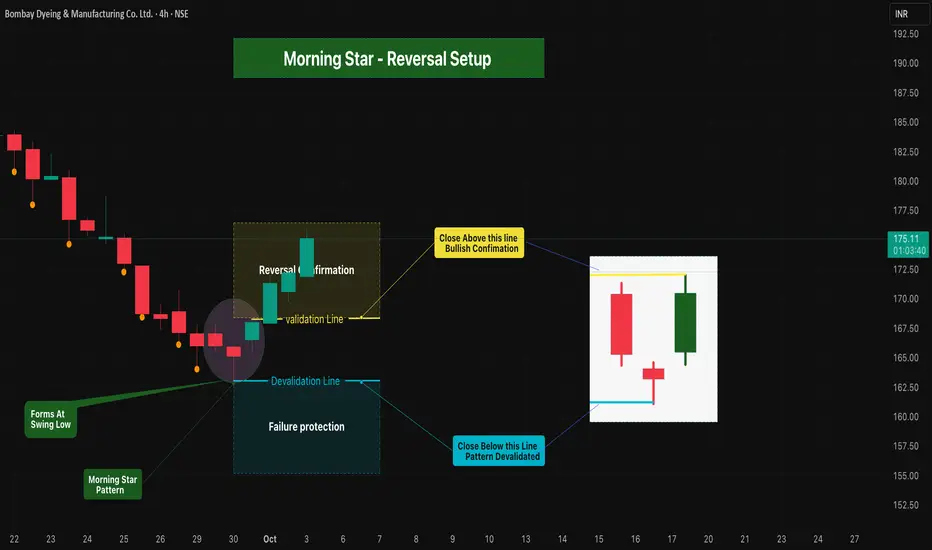
Morning Star - Reversal Setup 🔎 Overview
The Morning Star is a three-candle bullish reversal pattern that forms at a swing low after a downtrend.
• 1st Candle → Long bearish red candle (sellers in control).
• 2nd Candle → Small-bodied / Doji candle (indecision).
• 3rd Candle → Strong bullish green candle closing above the midpoint of the 1st red candle (buyers take control).
This structure signals a possible bullish reversal with clear validation & devalidation rule
____________________________________________________________
🛠 How to Use
• Validation Line → High of bullish candle = breakout confirmation level.
• Devalidation Line → Low of Doji candle = failure protection.
• Entry Rule → Candle close above Validation Line = Bullish Confirmation.
• Failure Rule → Candle close below Devalidation Line (before validation) = Pattern invalidated.
• Forms at swing low
• Protects against false signals & ensures structured risk management.
____________________________________________________________
📊 Chart Explanation
• Symbol → NSE:BOMDYEING Bombay Dyeing & Manufacturing Co. Ltd.
• Timeframe → 4H
• Pattern Confirmation → Morning Star identified & validated.
• Validation Level → 168.24
• Devalidation Level → 163.00
• On 1 Oct 2025 , price closed above validation level, confirming the bullish reversel
____________________________________________________________
🔎 Observations & Conclusion
The Morning Star provides a reliable bullish reversal framework.
With validation & devalidation levels, it filters false signals and enables disciplined risk-reward setups .
____________________________________________________________
⚠️ Disclaimer
📘 For educational purposes only.
🙅 Not SEBI registered.
❌ Not a buy/sell recommendation.
🧠 Purely a learning resource.
📊 Not Financial Advice.
Daily Nifty Analysis: 03/10/25The cup and handle pattern is under formation here.
Support is 24760
Resistance and entry criteria are breached at the 24800-24805 level.
The target of the pattern is 25000, i.e., 200 points above.
On the contrary, the sell will be below 24760, for which I am not focusing much at the moment. On either way, the downside levels are also mentioned.

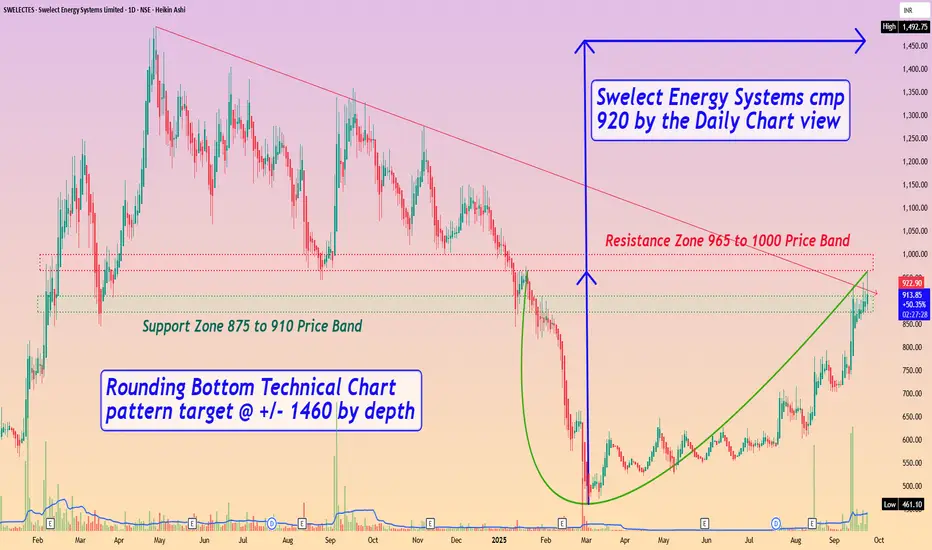
Swelect Energy Systems cmp 920 by the Daily Chart viewSwelect Energy Systems cmp 920 by the Daily Chart view
- Support Zone 875 to 910 Price Band
- Resistance Zone 965 to 1000 Price Band
- Rounding Bottom Technical Chart pattern target @ +/- 1460 by depth
Charting Counter Trends with Broadening FormationsThis chart offers a deep dive into three vital technical pillars:
1) White Box -The demand box marks a price area where buying strength repeatedly emerges, acting as a support anchor.
2) White line - The supply line overhead identifies zones where selling pressure historically dominates, framing resistance.
3) The Red line -A red counter trendline (CT) tracks recent corrective moves against the broader swing, helping isolate short-term rotation.
4) The Green line -Overlaying these, the green broadening pattern signals consolidation through widening highs and lows—a structure often missed at first glance.
By stacking supply, demand, counter trendlines, and broadening consolidation, traders can recognize layered market behavior. Patterns rarely exist in isolation; understanding their interplay builds disciplined chart reading skills and deepens price action insight.
Disclaimer: This content is for educational purposes and not financial advice. Always do your own research before making trading decisions.
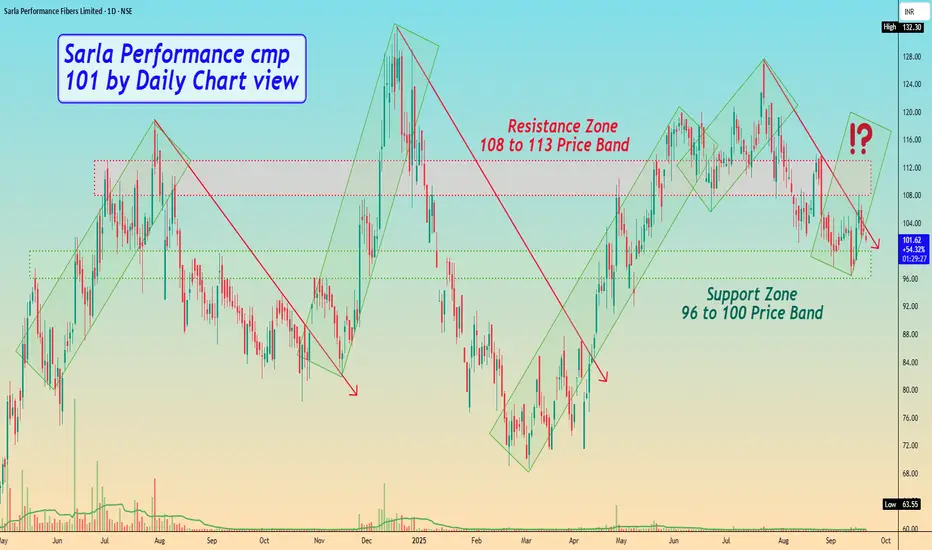
Sarla Performance cmp 101 by Daily Chart viewSarla Performance cmp 101 by Daily Chart view
- Support Zone 96 to 100 Price Band
- Resistance Zone 108 to 113 Price Band
- Rising Falling Price pattern repeated for over a year now
- Will the Price Rising pattern repeat from Support Zone ground ???
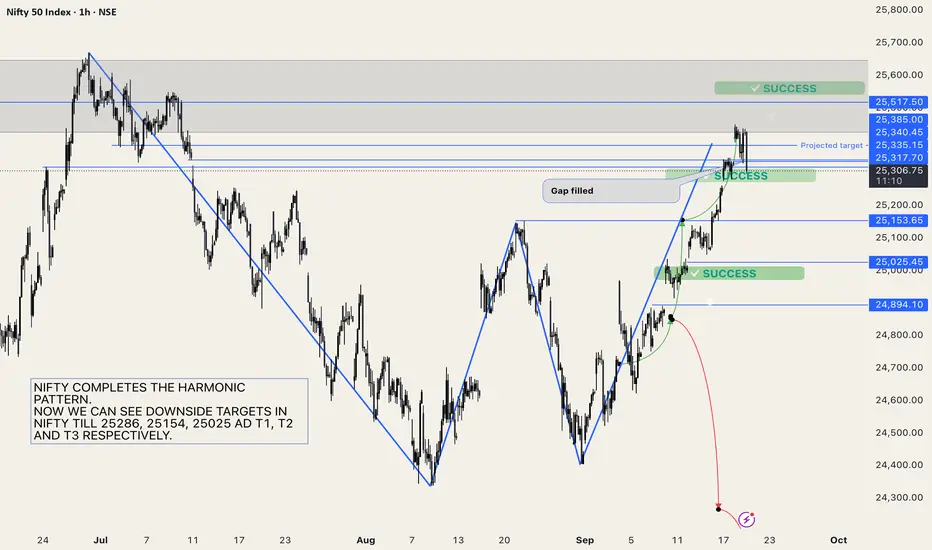
HARMONIC PATTERN IN NIFTY: BEARISHNifty has completed the harmonic pattern.
We can now identify downside targets in Nifty until 25286, 25154, and 25025 AD, respectively, for T1, T2, and T3.
Bearish invalidation is above 25390
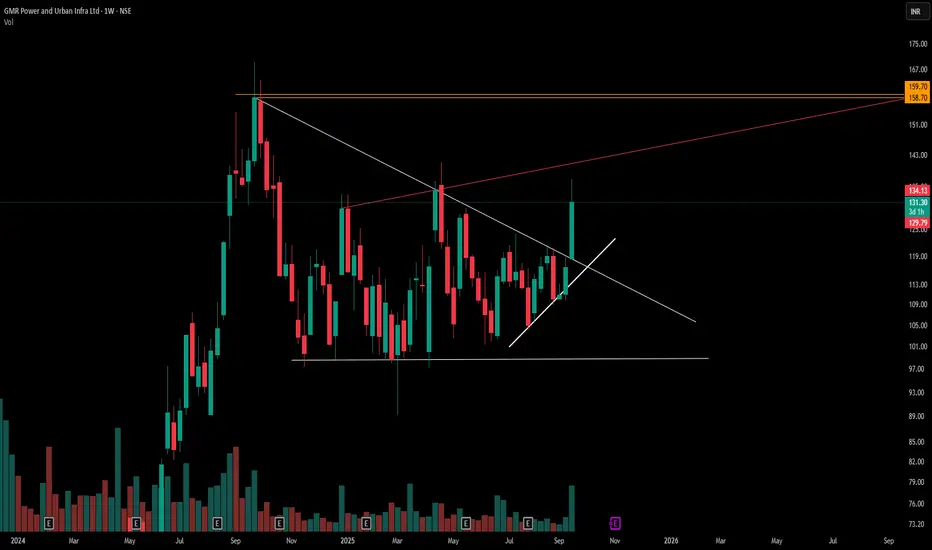
Multi-Pattern Mastery: Descending Triangle Meets Broadening FormThis chart demonstrates the power of multi-pattern recognition in technical study,showcasing how a descending triangle (white lines) can coexist with a broadening formation pattern (red ascending line with shared lower base). The descending triangle shows consistent lower highs against a stable support level, while the broadening pattern reveals expanding volatility through higher highs and the same lower boundary.
Patterns to Study :
Descending Triangles: Characterized by horizontal support and declining resistance, typically indicating bearish pressure building
Broadening Formations: Feature diverging trendlines creating a "megaphone" effect, signaling increased market volatility and indecision
Pattern Confluence: When multiple patterns share common elements (like the lower support base here), it creates stronger technical significance and potential reference points
Disclaimer: This content is for educational purposes only and does not constitute investment advice. Always conduct your own research before making any trading decisions.
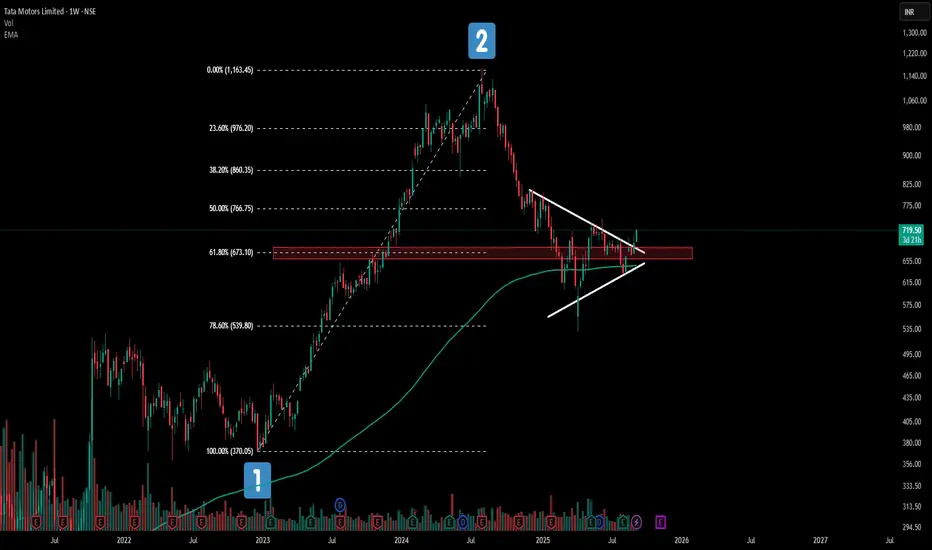
This Tata Motors Pattern Could Change Everything!Tata Motors weekly chart is painting a fascinating picture right now!
📊 Price action is dancing around the 61.8% Fibonacci retracement - a golden ratio traders love to watch.
🎯What makes this even more intriguing? The 200 EMA is playing perfect host to this consolidation party
✨While a symmetrical triangle pattern quietly takes shape. It's like watching three technical forces align in one.
Keeping it simple .
⚠️ This analysis is for educational purposes only and should not be considered as financial advice. Trading and investing in stocks involves substantial risk of loss. Please conduct your own research and consult with a qualified financial advisor before making any investment decisions
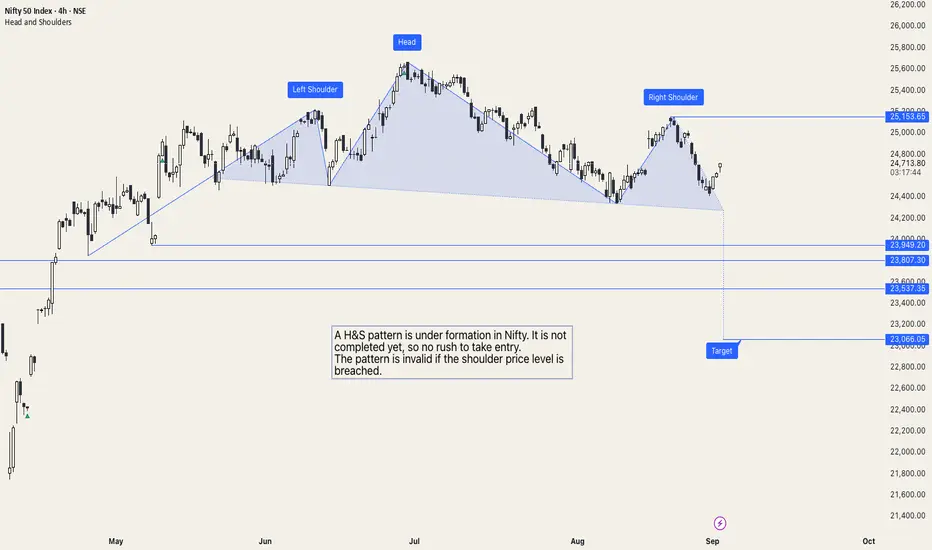
Head and Shoulder pattern in NiftyA H&S pattern is under formation in Nifty. It is not yet completed, so there is no rush to take entry.
The pattern is invalid if the shoulder price level is breached. The chart and levels will be updated once the pattern is validated or invalidated.
Downside levels are 23950, 23810, 23540 and 23070.
Upside levels are 24900, 25150.
Bullish Trade Setup for XRP/USD - Pattern CompletionThis is a bullish setup based on a harmonic pattern completing, with the price approaching a key resistance zone. Our entry, stop-loss (SL), and take-profit (TP) levels are clearly marked on the chart.
Entry: 3.0628
The entry point is marked when the price reaches the ideal level for the pattern completion.
Take Profit (TP): 3.1832
This is the target area where the price is expected to move towards, as per the harmonic pattern and previous price action.
Stop Loss (SL): 2.9627
The stop-loss is placed below the low of the last structure to protect from unexpected price movement.
Technical Analysis:
Pattern Identification:
A clear bullish harmonic pattern is visible, with points X, A, B, C, and D forming a potential Bat or Gartley pattern. This type of setup has historically shown a high probability of reversal or continuation at point D.
Price Action Confirmation:
The price has already shown some signs of reversal at point C, with increasing buying volume at the current levels.
The market sentiment is strong, and we are entering at a point where the pattern completion aligns with the overall bullish market structure.
Volume:
There is a noticeable increase in volume as the price approaches the resistance zone (point X), supporting the idea of a bullish breakout.
Risk-to-Reward (RRR):
The setup offers a 1:2.56 RRR, which is well within an acceptable range, ensuring that the potential reward outweighs the risk taken on the trade.
Why This Trade Makes Sense:
Pattern Confirmation: The harmonic pattern is completing, and price action aligns with the expectations of a move higher.
Key Resistance Break: If the price breaks above the marked resistance, this could signify a strong continuation of the bullish trend.
Solid Risk Management: With a well-placed stop loss, the trade is risk-managed while giving the price room to move.
This setup provides a good risk-to-reward ratio and a high probability of success, based on the technical confluence of the harmonic pattern and price action.

Bullish USDJPY (Long Position)Time Frame: 1-Hour
Trade Direction: Bullish
Entry Price: 148.629
Target Price: 149.262
Stop Loss: 148.108
Risk-Reward Ratio: ~2.3:1
1. Chart Analysis:
The price action has been respecting a strong ascending trendline (blue line) indicating a consistent upward momentum over the past several hours.
Price has recently bounced off the trendline and is approaching a resistance zone near 148.6, showing potential for a continuation upward towards 149.262.
Support Level: The price has previously found support at the 148.1 level, confirming a solid demand zone in the market.
2. Indicator Support:
Exponential Moving Averages (EMA): The price is currently trading above both the 9-period and 20-period EMAs, which is a bullish sign indicating upward momentum. The EMAs are also in alignment, further supporting the bullish case.
Volume Trend: There is an increase in volume accompanying the recent bullish price action, confirming strong buying interest and supporting the idea of a potential breakout towards the target.
3. Risk Management:
The stop loss is placed just below the recent low at 148.108 to provide a reasonable buffer against any price retracement, keeping the trade within an acceptable risk range.
The target is set at 149.262, just below the key resistance level, ensuring that we capture the full potential of the current trend while minimizing the risk.
4. Trade Setup Logic:
This setup is based on the continuation of the uptrend, with strong support from both the price action and indicators. The price action has successfully bounced from the trendline, confirming a potential continuation move towards higher prices.
The target lies near a resistance zone, making it a logical point for potential profit-taking.
5. Conclusion:
The overall market structure and indicators are aligned in favor of a bullish position, providing a high-probability setup. With a clear risk-reward ratio, this trade offers a favorable risk profile and a solid chance for profit.

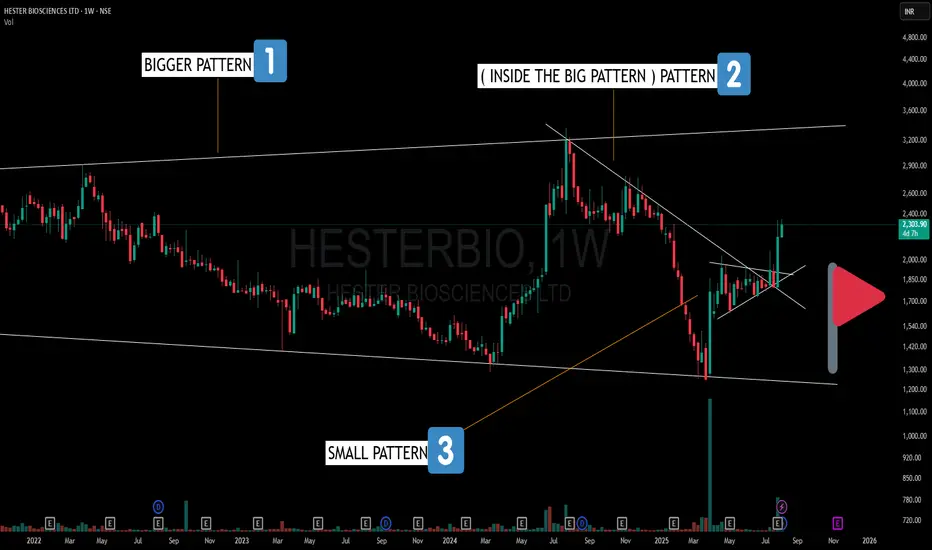
HESTERBIO – A Pattern Inside a Pattern Inside a Pattern!🔍 Here’s what stands out on the Weekly Chart:
1️⃣ Broadening Pattern – Larger structure with higher highs and lower lows, indicating expanding volatility.
2️⃣ Counter Trendline Break – A smaller, random pattern within the broadening formation showing V-shape recoveries and trend shifts.
3️⃣ Bullish Pennant – A compact consolidation pattern just before a strong breakout leg.
This is a great example of how multiple time-frame structures and nested patterns can co-exist—each adding another layer to market behavior.
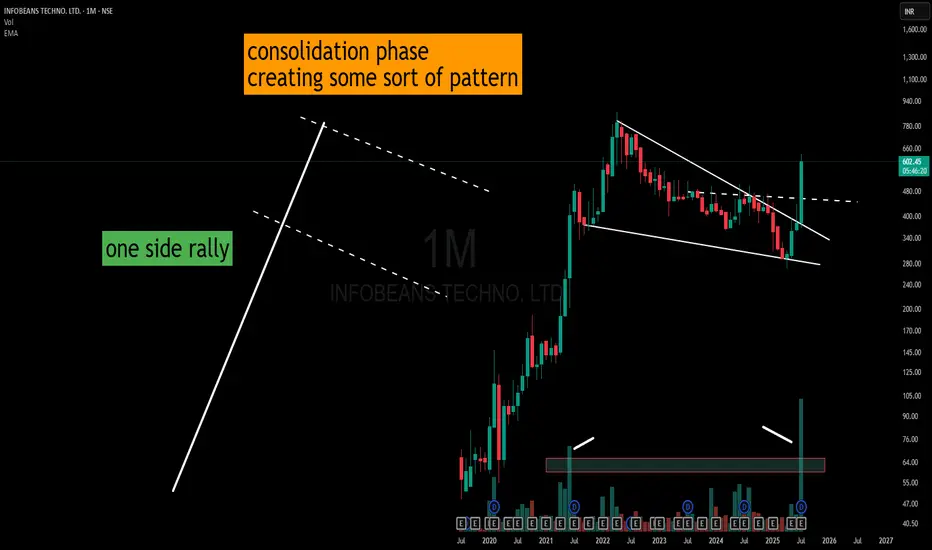
Infobean – Triangle Consolidation with Volume SpikeAfter a sharp one-sided rally, the price entered a prolonged consolidation phase.
Instead of the usual parallel-channel flag formation, the structure has evolved into a descending triangle with slightly lower highs and marginally lower lows.
What stands out is the recent significant volume expansion—often called a “volume buster.” While the shape resembles a pole-then-consolidation setup, the breakout structure and volume shift highlight an important phase change in market activity.
I have only created how I would Draw it and try to get some information out of it.
(This is a structural observation, not a buy/sell recommendation.)
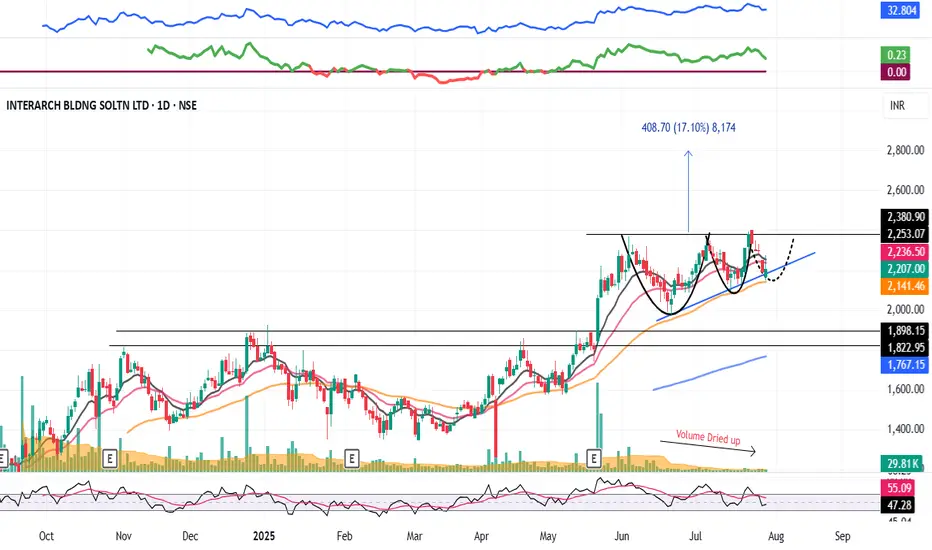
INTERARCH : Swing Pick (1-3 Months)#INTERARCH #vcppattern #chartpattern #ascendingtrianglepattern #breakoutstock #patterntrading #Swingtrading
INTERARCH : This will test Patience
>> VCP formation in process
>> Ascending Triangle forming
>> Breakout candidate
>> Good Strength & Volumes Dried up
>> Trending Stock in consolidation
Swing Traders can lock profits at 10% & Keep Trailing
Pls Comment , Boost and Follow for more such Analysis
Disc : Charts shared are for Learning Purpose and not a Trade recommendation, Consult your Financial advisor or a SEBI Registered Advisor before taking position in it.