PEL : Golden Retracement • Demand Reaction • Risk-Defined Trade📊 PRIMAL ENTERPRISES | 2H STRUCTURE-BASED SWING SETUP
Golden Retracement | Demand Reaction | Risk-Defined Trade
📌 Chart Context & Market Structure
Price has completed a strong impulsive decline from the prior swing high and is now reacting from the Golden Retracement Zone (Fib 50%–78%), which historically acts as a decision area between trend continuation and deeper correction.
This zone also overlaps with a higher timeframe demand pocket, increasing its technical significance.
Key observations from the chart:
Strong bearish impulse followed by slowing downside momentum
Price testing Fib 50%–78% retracement → value re-assessment zone
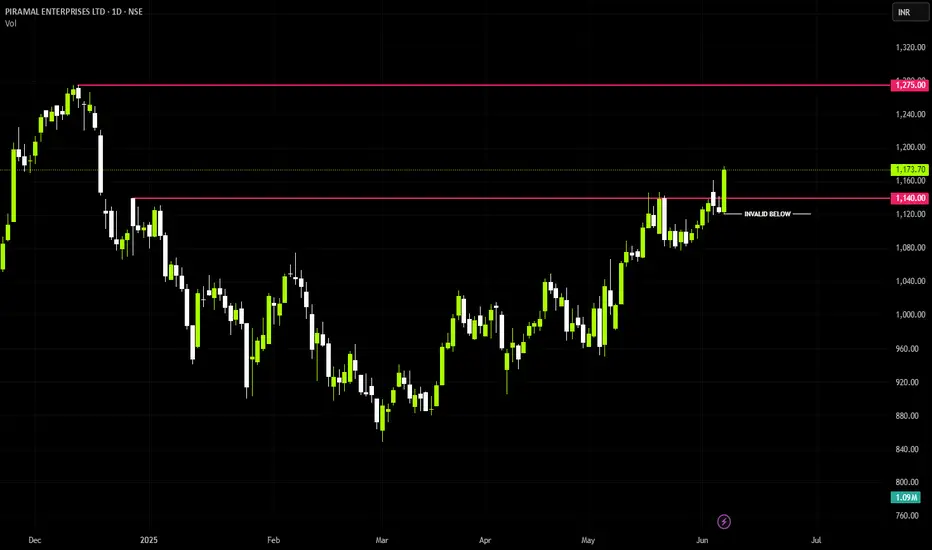
Clear invalidation level marked via hourly close below demand
🔍 Why This Zone Matters (Educational Insight)
📌 The golden retracement zone represents an area where:
Smart money evaluates whether the prior trend is still valid
Late sellers get absorbed by institutional demand
Failed demand here often leads to accelerated downside due to liquidity vacuum
If buyers defend this zone, price usually transitions into a corrective → impulsive recovery.
If demand fails, price seeks the next high-liquidity support below.
📈 Bullish Projection (Primary Scenario)
If price:
Holds above the golden retracement zone
Forms higher lows on lower timeframes
Shows acceptance above the immediate resistance
➡️ Expect a structural recovery phase.
Upside Path (Projection):
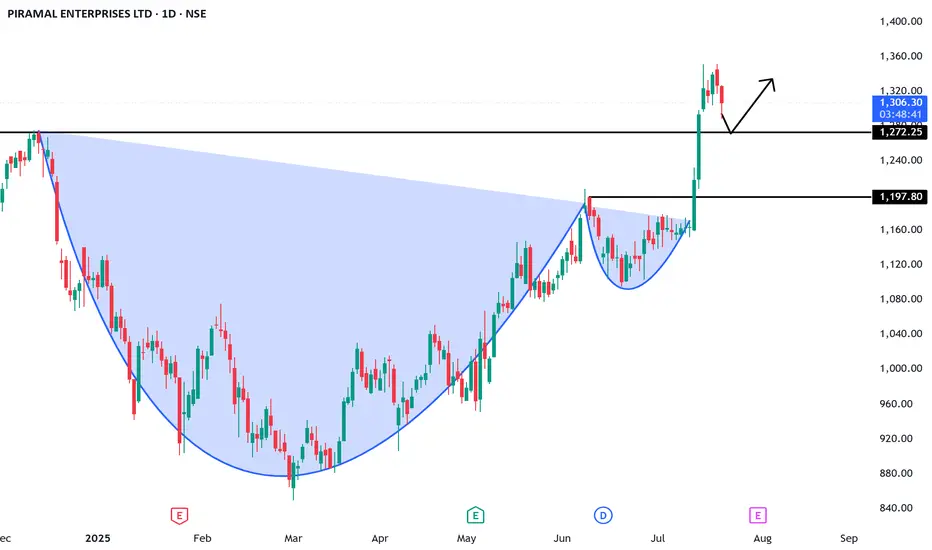
Near-term resistance breakout → momentum pickup
Sustained move above 1,237 confirms strength
Swing expansion toward 1,274 – 1,289 zone
This aligns with a mean-reversion + trend resumption structure.
📉 Bearish Risk Scenario (If Demand Fails)
If price:
Fails to attract buying interest within Fib 50%–78%
Breaks demand with an hourly close below 1,082
📌 It signals demand exhaustion and breakdown of value perception, increasing the probability of a deeper corrective leg toward the next higher-timeframe demand zone below.
This is why risk is clearly defined, not assumed.
🎯 Trade Strategy (Educational, Not Advisory)
Bullish Swing Strategy:
Entry: Demand hold + bullish structure confirmation
Stop Loss: Hourly close below 1,082
Targets: Partial near resistance → Swing target 1,274 – 1,289
Risk Management Logic:
Trade is invalid if demand fails — no hope-based holding
Position sizing based on SL distance
Patience required; no chasing breakouts
🧠 Key Learning Takeaway
📌 When price reacts at the golden retracement:
Acceptance = trend continuation
Rejection = deeper correction
The goal is not prediction — it is preparing for both outcomes with clarity and discipline.
🧾 Conclusion
This setup offers:
Clear structure
Defined risk
Favorable risk-reward if demand holds
Let price confirm. Let structure guide. Let risk stay controlled.
⚠️ Disclaimer
I am not a SEBI-registered analyst. This analysis is for educational purposes only. Please conduct your own analysis or consult a qualified financial advisor before taking any trades.
PLong