GHCL Trading IdeaPennant pattern can be seen on chart. About 4-5 attempts at breaking out. Last 4 sessions have seen consolidation near the upper trendline. Trade may be entered into when there is a breakout with all volumes. Delivery volumes have consistently been above 40%.
Buy above 175
T1 : 203
T2 : 216
SL : 165.50
Thanks!
P.S. The rough time stop loss I set on all my trade is about 20-30% of the time the pattern took to form. Be rest assured regardless of the direction my trading ideas proceed in, I'll update the idea to reflect the same.
Pennant
MARUTI - WHAT TO DO ? Now ??as all auto sectors are running but maruti showing a range moment till now,
if it breaked the upper yellow area then a huge rally will be made what if it breaked the flag trend then a short term downtrend will be there
full analysed chart is on my free VIP group message me to get in, i will freely guide you
.
.
.
happy trading
god bless you all
Indiabulls Housing Finance | RR.= 1:4(Swing / Positional Trade) | RR 1:4+ | Type :- Breakout
Reasons To Trade 🤔 :- Breakout Of = 200DMA + Flag Pattern + Pennant Pattern - Symmetrical Triangle Pattern.
Entry :- 180
Stop Loss :- 172.50
Targets :- 1st= 190 | 2nd= 200 | 3rd= 210
(Risk Must Be Managed.)
Keep Your Eyes On Index
Follow For More 🤝
Give Me A Thumbs Up.. 👍
Comment Below 👨💻
--Any Suggestions--
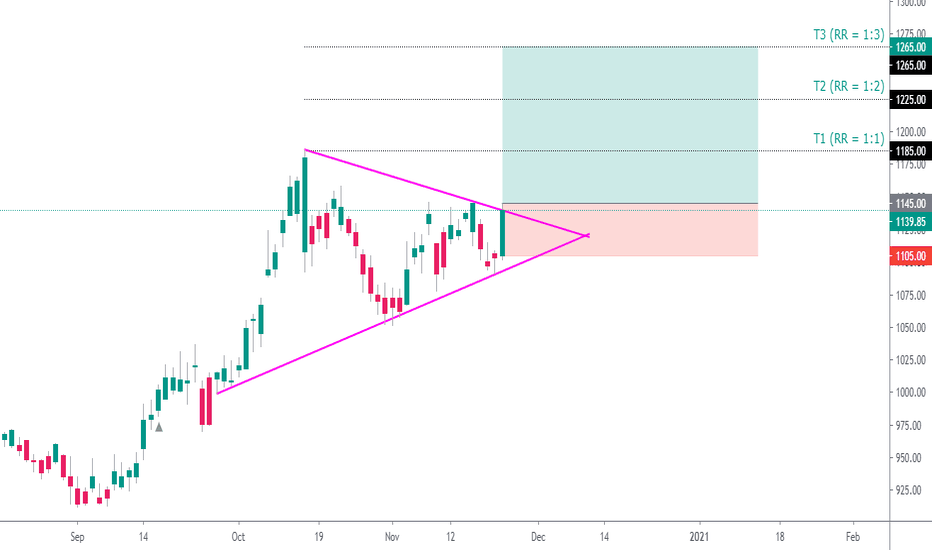
INFOSYS(Swing / Positional Trade) | RR 1:3+ | Type:- Breakout
Reasons To Trade 🤔 :- NIFTY IT(Main Index) + Stock's Triangle Pattern Breakout , Bullish Sector , Uptrend Stock , Above 200DMA.
Entry :- 1145 (Look For Clear Entry)
Stop Loss :- 1105
Targets :- 1stT. = 1185 , 2ndT. = 1225 , 3rdT. = 1265
(Risk Must Be Managed.)
Keep Your Eyes On Index
😜Follow For More ✔
Give Me A Thumbs Up...👍
--Any Suggestions--
TATA CONSUMER Bear Pennant PatternCan you see the Chart is speaking very clear?!
- 38.2% Fib retracement done from the Tops, and the Pennant was Counter trend in nature with a 3 Wave Advance
- On 10th November, we got confirmation to Short, Price also closed below 5 Day EMA and it has turned down sloping now
- Also notice how Price cannot sustain above Anchored VWAP from the Tops
- Price is heading back to 440- 420 on the downside
- Bearish view negates above 520
- Enjoy the Downride and avoid Longs since it was just a Pullback within a Bear trend
AUROPHARMA Getting ready for bull moveAuropharma is getting ready for another bull run.....
Sellers are unable to bring the Price down and buyers are showing that they are buying at every price and will not allow sellers to bring this down.
Closing above 800 will open the Targets for 900+ and then 1000
Trade can be taken with 750 as stop loss because below this Buyers will surrender and may will try to cover there losses.
Pennant pattern in MindTree Pennant pattern in Mind Tree . Wait for good breakout candle to take trade ( Breakout candle should be long body and preferably take trade after retrace in lower time frame)
Disclaimer: All charts are purely for educational and information purpose only. Invest or Trade at your own risk.
MAJESCOLook For Buy (Positional)
Keep Your Eyes On Index
(Risk Must Be Managed.)
Give Me A Thumbs Up...👍
😜Follow For More ✔
--Any Suggestions--
DRREDDY | Straight Flag Pattern Formation | Don't miss it straight FLAG PATTERN it can break either way so be cautious before taking the trade and don't be caught yourself in fake breakout
DON'T forget to check out my previous idea on Drreddy , it worked really well on 4 hrs time frame
Follow & like & comment
JUBILANT FOODWORKS(Swing / Positional Trade) | RR 1:2+ | Type:- Triangle Pre Breakout
Reasons To Trade🤔 :- Above 200 DMA, Stock In Uptrend, Forming Triangle Pattern, Last Candle- Bullish Pinbar (Hammer).
Entry :- 2300 - 2325
Stop Loss :- 2238
Target :- 2500 (It Can Give More) Depends On Market Condation.
(Risk Must Be Managed.)
Keep Your Eyes On Index
😜Follow For More ✔
Give Me A Thumbs Up...👍
--Any Suggestions--


