BankofIndia - Short to Long Term Investment BuyBank of India - Technical Analysis
Current Price: 129.77
Timeframe: Monthly Chart
Key Technical Observations
1. Currently, PSU banks are exhibiting bullish characteristics with positive sector support influencing the stock positively.
2. Cup and Handle Formation - The stock is displaying a gradually developing cup and handle pattern, a classic bullish continuation setup that suggests potential upside momentum.
3. Rising Channel Support - Bank of India is actively trading within and supported by a rising channel, indicating strength in the uptrend structure.
4. Historical Strength Pattern - Over the years since 2021, the stock has been making higher highs and has recently completed a decent retracement, suggesting a bounce-back scenario in formation.
5. RSI Hidden Divergence Confirmation -A hidden divergence has been identified on the RSI indicator, providing additional technical confirmation for trend continuation.
Potential Target Levels
Based on technical analysis:
- 20% Move: 155.40
- 50% Move: 194.70
- 77% Move: 232.00
Risk Management
Strict Stoploss: 99.18 on Weekly candle closing basis
DISCLOSURE & RISK WARNING:
This analysis is provided for educational and informational purposes only and should not be construed as financial advice, investment recommendation, or an offer to buy or sell securities. Past performance is not indicative of future results.
Pennystock

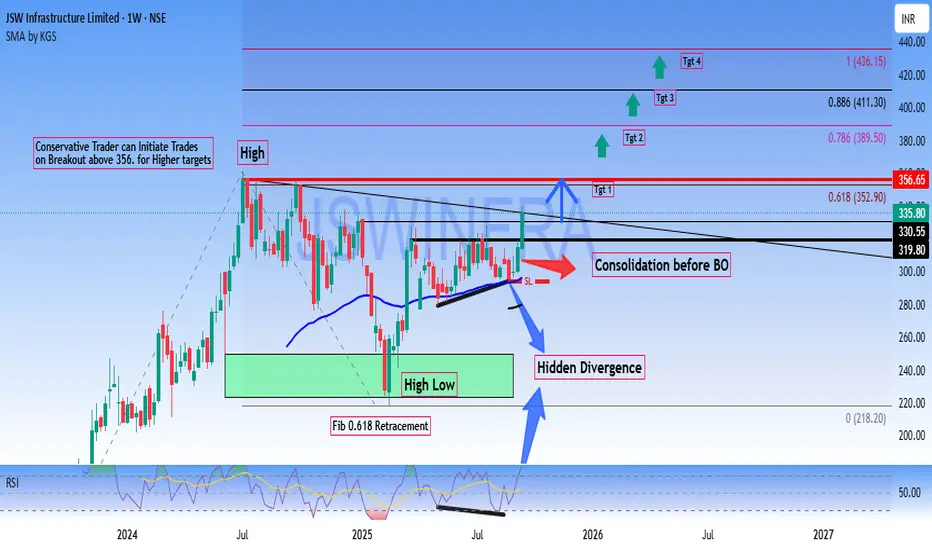
Long JSWINFRA - Short term Investment# JSW Infrastructure Limited (NSE) - Technical Analysis Report
Current Price: 335.80
Key Technical Observations
**Bullish Breakout Setup**
- Breakout Level: Above 356 for conservative trade
Consolidation phase completing before potential breakout (BO) & Stock trading near resistance zone.
Price Targets
- Target 1: 352.90 (0.618 Fibonacci level)
- Target 2: 389.50 (0.786 Fibonacci level)
- Target 3: 411.30 (0.886 Fibonacci level)
- Target 4: 436.15 (1.0 Fibonacci extension)
- Moving Average: SMA showing upward momentum at 296.13
- Fibonacci Retracement : 61.8% level acting as immediate resistance
Chart Pattern Analysis
- Hidden Divergence on the chart suggesting underlying strength
- Consolidation Phase after pullback from 0.618 fib levels and Recent sideways movement indicating accumulation
Risk Management
- Support Level of the recent consolidation low around 280-300 zone
- Stop Loss: Conservative traders should consider stops below 320 on candle close basis.
Conservative Traders:
- Wait for decisive breakout above ₹356 with volume confirmation
- Enter on pullback to ₹340-345 range after breakout
- Target progressive profit booking at mentioned Fibonacci levels
Disclaimer: This analysis is for educational purposes only. Please conduct your own research and risk management before making investment decisions.
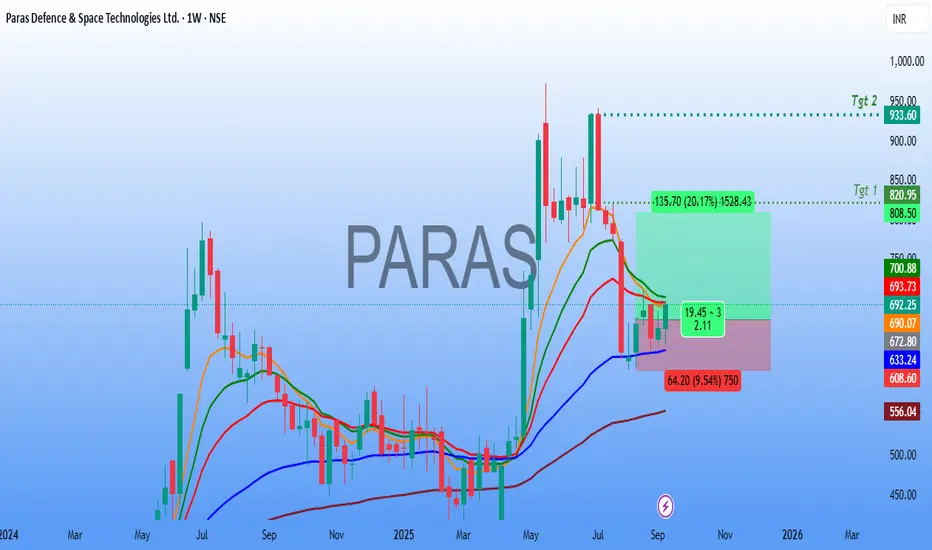
Paras Defence Technical Analysis🚀 Paras Defence & Space Technologies Ltd – Weekly Chart Analysis
The stock is showing signs of a potential reversal after consolidating near key support zones.
🔎 Technical Observations
Price Action:
After a prolonged decline from the highs, the stock has stabilized around the ₹640–660 support region. The recent weekly candle indicates buying interest, with bulls defending key support levels.
Sustained strength above the ₹700 zone can accelerate momentum towards higher levels.
Risk–Reward Setup:
The chart shows a favorable long setup with a potential upside of 20–35%.
📌 Trading Plan
Entry Zone: ₹680 – ₹700
Stop-Loss: ₹640 (weekly close basis)
Target 1: ₹820 – ₹825
Target 2: ₹930 – ₹950
⚠️ Key Notes
The ₹640–650 zone is acting as a strong support; holding this level is crucial for the bullish setup.
A breakout above ₹700 with volume confirmation will strengthen the momentum towards Target 1.
📢 Conclusion
Paras Defence is forming a bullish setup on the weekly timeframe with a good risk-to-reward ratio. If the stock sustains above ₹700, a strong move towards ₹820 and later ₹930+ looks possible. Traders should keep a strict stop-loss at ₹640 to protect capital.
JAYNECOIND | Penny StockDisclaimer: This analysis is for educational purposes only, and I'm not a SEBI registered analyst.
If you found this analysis helpful, I encourage you to like and share it. Your observations and comments are also welcomed below. Your support, likes, follows, and comments motivate me to consistently share valuable insights with you.
🔍 More Analysis & Trade Setups 🔍
For more technical analysis and trade setups, make sure to follow me on TradingView: www.tradingview.com

LongTerm Bullish TATAMOTORSBy Making Higher higher on Monthly Chart, TataMotors entering into another Major Bull run with much higher Targets.
Strong Bullish Stock. Strong Buy on any Major Dips.

Ready to fly (Positional Pick)The stock has given a clean breakout on weekly timeframe with very strong volumes. The pattern looks promising. Wait for a strong closing and enter 10% quantity right away. Then wait for some retracement or consolidation to enter the rest.

#Motherson #Investment PickWait for levels to reach and Price-action shd give confirmation.
Always wait for the right levels to make your investment. Stocks moves irrespective of market sentiment.

#NRAIL Best BuyStock has very good structure. Hope accumulation is over, hoping for the Stock to Blast.
#Swing Stock #shorttermstock #Investment #indianstocks

Longterm Investment NTPCBy Breaking Multiyear resistance and Sustaining above the ATH, Stock confirms the Longterm Bullish contender.
Buy on any decent crassh or Fall, because the stock has made Stronger Structure, which wont faily eassily.

Crisil BuyStock made a Higher High and came down for retracement,
Now its in Consolidation, which is expected to be Accumulation.
In the current market downfall, CRISIL made made a Bullish Pin Bar in Day TF.
Buy will be Active above this PinBar,
Best buy for Swing Trade.

LindeIndia BestBuyStock made a Higher high with Very good volume and Strong Bullish candles.
Now consolidating without much fall in price., which is a clear sign of Bullish Consolidation.
RSI gave clear sign of Entry. Now Price action need to confirm the Entry in weekly timeframe.
Daily timeframe PA is formed. Buy above the Daily Priceaction

#BUY #TNPLTNPL after making a huge Upmove, stock came down for retracement, now at proper buying levels. Maintain the Stoploss. There are two Zones to take entry shown in the charts., Maintain Stoploss on daily candle closing Basis
#swingtrading #shorttermPick

BUY URGOCAP SWING TO SHORTTERM INVESTStock made a huge consolidation and made breakout and now Back to Breakout area for retracement.
Conservative Traders wait for Proper PriceAction and execute your trades.
Always Maintain proper RiskReward. Here Maintain Proper Stoploss based on Daily candle closing Basis.

#tatachemicals Stocks in watchbuy in Small qty., can accumulate later when trend reversal is confirmed. Incase if SL is taken, look for next Strong level at bottom , buy and hold for #Short to #Longterm

ifci swing trade idea for buyprice broken its high and holdng it on above resistance and green candle can give confirmation for 1:2 RR on this . its peeny stock keep this in radar

#Indiamart at proper Buy Zone#indiamart at proper Buy zone. its a buy on dip stock, with the stoploss specified.
Very good #Swing to #shortterm Pick.
Follow proper #risk management with proper diversification of Stocks.

#Escorts #BestBuyStock is at best Demand Zone. At this level it has got good Risk reward.
Good for Swing set up. Target and SL in Charts.
Safe traders Look for PriceAction.

#KSCL #Shortterm Pick#KSCL Stock made a Higher-High, made a rejection from Previous high, currently at the Retracement Point. Buy at decent dip maintaining SL on Daily candle basis.
Good to buy for minimum 15 to 20% returns.

Power of a simple TrendlineAnother Simple Technical Analysis which shows that market is easy and money can be made by doing simple things also.
This Time there is a very simple TRENDLINE drawn in weekly time frame which had worked multiple times and again which has given another opportunity and made a Pin Bar candle at the support of the Trendline.
It seems true that more than 80% is the Psychology (Money management , Position Sizing , Execution and other things) and only around 20% is the SETUP. Because Setup is easy but following it religiously is what a makes a person, TRADER
ENTRY - can be made if it crosses this Pin Bar Candle or can be purchased at the current market price of 6.95 for aggressive trading.
RISK - The Stoploss would be at the low of the same candle on closing basis or whenever it gives a closing before the trendline after crossing this pin bar's High.
Reward - there is major resistance( at price - 10) which has been retested 3 time and there is a high probability that it will go again to retest that resistance.
** Stop loss and Reward has no significance if the Psychology is not strong. Do not hope and just exit at the Stop Loss level and do not greed , just exit at the reward level.
**There are always a lot of opportunities in the market.
#KeepLearning.

hold or long GGENG to get short term target of 30%as per the technical analyze if it sustain at the price of 1.25-1.3 it can then goes up to 1.75-1.8 (30% Growth) here three is liquidity issue but there is not too much risk remain. buy it as per your convince. and also invest in your own research and Annalise.

intraday, swing, short termadd this to your watchlist and wait.
midcap stocks are going to boom.
long term investment; min 70% return
huge potential is there.
investment ;
if you are intrested in investmet, go for it with small risk,
more possibility is there for breakout.

$DIA success is a short race $DIA is responsible for seventy percent of all millionaires. This stock has made more money than all other industrial investments combined. Today's wise young person or wage earner invests their money in $DIA.

$IBO CO-founder to share his results at a global event
The company recently announced that DR Alberto Sola, CO-Founder of Universal Ibogaine, will present his recent findings in the title Ibogaine Hydrochloride and Acute Opioid Detox.
