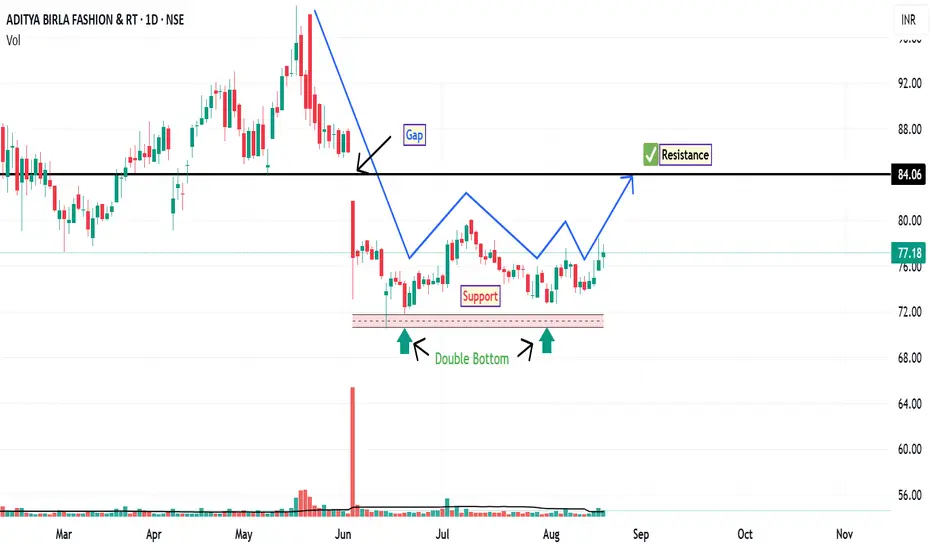
ABFRL: Price Action OverviewFollowing a gap-down opening on June 4, ABFRL entered a consolidation phase, trading within a well-defined supply and demand zone. This range-bound movement suggests a period of accumulation or indecision among market participants. During this consolidation, the stock has formed a double bottom pattern on the daily chart—a classical reversal structure that often indicates a potential shift from a downtrend to an uptrend, provided confirmation follows.
An inverted hammer appeared near the second bottom, signaling potential buying interest at lower levels. This was followed by a bullish pin bar, reinforcing the possibility of a short-term reversal. These candlestick formations, especially when occurring near support zones, can be interpreted as early signs of bullish momentum returning—though follow-through price action is essential.
If bullish momentum sustains than the stock may attempt to fill the gap left from the June 4 session. The gap resistance level is around ₹84 , which could act as a near-term target for traders monitoring this setup.
Disclaimer: This analysis is for educational and informational purposes only. It does not constitute investment advice or a recommendation to buy, sell, or hold any security. Always conduct your own research or consult a licensed financial advisor before making investment decisions.
Pinbarsetup
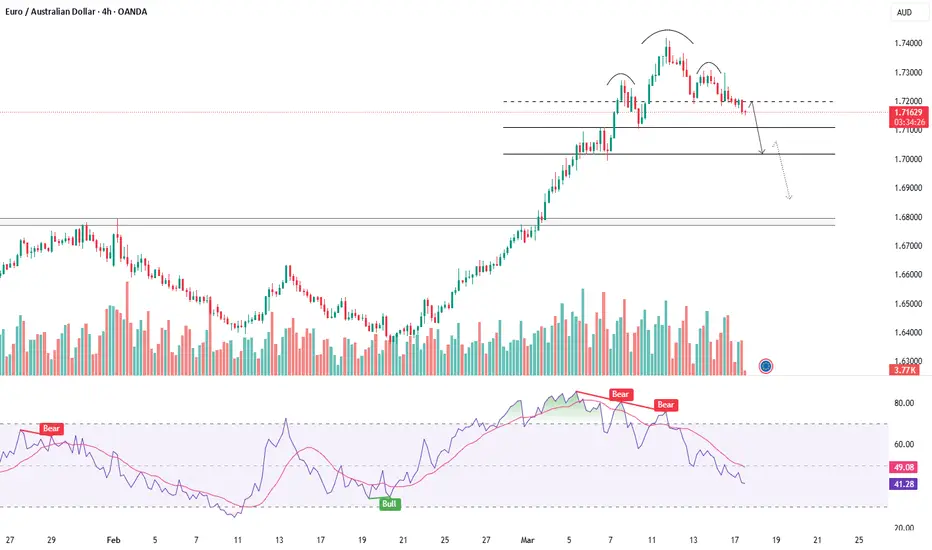
EURAUD - IS THE DOWNTREND ABOUT TO KICK OFF?Symbol - EURAUD
The EURAUD pair is currently testing a key resistance level on the weekly chart. A false breakout has occurred following a liquidity sweep, with no apparent continuation of the bullish trend. Additionally, the chart is displaying a familiar pin-bar reversal pattern.
After the price exited the consolidation range, which was capped by the 1.6787 resistance level, a distribution pattern began to form, targeting liquidity located just above the weekly resistance at 1.7196. This target has now been reached, and the price is consolidating beneath the base of the reversal structure, signaling the potential for further downward movement. There is a likelihood of either liquidation or a downward impulse toward the 1.7100 - 1.7000 zone. The forex market has exhibited a relatively calm demeanor since the week's opening, allowing technical factors to dominate market behavior until fundamental influences come into play.
Key resistance levels: 1.7196, 1.7304
Key support levels: 1.7107, 1.7016
Interest lies in the areas just below the local lows; however, from a technical standpoint, the market is primarily focused on liquidity beyond the 1.6787 level. Given that there are no significant barriers beneath 1.7016, a break of this support would likely open up a clear path towards the next liquidity zone.
GBPCHF 1H, BULLISH signalThis pair bullish trade setup base of support and resistance and pin bar, GBPCHF retest again 1.14620.
STOP LOSS 24 pips
TAKE PROFT 48 pips

Indus Towers taking support + Big bullish candle NSE:INDUSTOWER Indus towers making a big reverse from the support with a heavy bullish candle. Can buy at current levels. SL, TARGET are mentioned in the chart.

TATA STEEL DAILY CHART ANALYSIS 09.12.2021TATA STEEL as per daily chart analysis is still in consolidation zone and today it has formed pin bar candle and resistance at 1190 level. Stock Above 1192 for a target 1250 level.
