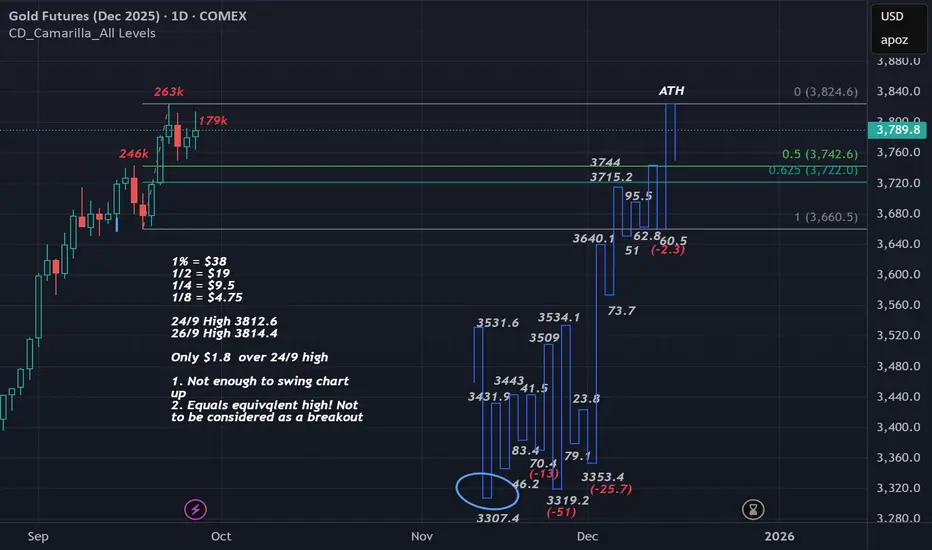
Gold Futures - Daily swing chart has not swung up23/9 High volume 262,918 sign of selling and high of 3824.6
Weekly swing : 200% of previous swing range = 3806.8 which equals $17.8 over resistance level.
Not even 1/2 % over resistance level.
The high volume and doing 200% of previous could be a sign sell off for a reaction to the 50%. We have not even tested the 50% of the daily swing ever lone the test of the weekly 50%.
Friday 26/9 High 3814.4 with lower volume and only $1.8 over the high of 24/9. Note 25/9 was an inside day so this day is ignored for our swing chart and we need to wait for a break of the 24th or see if it sells off.
Pivot Points
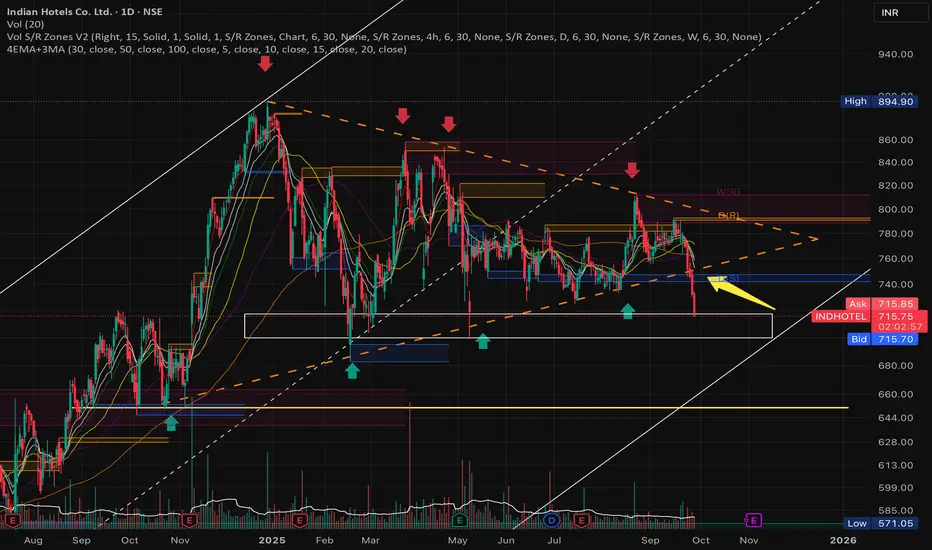
Trend Continuation or Breakdown? Technical Analysis OverviewThe chart has formed a symmetrical triangle pattern, which has taken shape over approximately 270 days. This pattern was recently broken, and a new support level has emerged around 713.
If the 713 support fails to hold, the next potential downside targets are 703, 695, and 685.
However, it's important to note that the stock remains in a broader upward trend, as illustrated by the ascending channel. As long as the price stays within this channel, any pullback toward the lower boundary could present a potential buying opportunity, suggesting a continuation of the uptrend.
Caution:
If the stock breaks below the channel, the current trend structure would be invalidated, and a fresh analysis would be required to reassess the setup.
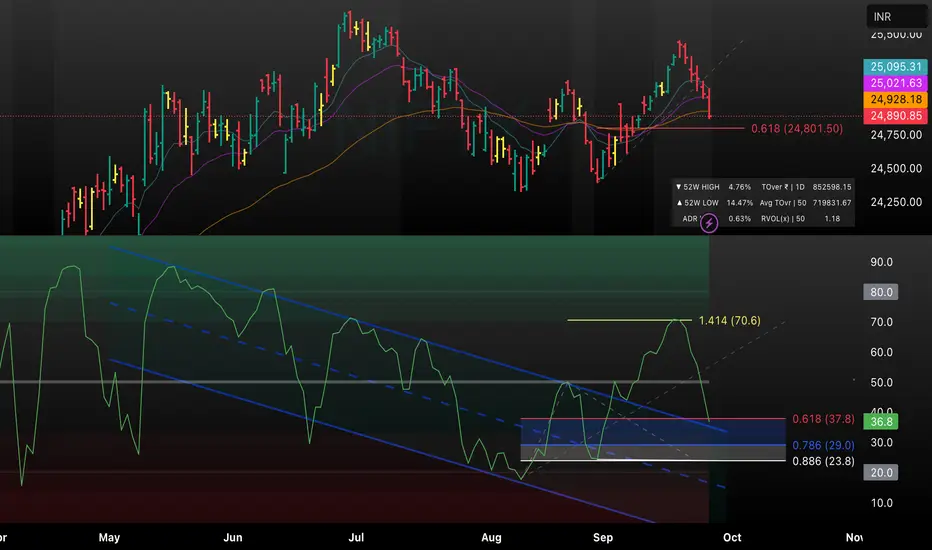
Will Fibonacci Levels Hold? Key Areas to WatchThis chart combines price action with key Fibonacci retracement and extension levels to anticipate potential support or reversal zones. Price is currently testing the crucial 0.618 retracement (24,801.50) after a notable downward move. RSI is also reacting near its own significant levels, aligning with both 0.618 on the downside (37.8) and the 1.414 extension (70.6) on the upside. Watch for reactions at these levels for clues on whether price will bounce or continue to the next fib zone, especially with momentum indicators confirming support/resistance confluence.
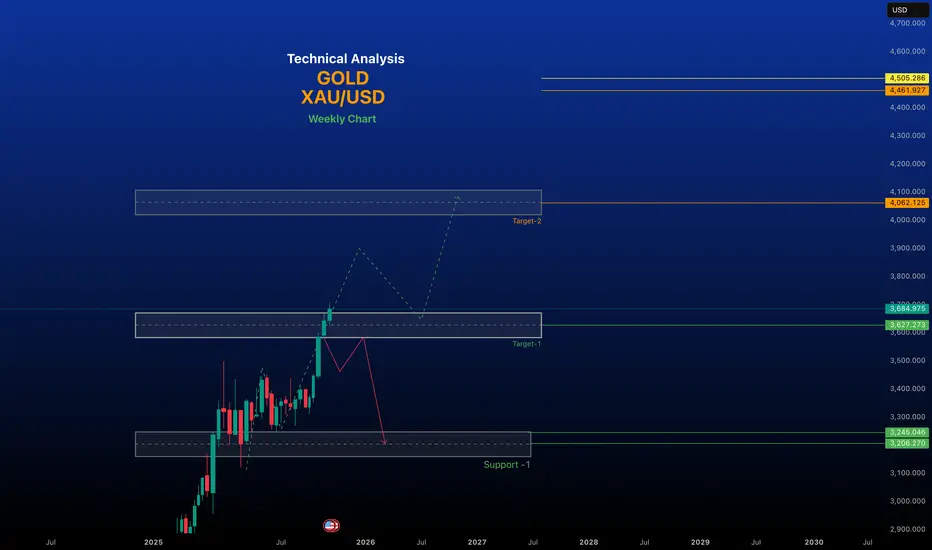
Gold Market Analysis: September 20, 2025Gold (XAU/USD) continues its remarkable bullish run in 2025, driven by persistent geopolitical tensions, central bank buying, a weakening US dollar, and expectations of further Federal Reserve rate cuts. As of today, the spot price stands at approximately $3,685 per ounce, marking a 1.06% increase from the previous day and a staggering 40.47% year-over-year gain. This follows a 26% rise in the first half of the year and nearly 41% year-to-date, with the metal recently touching an all-time high near $3,707 earlier this month. The market remains in a structural uptrend, though short-term volatility—exacerbated by the recent FOMC meeting—has led to some profit-taking and consolidation.
Technical Analysis
Gold's chart on the daily and H1 timeframes shows a bullish bias, with the price trading above key moving averages (50-day MA at $3,520 and 200-day MA at $3,200). The recent pullback from $3,707 appears corrective, testing demand zones around $3,638-$3,644 where buyers stepped in aggressively.Key Support Levels:Immediate: $3,644–$3,638 (recent demand zone; strong buying interest here).
Long term Support and resistance
Support : $3,525–$3,580
Key Resistance Levels: $3,900 - $4,000
Trend Bullish
~~ Disclaimer ~~
This analysis is based on recent technical data and market sentiment from web sources. It is for informational \ educational purposes only and not financial advice. Trading involves high risks, and past performance does not guarantee future results. Always conduct your own research or consult a SEBI-registered advisor before trading.
# Boost and comment will be highly appreciated.
Nifty 50 Analysis as of September 19, 2025~ Technical Analysis ~
Trend Overview: Nifty 50 remains in a broader uptrend, trading within a broken descending channel on the 4-hour chart. It has held above the key psychological support of 25,000 for most of September, but a corrective fall is possible if it breaches 25,250-25,000. Resistance is clustered around 25,400-25,850, with a potential breakout targeting 26,000-26,300.
Key Levels:Support: Immediate at 25,200 stronger at 25,000. A drop below 25,000 could accelerate bearishness toward 24,400-23,500.
Chart for your reference Posted
~~ Disclaimer ~~
This analysis is based on recent technical data and market sentiment from web sources. It is for informational \ educational purposes only and not financial advice. Trading involves high risks, and past performance does not guarantee future results. Always conduct your own research or consult a SEBI-registered advisor before trading.
# Boost and comment will be highly appreciated.

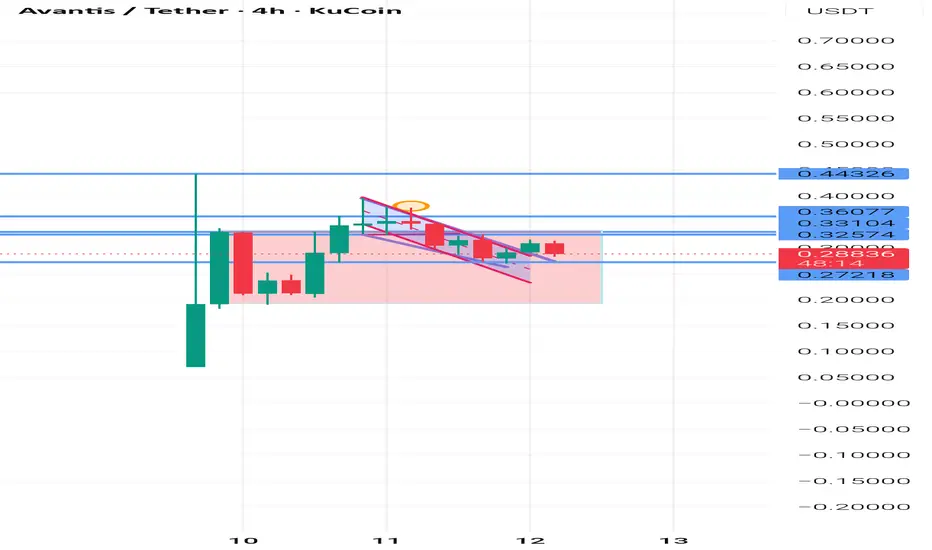
Avantis fi did a nice bullrun and ath is still pending Avantis fi did a nice bull run and looking for liquidity sweep near the 0.27 level and we moon
Expecting a nice ath pump form avantis fi
One of the bet on avantis fi can be done at 0.27 with small stop loss
XAU/USD | 1H | CPI Setup in PlayGold just swept the previous low around 3615 and is showing signs of accumulation. Liquidity below has been taken, and the market structure hints at a bullish delivery if CPI comes in line with expectations.
Key levels:
Demand Zone 3610–3620 where buyers stepped in
First Target 3650 area (mid supply)
Final Target 3685–3690 (major supply/liquidity pool)
Bias: Waiting for a clean internal break of structure and retest before the impulsive move up. CPI data could be the catalyst for this push toward the upper liquidity zones.

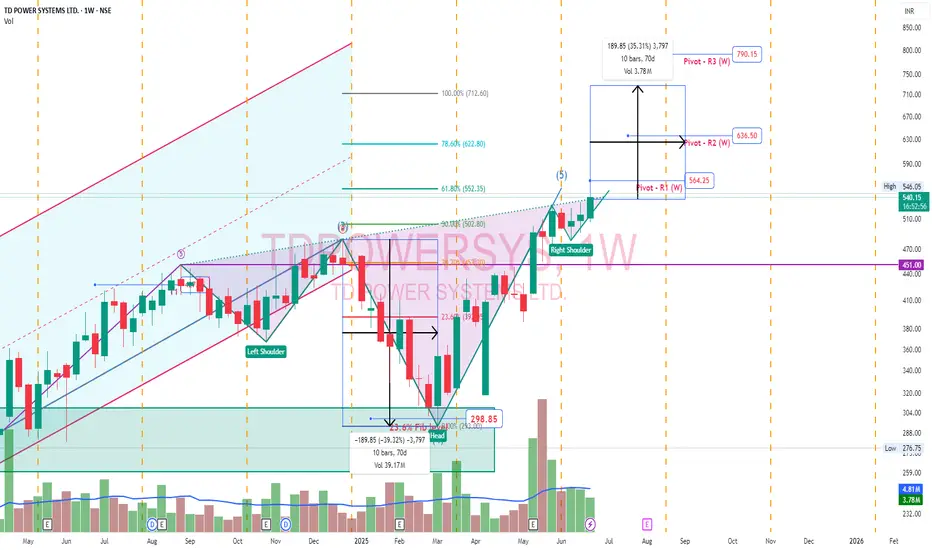
TdPowerSystem - Inverted Head & ShoulderTD Power Systems secured a ₹67 crore export order for traction motor components. This order is for delivery between 2026 and 2027
Inverted Head and Shoulder pattern. Pivot points plotted. Head would be ideal target. Right shoulder low would be long term stoploss.
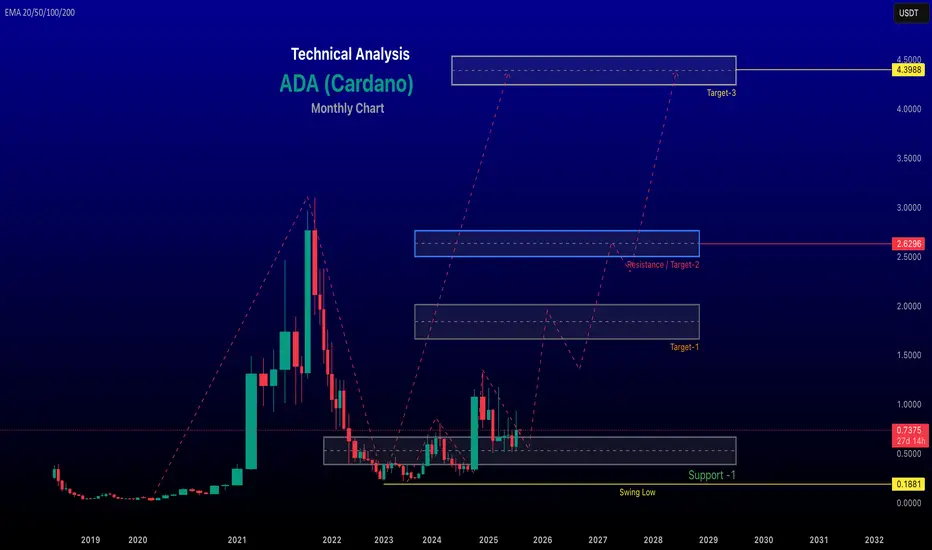
ADA TECHNICALThe current price of Cardano (ADA) in Tether (USDT) is approximately 0.88 USDT, based on recent data from Coinbase. In the last 24 hours, the price has increased by about 3.86%, with a high of 0.89 USDT and a low of 0.83 USDT. Over the past week, the exchange rate has risen by 16.11%, and over the past year, ADA's value has grown by 62.03% against USDT.
Chart For the reference
~~ Disclaimer ~~
This analysis is based on recent technical data and market sentiment from web sources. It is for informational \ educational purposes only and not financial advice. Trading involves high risks, and past performance does not guarantee future results. Always conduct your own research or consult a SEBI-registered advisor before trading.
# Boost and comment will be highly appreciated.

Bank Nifty Weekly Insights: Key Levels & TrendsThe Bank Nifty ended the week at 55,149.40, slipping -0.35%.
🔹 Key Levels for the Upcoming Week
📌 Price Action Pivot Zone:
55,032 to 55,267 – This blue-shaded range is the key area to watch. A breakout on either side could decide next week’s trend direction.
🔻 Support Levels
S1: 54,679
S2: 54,207
S3: 53,739
🔺 Resistance Levels (From Chart):
R1: 55,621
R2: 56,093
R3: 56,564
📊 Candle Observation:
The weekly candle was a strong bearish red candle with both upper and lower shadows. This shows that while bulls attempted a recovery early in the week, sellers overpowered them, pushing the index lower. Buyers did step in at the bottom, but overall the sentiment remains bearish-to-neutral, with resistance pressure visible near the pivot zone.
📰 Sentiment Check (Last Week):
Market sentiment was hit by global uncertainty despite the optimism around the Trump–Putin meeting, which initially gave a positive gap-up.
Profit booking dominated midweek, particularly in banking stocks, dragging Bank Nifty into the red.
The candle reflects caution among traders, with the index struggling to find bullish momentum above resistance levels.
📈 Market Outlook
✅ Bullish Scenario:
If Bank Nifty sustains above 55,267, buyers may gain control, pushing the index toward R1 (55,621), followed by R2 (56,093) and R3 (56,564).
❌ Bearish Scenario:
If the index falls below 55,032, sellers could dominate, leading the index toward S1 (54,679), and potentially to S2 (54,207) and S3 (53,739).
📌 Sentiment Outlook:
The strong bearish candle signals that sellers are still in command. Unless Bank Nifty reclaims and sustains above 55,267, the index may remain under pressure. Supports at 54,679 and below will be critical to watch in the coming week.
Disclaimer: lnkd.in

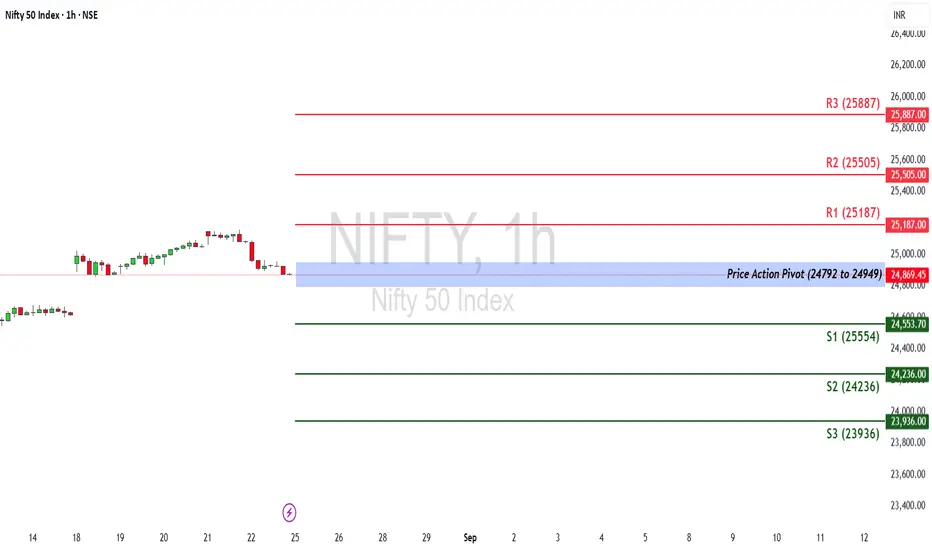
Nifty Weekly Outlook: Holding the Line or Breaking Below?The Nifty 50 ended the week at 24,870.10, gaining +0.97%.
🔹 Key Levels for the Upcoming Week
📌 Price Action Pivot Zone:
24,792 to 24,949 – This is the critical zone to watch. A decisive move beyond either side may dictate next week’s trend.
🔻 Support Levels
S1: 24,553
S2: 24,236
S3: 23,936
🔺 Resistance Levels
R1: 25,187
R2: 25,505
R3: 25,887
📊 Candle Observation:
The last weekly candle formed a red body with a long lower shadow, showing that although bears dominated early in the week, strong buying support emerged near the lows. This wick-based recovery signals demand at lower levels, keeping the support zones (24,553–24,236) important for the coming sessions.
📰 Sentiment Check (Last Week):
The Nifty opened the week with a gap-up, supported by global cues and positive sentiment around the Trump–Putin meeting, which was seen as a potential step toward easing geopolitical tensions.
However, mid-week profit booking dragged the index down, before buyers stepped back in from lower supports, leaving a long lower wick on the weekly candle.
This shows underlying resilience, though the market remains sensitive to global political developments.
📈 Market Outlook
✅ Bullish Scenario:
If Nifty sustains above 24,949, buying momentum could build, aiming for R1 (25,187). A strong breakout above this may push prices towards R2 (25,505) and R3 (25,887).
❌ Bearish Scenario:
If the index breaks below 24,792, selling pressure may return. This could drag Nifty towards S1 (24,553), and further down to S2 (24,236) and S3 (23,936).
📌 Sentiment Outlook:
Nifty is showing resilience with support at lower levels, but for a strong bullish confirmation, it needs to sustain above the 24,949 pivot zone. Global cues, especially political events, may continue to influence short-term moves.
Disclaimer: lnkd.in
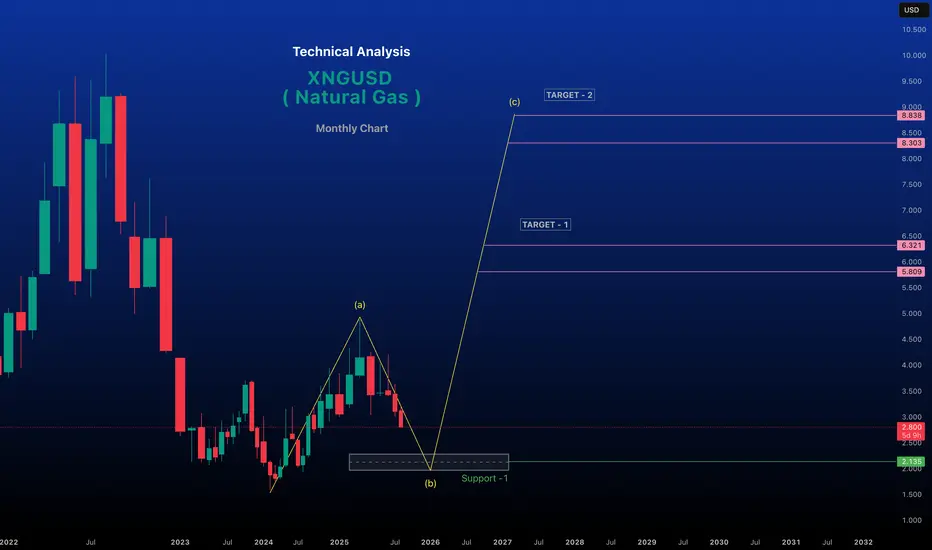
Natural gas analysis Monthly Time frameNatural gas markets are influenced by a complex interplay of supply, demand, weather, geopolitical events, and technical factors. Below is a concise analysis based on recent trends and data as of August 24, 2025, covering key aspects of the natural gas market
Price Trends and Market Dynamics
Spot and Futures Prices: The Henry Hub spot price recently fell from $2.92/MMBtu to $2.81/MMBtu, and the September 2025 NYMEX futures contract dropped from $2.828/MMBtu to $2.752/MMBtu. The 12-month futures strip (September 2025–August 2026) averaged $3.501/MMBtu, reflecting a bearish near-term outlook but expectations of tighter balances later.
Supply and DemandSupply: U.S. natural gas production has risen, with a 3% increase in marketed production in 2025, particularly from the Permian (2 Bcf/d), Haynesville, and Appalachia (0.9 Bcf/d each). However, production is expected to stabilize in 2026 as associated gas from oil declines.
Storage: U.S. storage inventories are projected to reach 3,927 Bcf by October 31, 2025, 174 Bcf above the five-year average, due to higher-than-average injections (20% above the five-year average). This surplus is pressuring prices downward.
Demand: Cool weather forecasts for August 2025, potentially the coolest in 50 years, have reduced demand, contributing to bearish price sentiment. However, LNG exports are rebounding, with Freeport LNG operations resuming, providing some support.
LNG Exports: Maintenance at U.S. LNG terminals earlier in 2025 reduced exports, but recovery and new contracts (e.g., ConocoPhillips’ 4 Mt/y from Port Arthur LNG Phase 2) signal growing export potential.
Technical AnalysisBearish Signals: Technical indicators suggest a "strong sell" for Natural Gas Futures across multiple timeframes (daily, weekly, monthly), driven by a head-and-shoulders pattern with prices breaking below the $3.050 neckline, targeting $2.220–$2.000.
Indicators: RSI, MACD, and stochastic oscillators indicate oversold conditions, but negative momentum persists below key resistance levels like $3.100–$3.320. Pivot points and moving averages reinforce bearish trends, with potential support at $2.200.
Geopolitical and Structural FactorsEurope: The 2022–2023 Russian supply shock shifted Europe to rely on LNG, increasing price volatility. Market reforms have boosted trading volumes (7,300 bcm in 2024, 15x demand), but derivatives trading by physical players dominates, limiting speculative impacts.
Weather Impact: Cooling in the Midwest and Northeast (highs of 60s–80s°F) contrasts with hotter conditions elsewhere (80s–100s°F), driving regional demand differences. Weather models (ECMWF, GFS) forecast continued impacts on heating and cooling degree days, affecting prices.
Energy Transition: Natural gas is increasingly vital for electricity generation as coal phases out, linking gas and power markets and amplifying price sensitivity to weather and demand.
Forecast and OutlookShort-Term (1–6 Weeks): Bearish due to high storage, weak demand from cool weather, and technical indicators. Prices may test support at $2.220–$2.080,
Long-Term: Growing U.S. electricity demand (31% over 15 years) and constrained global supply (e.g., limited OPEC spare capacity) suggest bullish prospects for natural gas as a reliable fuel.
Trading ConsiderationsRisks: High volatility, weather-driven demand shifts, and geopolitical uncertainties (e.g., Russia-Ukraine tensions) pose risks.
Strategies: Traders may consider short positions targeting $2.80, but oversold conditions suggest caution for potential reversals. Long-term investors might accumulate near support zones ($2.220–$2.080) for 2026 upside.
Data Tools: Monitor EIA storage reports, weather forecasts (NatGasWeather.com), and technical indicators (RSI, MACD) for real-time insights.
Note: Trading involves high risks, and past performance does not guarantee future results. Always conduct your own research.
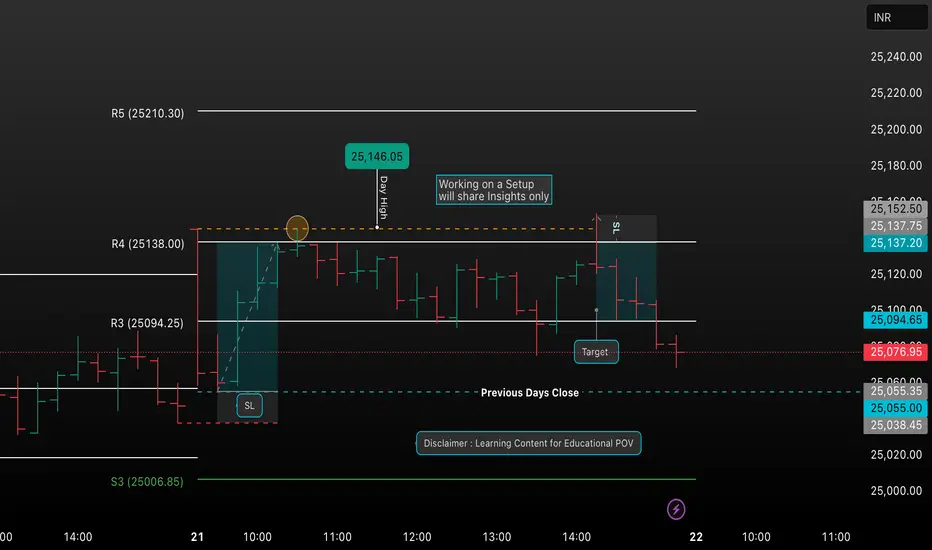
Learn & Trade: Nifty StrategiesDaily Nifty chart setups, insights, and detailed trade ideas. Follow for real-time analysis and educational tips—ideal for new and experienced traders looking to learn disciplined market strategies.”
2. “Sharing structured Nifty setups, key trading zones, and transparent trade planning. Join in for actionable analysis, risk management techniques, and a supportive learning environment for all traders.”
3. “A platform dedicated to simplifying technical analysis and real-world trading. Expect clear charts, honest reviews of trades, and an open community to discuss and improve each other’s strategies.”
You can use or adapt any of these as your TradingView chart post description or as a community introduction. This combination emphasizes your focus on actionable setups, ongoing learning, and engaging with fellow traders.
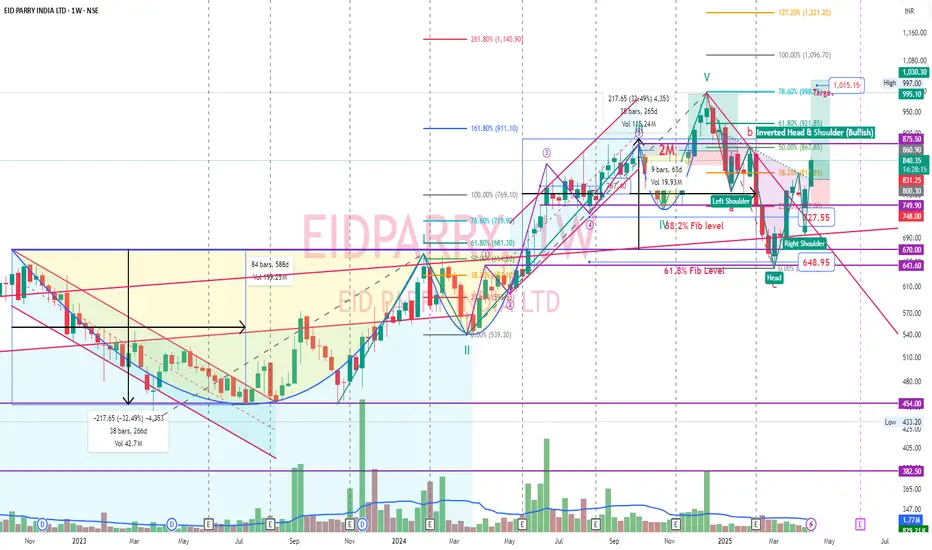
EID Parry - Inverted Head and Shoulder - BullishEID Parry is one of the top fundamental company in sugar industry. And EID parry is among the Murugappa group of companies. One should watch Murugappa group of companies. They are all very good.
Seeking to curb carbon emissions, India aims to increase the share of ethanol in gasoline to 20 percent by 2025-26, from 13 percent -14 percent now. Indian sugar mills such as E.I.D.-Parry Balrampur Chini Mills Shree Renuka Bajaj Hindusthan and Dwarikesh Sugar have increased their ethanol production capacity in the last few years.
After reaching Cup & handle target, stock just completed correction cycle and now made inverted head and shoulder bullish pattern. Head height of 230 points is the target after breakout which comes around 1015 where Pivot R3 also there in daily timeframe.
Weekly RSI has made double bottom and is looking good. MaCD is on the rise. Volume was good on breakout on Apr 15 making inverted head and shoulder bullish pattern in daily timeframe.
Custom Index - Sugar - Inverted H&SMade custom index with sugar after hitting previous targets now inverted head and shoulder in progress. Holding EID parry. Ethanol blending story plays well.
India hits 20% ethanol blending milestone in early 2025—six years ahead of the original target of 2030

renderwithme | ADA Technical Analysis Monthly Chart"Riding the Cardano wave! #ADAUSDT poised for a breakout—targeting $0.81 and beyond! #CryptoTrading"
~ Disclaimer ~~
This analysis is based on recent technical data and market sentiment from web sources. It is for informational \ educational purposes only and not financial advice. Trading involves high risks, and past performance does not guarantee future results. Always conduct your own research or consult a SEBI-registered advisor before trading.
# Boost and comment will be highly appreciated.
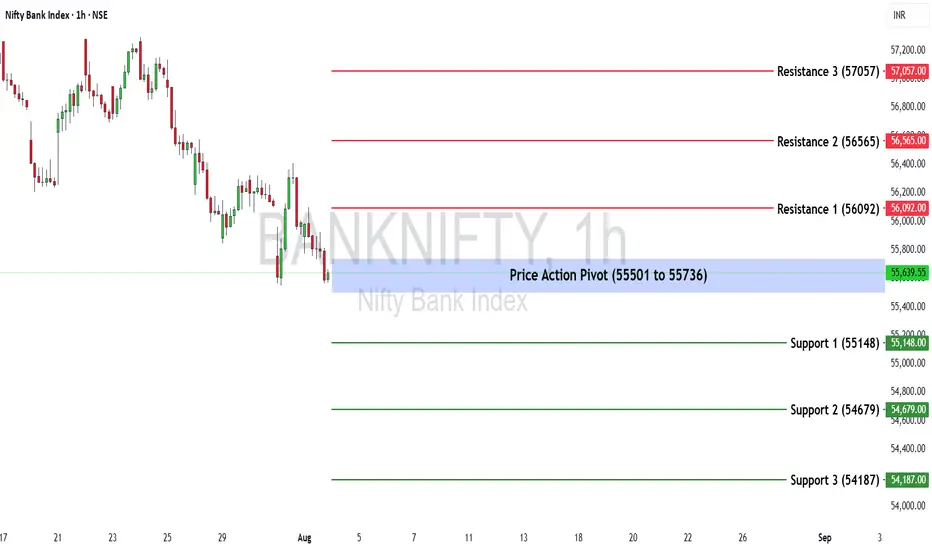
Bank Nifty Weekly Insights: Key Levels & TrendsBank Nifty ended the week at 55,617.60, registering a decline of -1.61%.
🔹 Key Levels for the Upcoming Week
📌 Price Action Pivot Zone:
55,501 to 55,736— This critical range should be monitored for potential trend continuation or reversal. A breakout on either side could determine directional bias.
🔻 Support Levels:
Support 1 (S1): 55,148
Support 2 (S2): 54,679
Support 3 (S3): 54,187
🔺 Resistance Levels:
Resistance 1 (R1): 56,092
Resistance 2 (R2): 56,565
Resistance 3 (R3): 57,057
📈 Market Outlook
✅ Bullish Scenario:
If Bank Nifty sustains above 55,736 (top of the pivot zone), it could trigger buying interest, paving the way toward R1 (56,092), and possibly extending the rally to R2 (56,565) and R3 (57,057).
❌ Bearish Scenario:
A breakdown below 55,501 (bottom of the pivot zone) may invite selling pressure, potentially dragging the index to S1 (55,148) and further down to S2 (54,679) and S3 (54,187).
Disclaimer: lnkd.in
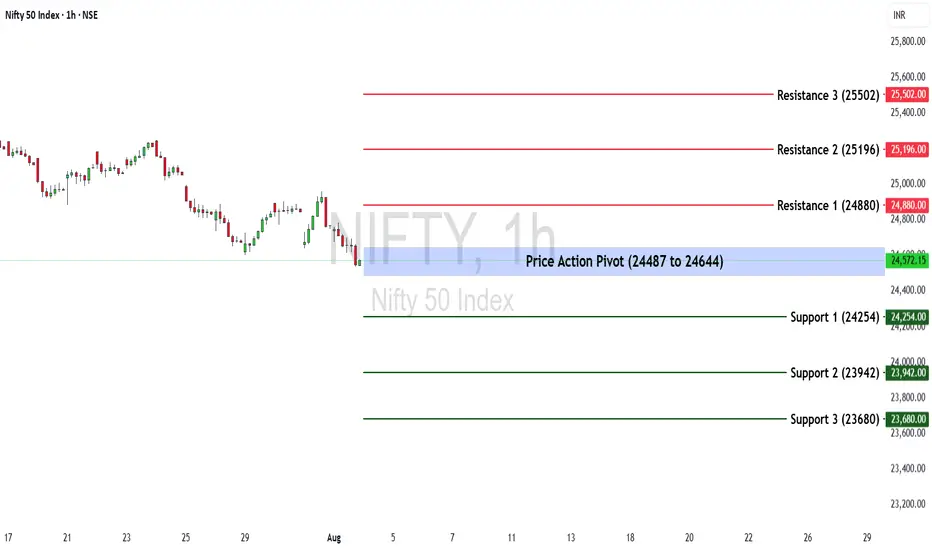
Nifty 50 at a Turning Point? Key Levels & Market Outlook AheadThe Nifty 50 ended the week at 24,565.35, registering a decline of -1.09%.
🔹 Key Levels for the Upcoming Week
📌 Price Action Pivot Zone:
24,487 to 24,644 – This range is crucial for identifying potential trend continuation or reversal. A move outside this zone could set the directional tone for the coming sessions.
🔻 Support Levels
Support 1 (S1): 24,254
Support 2 (S2): 23,942
Support 3 (S3): 23,680
🔺 Resistance Levels
Resistance 1 (R1): 24,880
Resistance 2 (R2): 25,196
Resistance 3 (R3): 25,502
📈 Market Outlook
✅ Bullish Scenario:
A sustained move above 24,644 (top of the pivot zone) may attract buying interest. If this momentum builds, the index could test R1 (24,880), and potentially advance towards R2 (25,196) and R3 (25,502).
❌ Bearish Scenario:
Failure to hold above 24,487 (bottom of the pivot zone) may lead to further downside pressure. In such a case, Nifty may move towards S1 (24,254), and deeper support levels like S2 (23,942) and S3 (23,680).
Disclaimer: lnkd.in
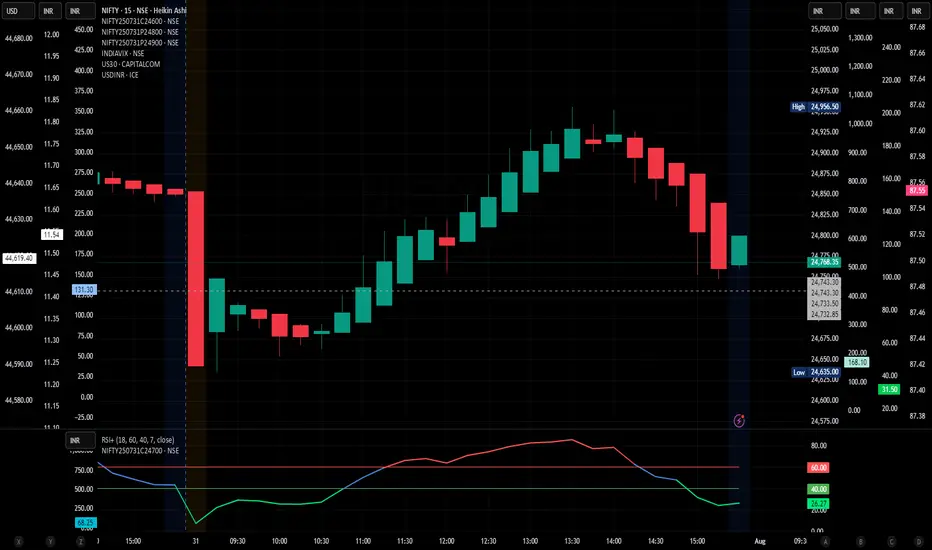
NIFTY 50 Intraday Review – July 31, 2025 | V-Shaped Reversal📉 NIFTY 50 Intraday Review – July 31, 2025 | V-Shaped Reversal & Weak Close
📅 Date: July 31, 2025
📍 Timeframe: 5-minute Heikin Ashi
📈 Indicator Used: RSI (18, 60-40-20 zones)
⚠️ Key Highlights:
Gap-down open near 24,699 due to macro news: U.S. announced 25% tariffs on Indian goods.
Intraday low at 24,635, marking a sharp early fall as sentiment was hit by FII selling pressure.
Market staged a strong V-shaped recovery, peaking at 24,956.50 — almost +300 pts from the low.
From 1:15 PM, profit booking set in and Nifty lost over 180 pts from its high.
Closed at 24,768.35, still down 86.70 pts (-0.35%) for the day.
🔍 Technical Observations:
RSI (18):
Early RSI drop to ~20.31 (oversold zone) triggered bounce.
Midday RSI surged above 68, showing strength in recovery.
By EOD, RSI dropped back to ~20 — hinting bearish divergence.
Heikin Ashi candles:
Strong green candles till early afternoon confirm trend strength.
Series of red candles post-1:30 PM confirms profit-booking / weak close.
📊 Levels to Watch – August 1, 2025
Support Zone Resistance Zone
24,735 / 24,635 24,890 / 24,960
If the index fails to reclaim 24,800+ quickly in the next session, we may see a bearish continuation. Otherwise, a bounce toward 24,900 remains on the cards.
💡 Trading Bias:
🟠 Cautious Bearish
Monitor early session RSI & price action. No long positions unless 24,800 is reclaimed.
📌 #Nifty50 #IntradayAnalysis #HeikinAshi #RSI #PriceAction #FIIoutflow #IndiaMarkets
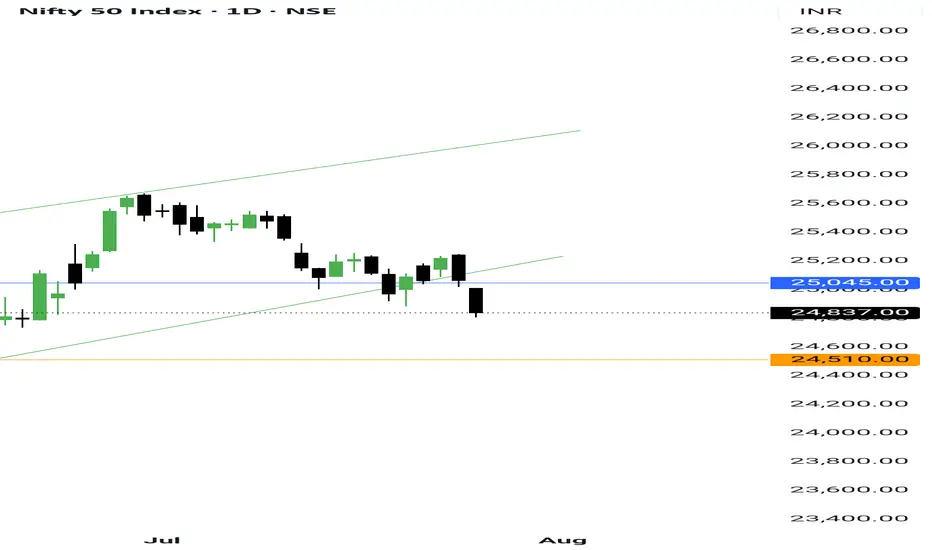
Nifty volatality range expanded - check the levels The market pulled back more than I expected, and now it’s starting to look like a proper correction. But there’s nothing surprising about it — that’s the market’s nature, to surprise you every time.
Nifty has dropped more than 400 points from its recent high this week. On the intraday chart, it closed below the 24839 support on a weekly basis.
With that, Nifty has formed its Decision Range (DR) at 24845 for tomorrow, and the Pivot percentile is 0.19%, which clearly suggests we might see a trending move tomorrow.
Two possible scenarios for tomorrow:
1. If Nifty opens above 24845 and breaks 24908, we might see a bounce due to short covering. However, the probability of this scenario seems low as the market is heavily bearish.
2. If Nifty opens below 24845, trades below it for the first hour, and breaks 24860, it can fall further towards 24710. The final support for this week, as per the chart, should be around 24502. But remember — the market won’t do what you want; it will do what it has to.
Talking about Friday’s session — the candle broke its range, and sellers’ volume was 43 million higher than buyers. Clearly, sellers are still dominating.
For the coming week, the volatility range on the chart is 25047 to 24502.
BankNifty levels:
- Decision Range: 56713
- Weekly Support: 55899
- Resistance: 56791
On the sectoral side, agriculture proxy stocks are showing some excellent setups. One of them, NSE:SHARDACROP , which I traded, gave a solid 19.63% move on Friday.
I am also holding another one from this sector.
And of course, I'm not ignoring my Earnings Pivot setups — because in this kind of market, that’s the only reliable way to generate consistent income.
And when Agri + Earnings Pivot come together — you know how explosive that can be!
That’s all for today.
Take care.
Have a profitable week ahead.
Nifty 50 set to hit 25500
Key Levels to Watch:Support: 24,950 (immediate), 24,800, 24,600–24,400 (stronger supports).
Resistance: 25,000–25,050 (key psychological and technical barrier), 25,200.
Futures: Nifty 50 July Futures closed at 25,025, down 0.6%, with resistance at 25,080–25,100 and support at 24,950
~~ Disclaimer ~~
This analysis is based on recent technical data and market sentiment from web sources. It is for informational \ educational purposes only and not financial advice. Trading involves high risks, and past performance does not guarantee future results. Always conduct your own research or consult a SEBI-registered advisor before trading.
# Boost and comment will be highly appreciated.

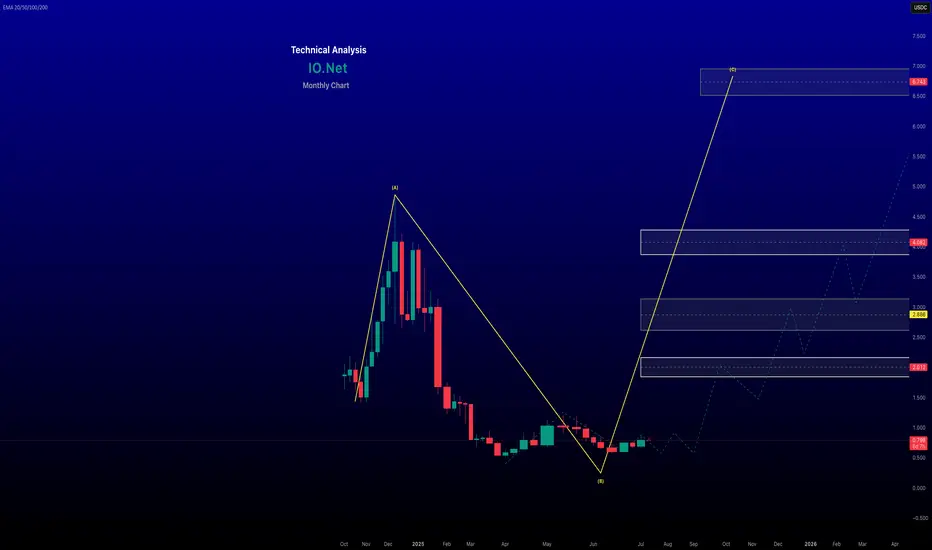
renderwithme | IO.Net Technical Chart for the Next Six Months
Price Prediction for next six Months 2025
Price Range: Based on various forecasts, IO.Net is expected to trade between approximately $0.500 and $1.3 in August 2025. The minimum price could be around $0.400, with a potential peak of $2.
Bullish Scenario: If bullish momentum continues, driven by factors like institutional inflows or positive developments, IO.Net could test the $1 –$2 range or even approach $3 by late August. A breakout and close above $2.200 could trigger a rally toward $3 – $3.8.
Please refer the chart
~~ Disclaimer ~~
This analysis is based on recent technical data and market sentiment from web sources. It is for informational \ educational purposes only and not financial advice. Trading involves high risks, and past performance does not guarantee future results. Always conduct your own research or consult a SEBI-registered advisor before trading.
# Boost and comment will be highly appreciated.
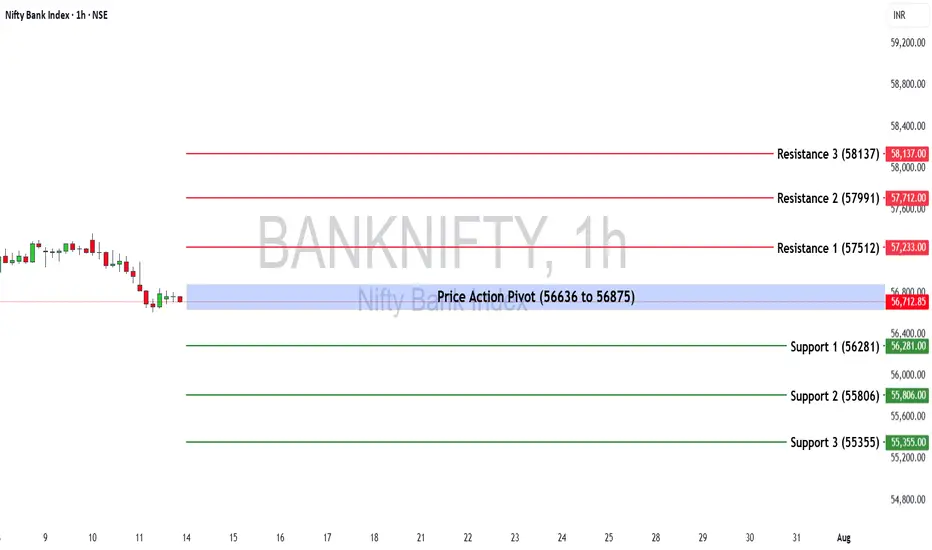
Bank Nifty Weekly Insights: Key Levels & TrendsBank Nifty ended the week at 56,754.70, registering a marginal decline of -0.49%.
🔹 Key Levels for the Upcoming Week
📌 Price Action Pivot Zone:
The critical zone to monitor for potential trend reversals or continuation lies between 56,636 and 56,875.
🔻 Support Levels:
Support 1 (S1): 56,281
Support 2 (S2): 55,806
Support 3 (S3): 55,355
🔺 Resistance Levels:
Resistance 1 (R1): 57,512
Resistance 2 (R2): 57,991
Resistance 3 (R3): 58,137
📈 Market Outlook
✅ Bullish Scenario:
If Bank Nifty sustains above the pivot zone (56,875), it may trigger renewed buying interest, potentially pushing the index toward R1 (57,512) and above.
❌ Bearish Scenario:
A breakdown below the lower end of the pivot zone at 56,636 may attract selling pressure, dragging the index towards S1 (56,281) and further downside levels.
Disclaimer: lnkd.in