Intraday Long Setup | May 28th 2025 | Valid Until Daily ClosePrice is retracing to a strong pivot zone (marked by the red box).
Structure remains bullish with potential for continuation after pullback.
The green box represents a high-probability long opportunity with tight risk control.
Watch for price reaction within the red zone. Entry only if confirmation (e.g., bullish engulfing, strong wick rejections) appears.
The setup expires at end of the daily candle close.
Pivot Points
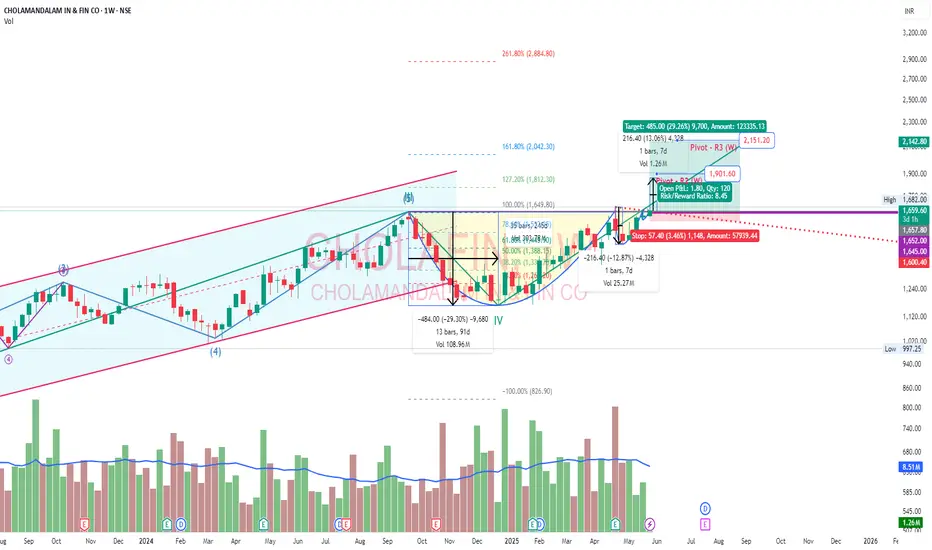
Cholamandalam Finance - Cup & Handle PatternFinance Industry is bullish. Murugappa group of companies are good performers. EID Parry, CG Power, Chola Fin, Chola Holdings, Wendt etc...
Cholamandalam Finance has made cup & handle pattern. 30% potential. 161.8% Fib level, Pivot R3 (W), cup height as target all are in that level. Wave 5 could reach that point.
AAVEUSDT.P | Intraday Long Setup | 26th May 2025Price is retracing into a strong pivot zone (marked by the red box), which acted as a previous resistance and might flip into support.
Structure remains bullish with potential for continuation after pullback.
The green box represents a high-probability long opportunity with tight risk control.
Watch for price reaction within the red zone. Entry only if confirmation (e.g., bullish engulfing, strong wick rejections) appears.
The setup expires at end of the daily candle close.

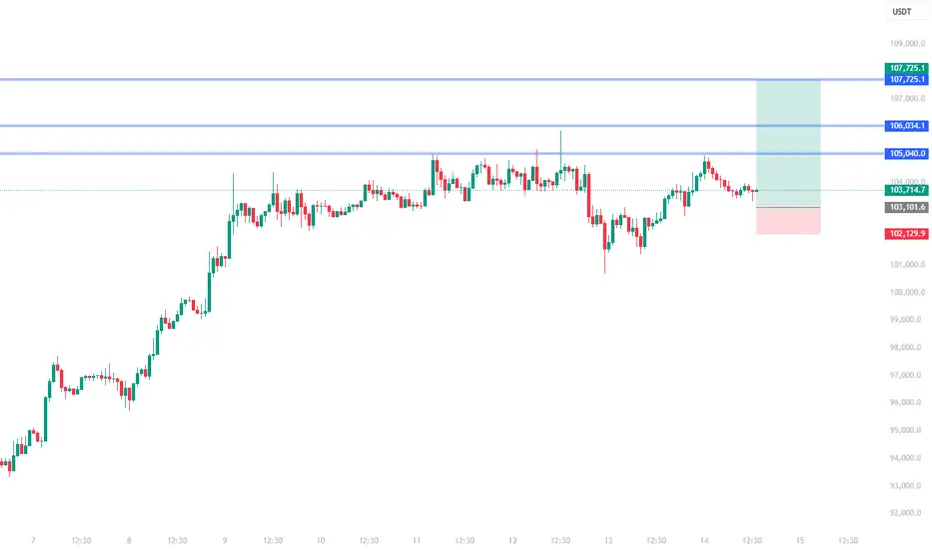
BTCUSDT.P | Intraday Short Setup | 26th May 2025Price is pushing into a key pivot based resistance area (highlighted in red).
Looking for a clean rejection with a 1R move to secure partials, then possible continuation toward lower levels.
Managing risk tightly as structure unfolds.

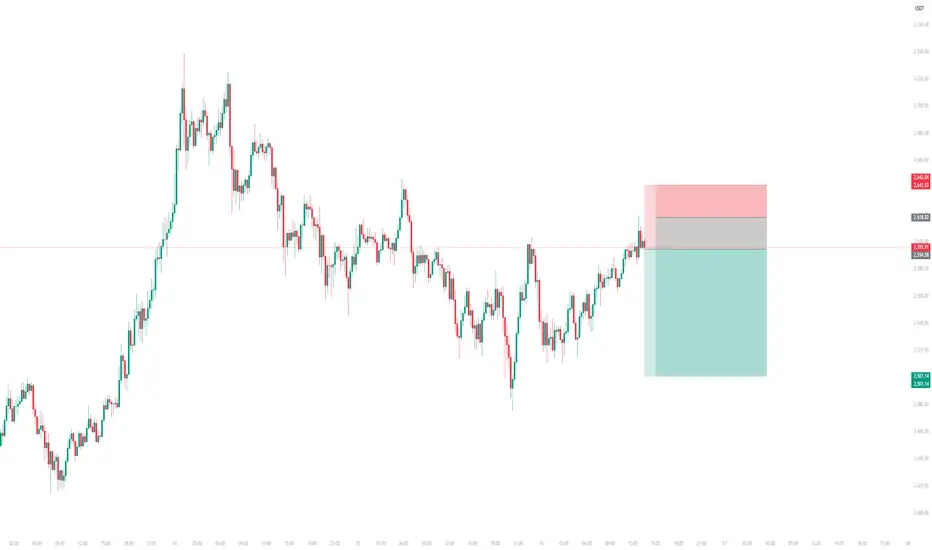
Intraday Short Setup | May 26th 2025 | Valid Until Daily ClosePrice has pushed into a potential intraday Pivot supply zone (red box) where sellers may step in. This trade is based on the expectation of a rejection from this area.
Entry: Red box — a short entry zone aligned with overhead supply
Stop Loss: Above the red zone (invalidates the setup)
Target: Green box — area to consider partial/full exit based on momentum
ETHUSDT has shown a strong bounce but is now approaching a key pivotal resistance zone
Risk-reward is favorable with a tight invalidation and clean downside target
Price may stall or reverse near the red box, creating short opportunity
Note:
This is an intraday trade idea that expires at 00:00 UTC (Daily Candle Close). Re-evaluate the setup if price remains indecisive near the entry zone close to that time.
Intraday Long Setup | Pivot-Based StrategyPrice is retracing into a strong pivot zone (marked by the red box), which acted as a previous resistance and is now flipping into support.
Structure remains bullish with potential for continuation after pullback.
The green box represents a high-probability long opportunity with tight risk control.
Watch for price reaction within the red zone. Entry only if confirmation (e.g., bullish engulfing, strong wick rejections) appears.
The setup expires at end of the daily candle close.
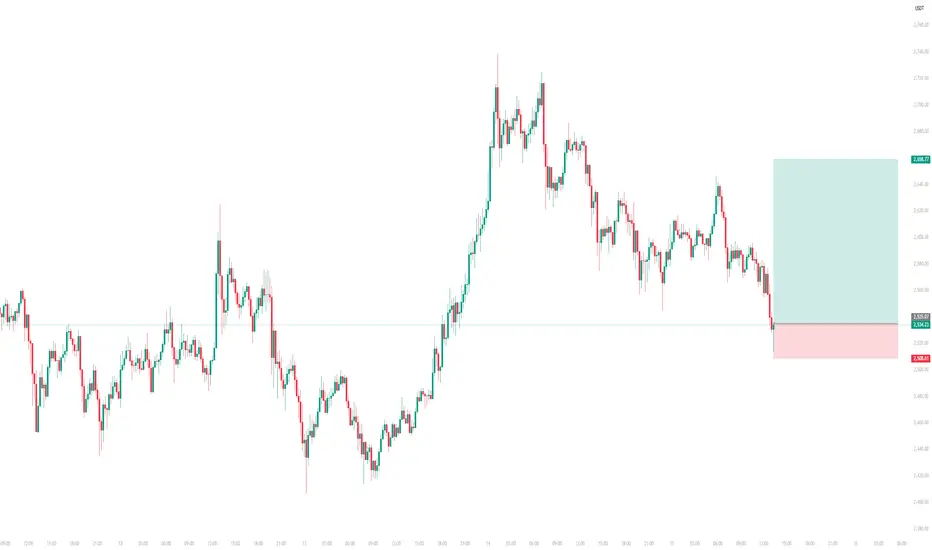
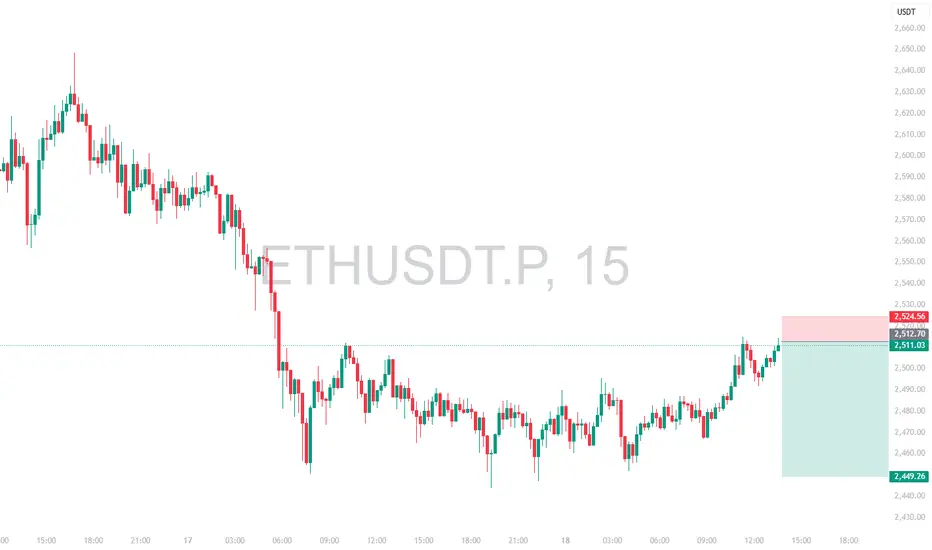
Intraday Long Setup | Trade Valid Until Daily Close | PivotsPrice has dropped into a key demand zone (red box) guided by pivots, where buyers might step in. This setup presents a high-probability intraday long opportunity with clearly defined invalidation and target areas.
Entry Zone: Within the red box — potential demand area where price may react
Stop Loss: Below the red zone (invalidates demand)
Target Zone: Green box — area to consider partial/full exits based on price action
Setup Logic:
Favorable R:R toward overhead supply (green zone)
Structure supports potential short-term reversal
Note:
This trade idea expires at 00:00 UTC (Daily Candle Close) — intraday only, no overnight holding. Reassess if price remains in red zone or shows weakness near close.
Disclaimer - NFA
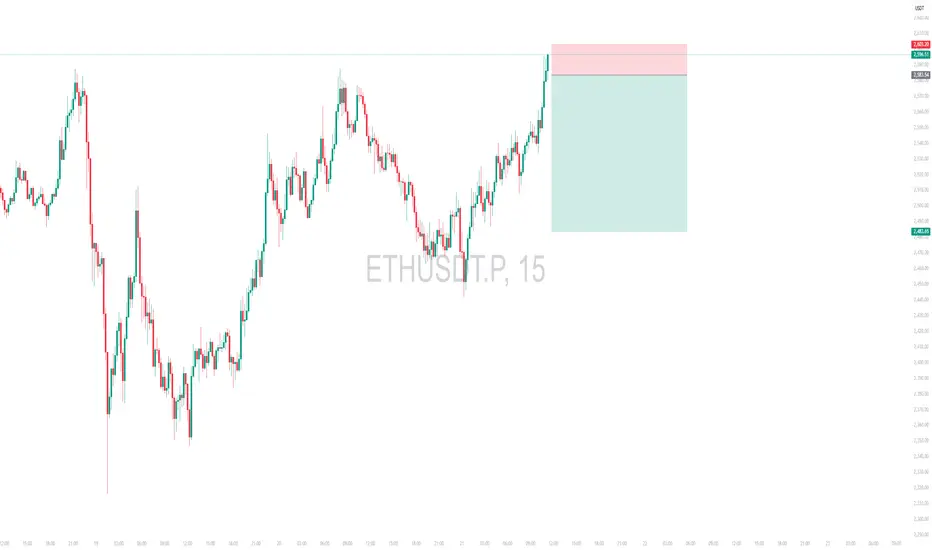
Intraday Short Setup |Trade Valid Until Daily Close (00:00 UTC)This trade idea expires at 00:00 UTC (Daily Candle Close) — intraday only, no overnight holding. Reassess if price remains in red zone or shows strength near close.
Intraday Short Setup | Valid Until Daily Close (00:00 UTC)Price has pushed into a potential intraday Pivot supply zone (red box) where sellers may step in. This trade is based on the expectation of a rejection from this area.
Entry: Red box — a short entry zone aligned with overhead supply
Stop Loss: Above the red zone (invalidates the setup)
Target: Green box — area to consider partial/full exit based on momentum
ETHUSDT has shown a strong bounce but is now approaching a key pivotal resistance zone
Risk-reward is favorable with a tight invalidation and clean downside target
Price may stall or reverse near the red box, creating short opportunity
Note:
This is an intraday trade idea that expires at 00:00 UTC (Daily Candle Close). Re-evaluate the setup if price remains indecisive near the entry zone close to that time.
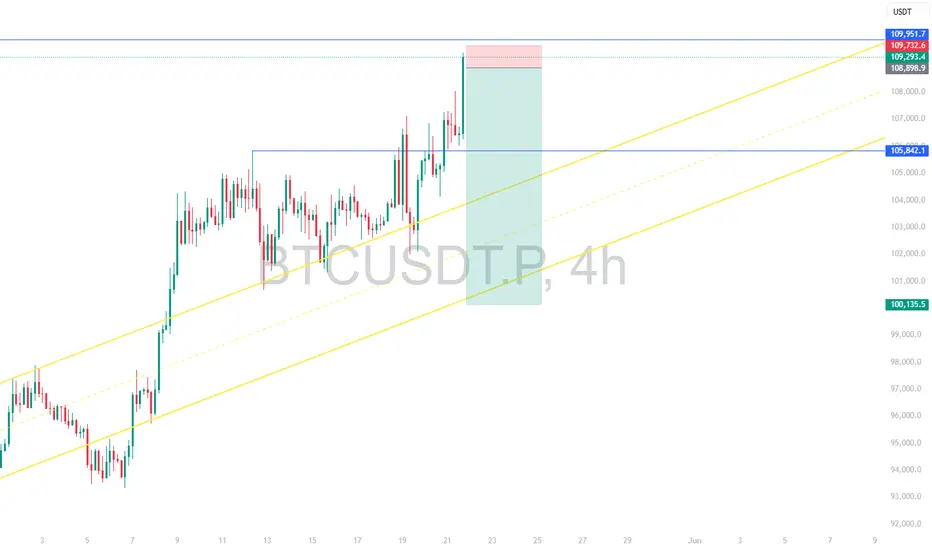
BTCUSDT.P Weekly Short Setup | Pivot-Based StrategyPrice has pushed into a potential weekly Pivot supply zone (red box) where sellers may step in. This trade is based on the expectation of a rejection from this area.
Entry: Red box — a short entry zone aligned with overhead supply
Stop Loss: Above the red zone (invalidates the setup)
Target: Green box — area to consider partial/full exit based on momentum
BTCUSDT has shown a strong bounce but is now approaching a key pivotal resistance zone
Risk-reward is favorable with a tight invalidation and clean downside target
Price may stall or reverse near the red box, creating short opportunity
Note:
This is a swing trade idea that expires at Weekly Candle Close. Re-evaluate the setup if price remains indecisive near the entry zone close to that time.
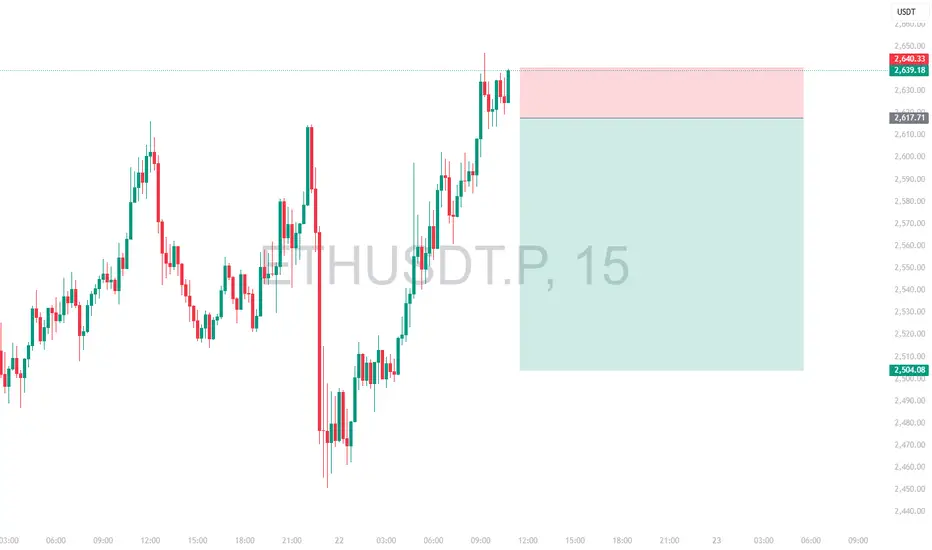
Intraday Short Setup | May 22nd 25 | Valid Until Daily ClosePrice has pushed into a potential intraday Pivot supply zone (red box) where sellers may step in. This trade is based on the expectation of a rejection from this area.
Entry: Red box — a short entry zone aligned with overhead supply
Stop Loss: Above the red zone (invalidates the setup)
Target: Green box — area to consider partial/full exit based on momentum
ETHUSDT has shown a strong bounce but is now approaching a key pivotal resistance zone
Risk-reward is favorable with a tight invalidation and clean downside target
Price may stall or reverse near the red box, creating short opportunity
Note:
This is an intraday trade idea that expires at 00:00 UTC (Daily Candle Close). Re-evaluate the setup if price remains indecisive near the entry zone close to that time.
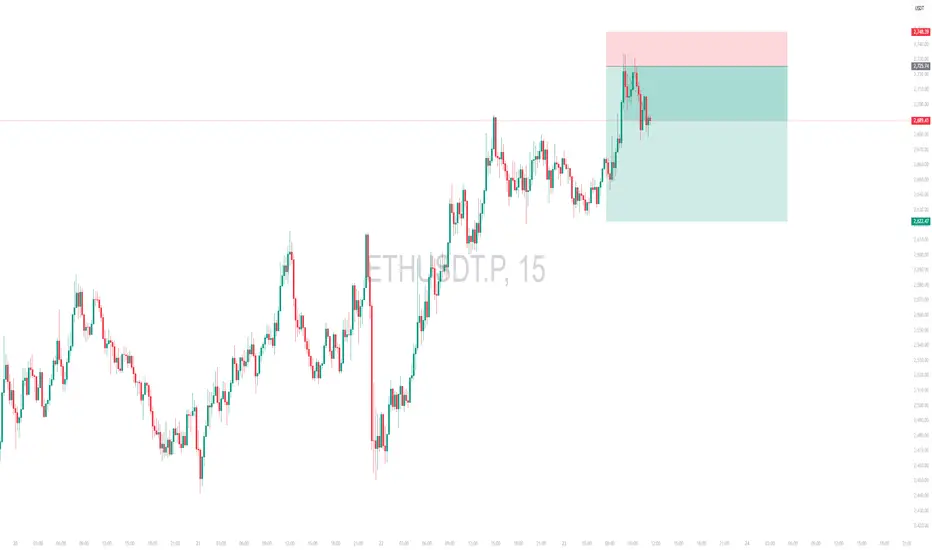
Intraday Short Setup | May 23rd 25 | Valid Until Daily CloseThis is the trade I was looking for but was too early for my day!
Price has pushed into a potential intraday Pivot supply zone (red box) where sellers may step in. This trade is based on the expectation of a rejection from this area.
Entry: Red box — a short entry zone aligned with overhead supply
Stop Loss: Above the red zone (invalidates the setup)
Target: Green box — area to consider partial/full exit based on momentum
ETHUSDT has shown a strong bounce but is now approaching a key pivotal resistance zone
Risk-reward is favorable with a tight invalidation and clean downside target
Price may stall or reverse near the red box, creating short opportunity
Note:
This is an intraday trade idea that expires at 00:00 UTC (Daily Candle Close). Re-evaluate the setup if price remains indecisive near the entry zone close to that time.
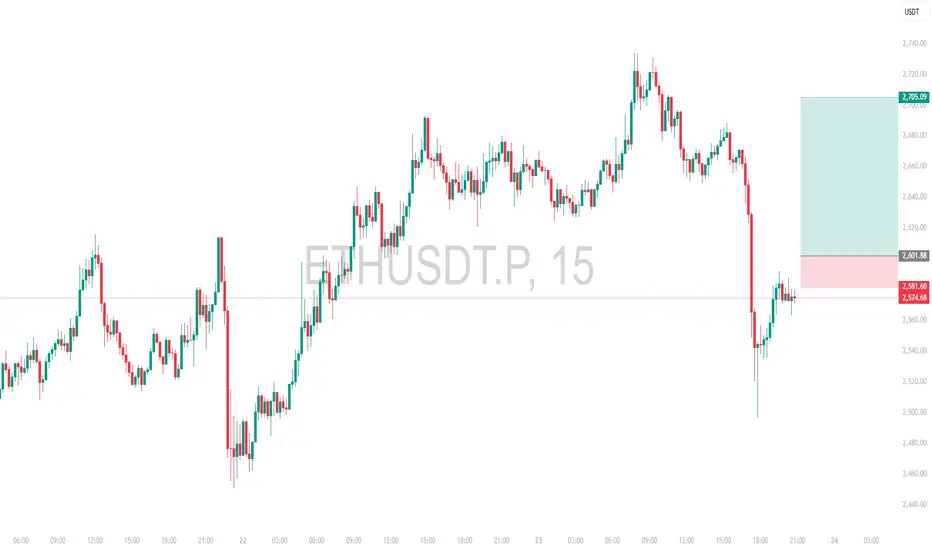
Intraday Long Setup | May 23rd 25 | Valid Until Daily ClosePrice has retraced below a strong pivot zone (marked by the red box).
Structure remains bullish with potential for continuation after pullback.
The green box represents a high-probability long opportunity with tight risk control.
Watch for price reaction within the red zone. Entry only if confirmation (e.g., bullish engulfing, strong wick rejections) appears.
The setup expires at end of the daily candle close.
BTCUSDT.P | Intraday Short Setup | 24th May 2024Price has pushed into a key resistance area (highlighted in red).
Looking for a clean rejection with a 1R move to secure partials, then possible continuation toward lower levels.
Managing risk tightly as structure unfolds.

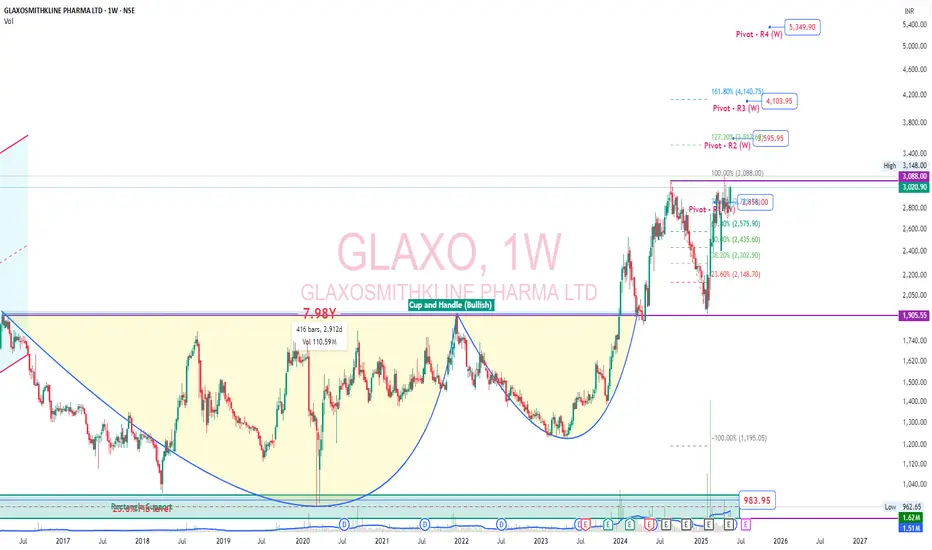
Glaxosmithkline Pharmaceuticals LtdGlaxo - Pharma
FII & DII increased stakes in recent quarter
ROCE, OCF, Reserves, Investments, OPM, PAT⬆️
Inventory days⬇️
V shape recovery, RSI(W) Breakout with 35% potential⬆️
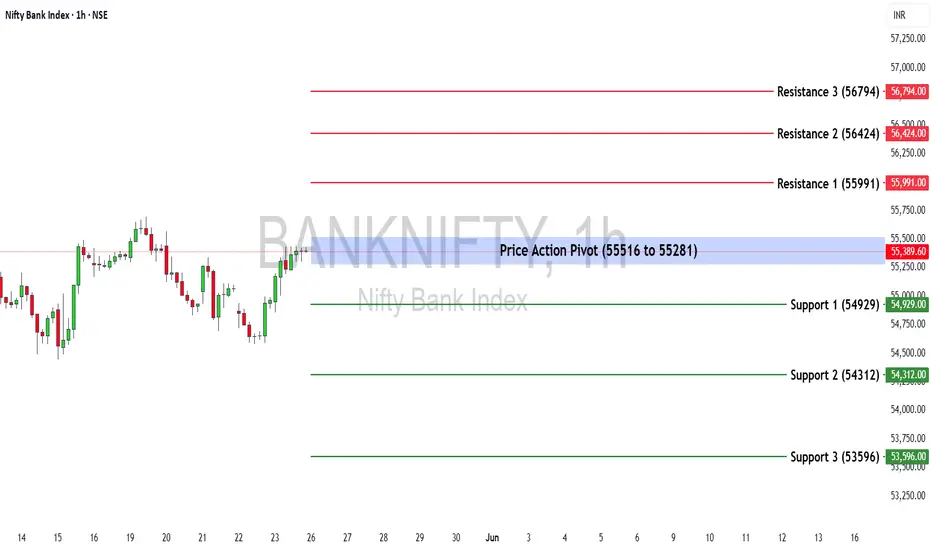
Bank Nifty Weekly Insights: Key Levels & TrendsBank Nifty ended the week at 55,398.25
Key Levels for the Upcoming Week
🔹 Price Action Pivot Zone:
The critical range to monitor for potential trend reversals or continuation is 55,516 to 55,281
🔹 Support & Resistance Levels:
Support Levels:
S1: 54,929
S2: 54,312
S3: 53,596
Resistance Levels:
R1: 55,991
R2: 56,424
R3: 56,794
Market Outlook
✅ Bullish Scenario: A sustained move above 55,516 could trigger buying momentum, potentially driving Bank Nifty towards R1 (55,991) and beyond.
❌ Bearish Scenario: If the index falls below 55,281, selling pressure may increase, pulling it towards S1 (54,929) and lower levels.
Disclaimer: lnkd.in
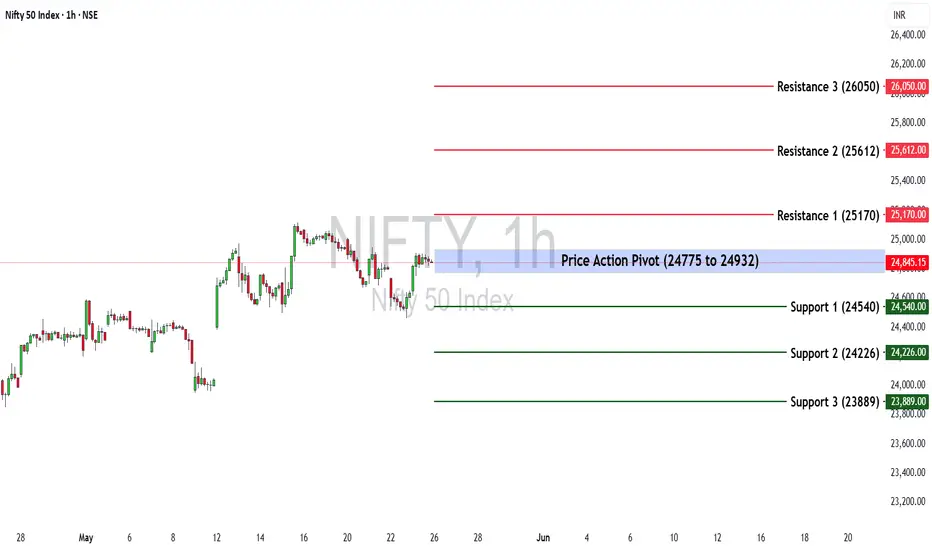
Nifty 50 at a Turning Point? Key Levels & Market Outlook AheadThe Nifty 50 ended the week at 24,853.15 with a loss of (-0.67%)
If Nifty sustains below 24,771, selling pressure may increase. However, a move above 24,932, could restore bullish momentum.
Key Levels for the Upcoming Week
🔹 Price Action Pivot Zone:
The crucial range to watch for potential trend reversals or continuation is 24,775 -24,932.
🔹 Support & Resistance Levels:
Support:
S1: 24,540
S2: 24,226
S3: 23,889
Resistance:
R1: 25,170
R2: 25,612
R3: 26,050
Market Outlook
✅ Bullish Scenario: A sustained breakout above 24,932 could attract buying momentum, driving Nifty towards R1 (25,170) and beyond.
❌ Bearish Scenario: A drop below 24,775 may trigger selling pressure, pushing Nifty towards S1 (24,540) or lower.
Disclaimer: lnkd.in
Intraday Short Setup | May 21st 25 | Valid Until Daily ClosePrice has pushed into a potential intraday Pivot supply zone (red box) where sellers may step in. This trade is based on the expectation of a rejection from this area.
Entry: Red box — a short entry zone aligned with overhead supply
Stop Loss: Above the red zone (invalidates the setup)
Target: Green box — area to consider partial/full exit based on momentum
ETHUSDT has shown a strong bounce but is now approaching a key pivotal resistance zone
Risk-reward is favorable with a tight invalidation and clean downside target
Price may stall or reverse near the red box, creating short opportunity
Note:
This is an intraday trade idea that expires at 00:00 UTC (Daily Candle Close). Re-evaluate the setup if price remains indecisive near the entry zone close to that time.
Nibe Ltd - Defence sector - Cup & Handle formationCompany is engaged in the business of Fabrication and Machining of components used in Defence Sector as well as assembly of components of E Vehicles.
Promoter increased stakes
DII increased stakes
Public shareholding reduced
Reduction in debtor days, inventory days, cash conversion cycle, working capital
Positive Operating cashflow
Low Debt
PE, PB, EV/EBITDA, Mcap/sales all valuations are favourable in comparison with historical valuations.
Company expecting good quarter. Cup and handle formation. Good Breakout candle with volume in daily chart. 35-50% upside potential. Defence sector is already on fire.

INOX WIND LTD – Trend Reversal in Play?After 9 months of sideways consolidation, INOX just broke out of its base near ₹140–180 with strong momentum — signaling the start of a new bullish cycle.
Key Levels:
🔹 Breakout Zone: ₹180.80
🔹 Impulse Target 1 (Hit): ₹261.90
🔹 Next Fibonacci Target (161.8%): ₹343.90
🔹 Support on Dip: ₹211–₹196 (50–61.8% retracement zone)
Pattern in Progress:
🔹 Impulse Wave
🔹 Projected ABC Correction
🔹 Continuation Rally Ahead?
If the correction holds above ₹196 and consolidates, we could see a trend continuation toward ₹340+ in coming months.
Clean structure. Aligned Fibonacci. Momentum is real.
#INOXWIND #TrendReversal #FibLevels #BreakoutStocks #NSEStocks #MomentumTrading #ABCPattern #FibonacciTrading #WindEnergy #IndiaStocks #TechnicalAnalysis #SwingTrade #ChartSetup #BullishTrend #VolumeBreakout #PriceAction

Bank Nifty Weekly Insights: Key Levels & TrendsBank Nifty ended the week at 55,354.90, registering a gain of 3.28%.
Key Levels for the Upcoming Week
🔹 Price Action Pivot Zone:
The critical range to monitor for potential trend reversals or continuation is 55,238 to 55,473
🔹 Support & Resistance Levels:
Support Levels:
S1: 54,886
S2: 54,418
S3: 53,921
Resistance Levels:
R1: 55,828
R2: 56,300
R3: 56,553
Market Outlook
✅ Bullish Scenario: A sustained move above 55,473 could trigger buying momentum, potentially driving Bank Nifty towards R1 (55,828) and beyond.
❌ Bearish Scenario: If the index falls below 55,238, selling pressure may increase, pulling it towards S1 (54,886) and lower levels.
Disclaimer: lnkd.in

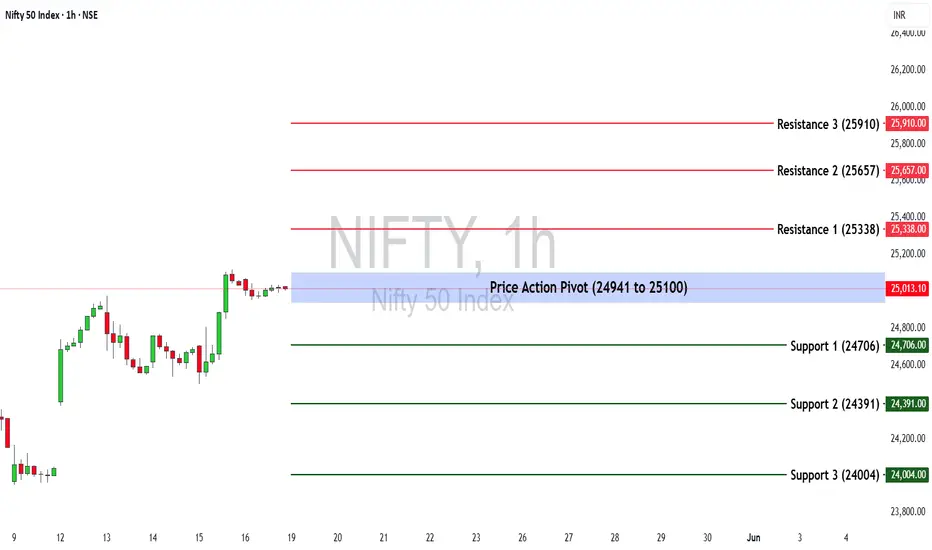
Nifty 50 at a Turning Point? Key Levels & Market Outlook AheadThe Nifty 50 opened with a gap-up of 412.10 points (1.72%) and ended the week at 25,019.80 with a gain of (4.21%)
If Nifty sustains below 24,941, selling pressure may increase. However, a move above 25,100, could restore bullish momentum.
Key Levels for the Upcoming Week
🔹 Price Action Pivot Zone:
The crucial range to watch for potential trend reversals or continuation is 24,941 -25,100.
🔹 Support & Resistance Levels:
Support:
S1: 24,706
S2: 24,391
S3: 24,004
Resistance:
R1: 25,338
R2: 25,657
R3: 25,910
Market Outlook
✅ Bullish Scenario : A sustained breakout above 25,100 could attract buying momentum, driving Nifty towards R1 (25,338) and beyond.
❌ Bearish Scenario: A drop below 24,941 may trigger selling pressure, pushing Nifty towards S1 (24.706) or lower.
Disclaimer: lnkd.in
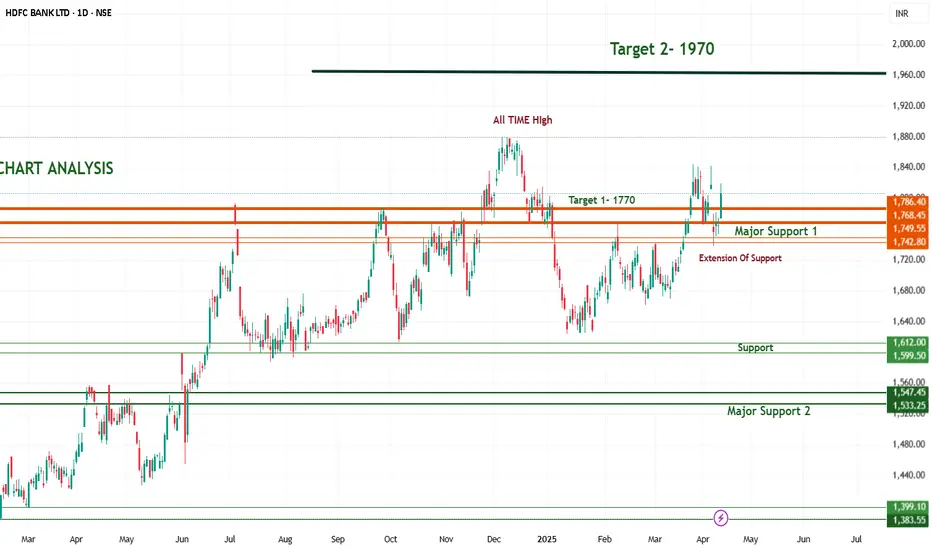
HDFC Bank confirm target 1970 in 2025 HDFC Bank confirm target 1970 in 2025
HDFC Bank's stock presents a potential upside ranging from approximately 9% to 23% over the next year. The bank's strong financial performance and positive analyst sentiments support this optimistic outlook.
Analyst Price Targets for 2025
1. Motilal Oswal: Recommends a 'Buy' rating with a target price of ₹2,050, suggesting a potential upside of approximately 21% from the current price .
2. Prabhudas Lilladher: Maintains a 'Buy' recommendation with a target of ₹2,025 .
3.Trendlyne Consensus: Reports an average target of ₹1,972.27 based on inputs from 12 analysts .
4.TradingView Forecast: Provides a median price target of ₹2,034.19, with estimates ranging between ₹1,627 and ₹2,660 .
All-Time High
The stock made an all-time high slightly above ₹1,900, which acts as a psychological and technical resistance
Overall Market Condition and HDFC bank Trend are Bullish , So It Will Easily Achive Target of 1970 .