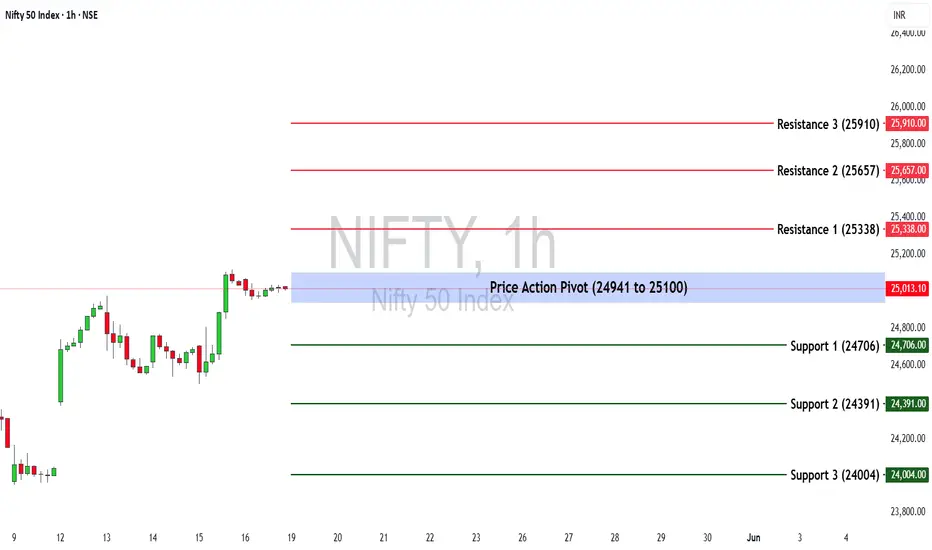
Nifty 50 at a Turning Point? Key Levels & Market Outlook AheadThe Nifty 50 opened with a gap-up of 412.10 points (1.72%) and ended the week at 25,019.80 with a gain of (4.21%)
If Nifty sustains below 24,941, selling pressure may increase. However, a move above 25,100, could restore bullish momentum.
Key Levels for the Upcoming Week
🔹 Price Action Pivot Zone:
The crucial range to watch for potential trend reversals or continuation is 24,941 -25,100.
🔹 Support & Resistance Levels:
Support:
S1: 24,706
S2: 24,391
S3: 24,004
Resistance:
R1: 25,338
R2: 25,657
R3: 25,910
Market Outlook
✅ Bullish Scenario : A sustained breakout above 25,100 could attract buying momentum, driving Nifty towards R1 (25,338) and beyond.
❌ Bearish Scenario: A drop below 24,941 may trigger selling pressure, pushing Nifty towards S1 (24.706) or lower.
Disclaimer: lnkd.in
Pivot Points
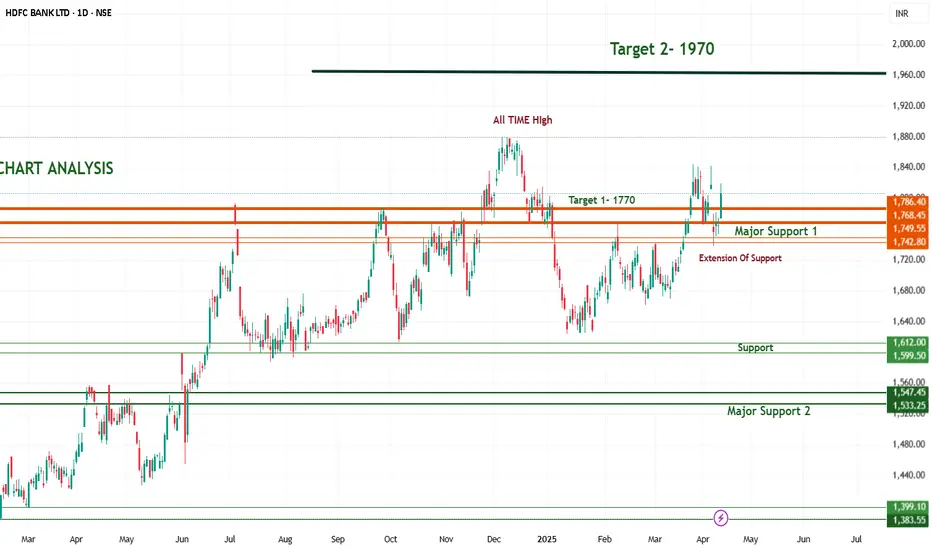
HDFC Bank confirm target 1970 in 2025 HDFC Bank confirm target 1970 in 2025
HDFC Bank's stock presents a potential upside ranging from approximately 9% to 23% over the next year. The bank's strong financial performance and positive analyst sentiments support this optimistic outlook.
Analyst Price Targets for 2025
1. Motilal Oswal: Recommends a 'Buy' rating with a target price of ₹2,050, suggesting a potential upside of approximately 21% from the current price .
2. Prabhudas Lilladher: Maintains a 'Buy' recommendation with a target of ₹2,025 .
3.Trendlyne Consensus: Reports an average target of ₹1,972.27 based on inputs from 12 analysts .
4.TradingView Forecast: Provides a median price target of ₹2,034.19, with estimates ranging between ₹1,627 and ₹2,660 .
All-Time High
The stock made an all-time high slightly above ₹1,900, which acts as a psychological and technical resistance
Overall Market Condition and HDFC bank Trend are Bullish , So It Will Easily Achive Target of 1970 .
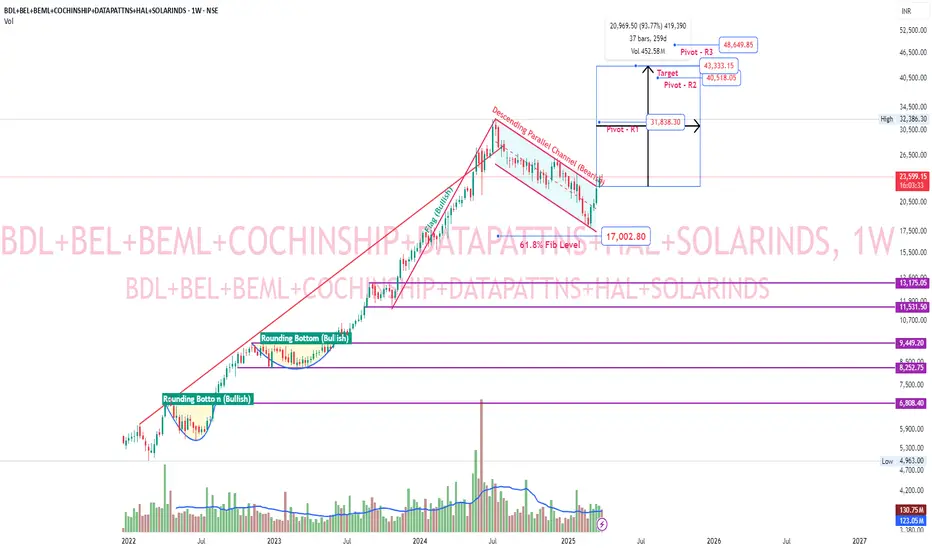
Aerospace & Defence bullish flag breakoutCreated custom index with following scrips. BDL, BEL, BEML, COCHINSHIP, DATAPATTNS, HAL, SOLARINDS. These are some major aerospace-defence companies. This custom index gave a bullish flag breakout. Huge upside potential based on flag pole as target. Pivot R1 itself has approximately 34.5% upside potential.
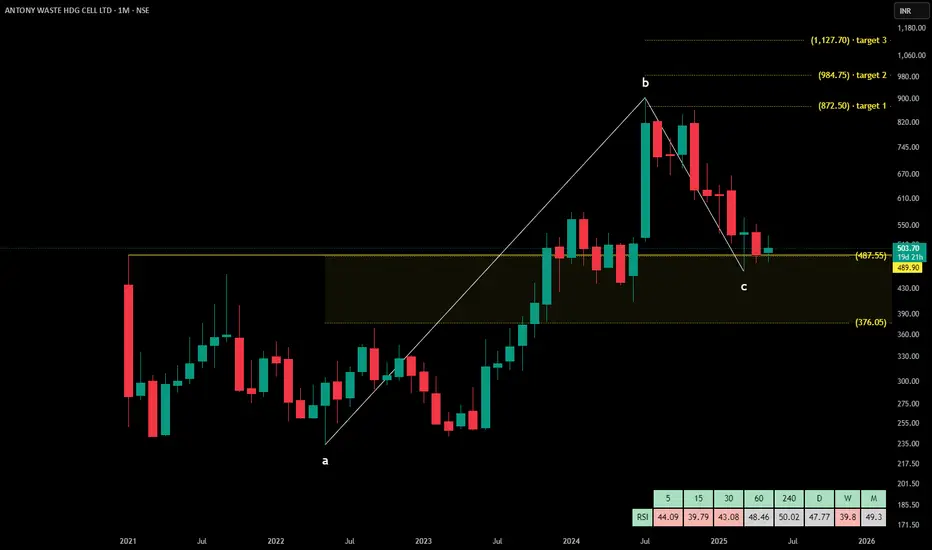
AWHCL technical analysisAntony Waste Handling Cell Ltd. (NSE: AWHCL) is currently priced at INR 503.70. The company specializes in waste management services, including collection, transportation, processing, and disposal of municipal solid waste.
Key Levels
Support Level: INR 487.55
Swing Level: INR 564.10
Possible Upside Levels: INR 628.65, INR 872.50, INR 984.75, INR 1,127.70
Technical Indicators
RSI: The Relative Strength Index (RSI) is currently at 49.30, indicating a neutral market sentiment. RSI values between 30 and 70 typically suggest that the stock is neither overbought nor oversold.
Volume: The trading volume is 844.81K, which shows a significant level of trading activity. Higher volumes often indicate stronger investor interest and can confirm price movements.
Sector and Market Context
Antony Waste Handling Cell Ltd. operates within the waste management sector, which is essential for urban infrastructure and environmental sustainability. The sector has seen steady growth due to increasing urbanization and regulatory pressures for better waste management practices. The overall market trend for the sector is positive, with growing demand for efficient waste handling solutions. However, the stock's performance may be influenced by broader market trends, including economic conditions and investor sentiment towards environmental stocks.
Risk Considerations
Regulatory Changes: Any changes in environmental regulations or waste management policies could impact the company's operations and profitability.
Market Volatility: The stock may be subject to market fluctuations, influenced by broader economic conditions and investor sentiment.
Operational Risks: Challenges in waste collection, transportation, and disposal processes could affect the company's performance.
Competition: The presence of other waste management companies could impact market share and profitability.
Analysis Summary
Antony Waste Handling Cell Ltd. shows a balanced technical outlook with key support and resistance levels identified. The RSI and volume indicators suggest neutral market sentiment and significant trading activity. The company's position within the growing waste management sector provides a positive context for future performance. However, investors should consider potential risks, including regulatory changes and market volatility. Overall, the stock presents a balanced opportunity, with careful consideration of market conditions and company-specific factors.
Polycab - Descending Broadening WedgeCables have good demand. Polycab making bullish breakout from descending broadening wedge pattern and the subsequent targets are 5528.50, 5929.85, 6403.60 and the weekly pivot is at 6494.00. Around this level is 61.8% fib level 6427.55 so there is more supply (selling) in this point.

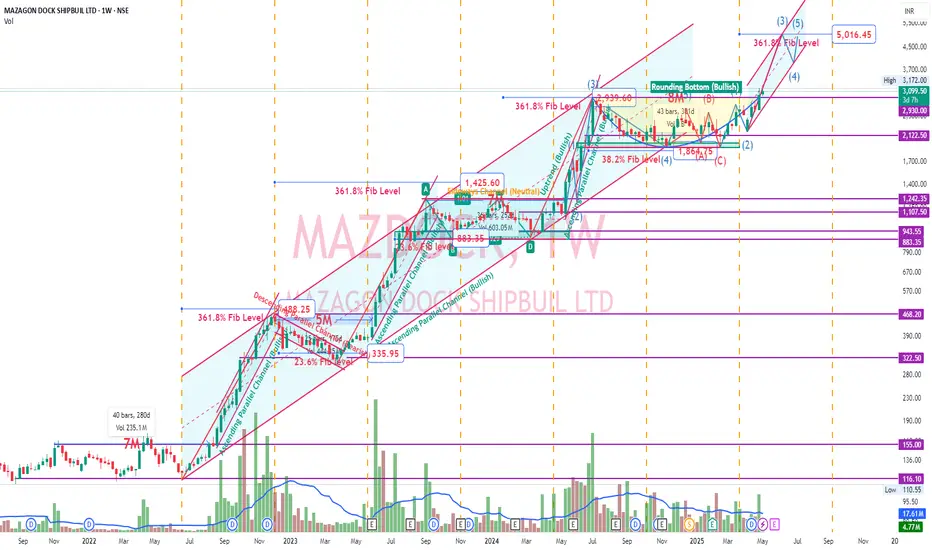
Mazdock - Undocked after 8M Rounding BottomMazdock renowned shipbuilding company has constructed 801 vessels since 1960, including warships, submarines, cargo/passenger ships, and offshore platforms.
Order Book
As of Q2 FY25, the company’s total order book was Rs. 39,872 Cr, which includes 37 vessels scheduled for delivery.
Order Book Mix:
Shipbuilding: 70%
Submarine and Heavy Engineering: 30%
Fundamentals
Company has excellent fundamentals with ROE and ROCE above 20% and increasing. Negative working capital, Debt free, increasing sales and profit with dividend payout of around 29%. Stellar Operating profit margin and rising along with increase in stakes of both DII and FII in recent quarter.
Technicals
On observing the chart, We could witness stock roaring 100% atleast after every consolidation of around 5-8 months. History tend to repeat itself. Fundamentals are good. Overall aerospace and defense sector are in good position. Check that custom index chart which was published. Mazdock has the potential to reach 5K which is 361.8% Fib level. In past, it has always reached that fib level. Pivot R3 is also around 5278.45. We can also see that breakout of rounding bottom pattern has occurred.
Disclaimer: Learning Purpose
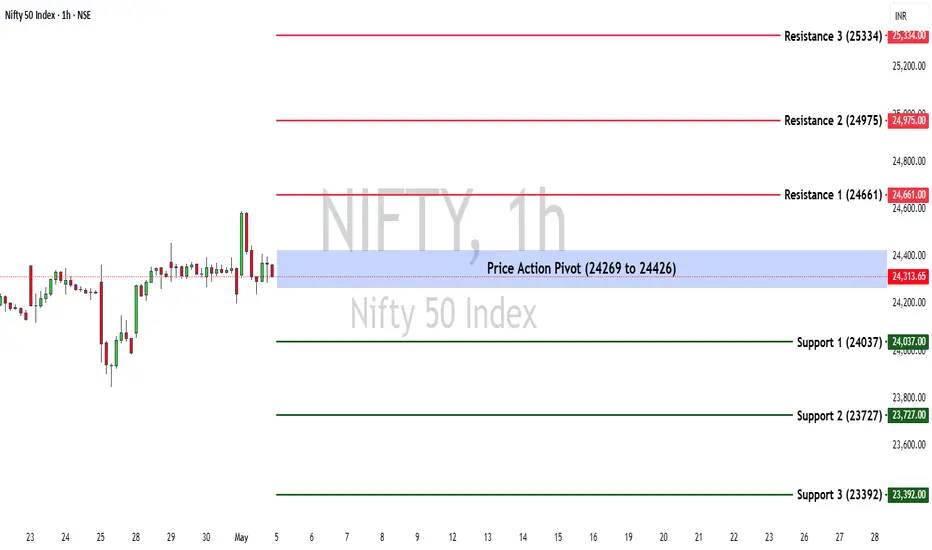
Nifty 50 at a Turning Point? Key Levels & Market Outlook AheadThe Nifty 50 opened with a gap-up of 30.95 points (0.13%) and ended the week at 24,346.70 with a gain of (1.28%)
If Nifty sustains below 24,369, selling pressure may increase. However, a move above 24,426, could restore bullish momentum.
Key Levels for the Upcoming Week
🔹 Price Action Pivot Zone:
The crucial range to watch for potential trend reversals or continuation is 24,369 -24,426.
🔹 Support & Resistance Levels:
Support:
S1: 24,037
S2: 23,427
S3: 23,144
Resistance:
R1: 24,661
R2: 24,975
R3: 25,334
Market Outlook
✅ Bullish Scenario: A sustained breakout above 24,426 could attract buying momentum, driving Nifty towards R1 (24,661) and beyond.
❌ Bearish Scenario: A drop below 24,369 may trigger selling pressure, pushing Nifty towards S1 (24.037) or lower.
Bank Nifty Weekly Insights: Key Levels & TrendsBank Nifty ended the week at 55,115.35, registering a gain of 0.83%.
Key Levels for the Upcoming Week
🔹Price Action Pivot Zone:
The critical range to monitor for potential trend reversals or continuation is 55,018 to 55,253
🔹 Support & Resistance Levels:
Support Levels:
S1: 54,667
S2: 54,200
S3: 53,723
Resistance Levels:
R1: 55,607
R2: 56,078
R3: 56,553
Market Outlook
✅ Bullish Scenario: A sustained move above 55,253 could trigger buying momentum, potentially driving Bank Nifty towards R1 (55,607) and beyond.
❌ Bearish Scenario: If the index falls below 55,018, selling pressure may increase, pulling it towards S1 (54,667) and lower levels.

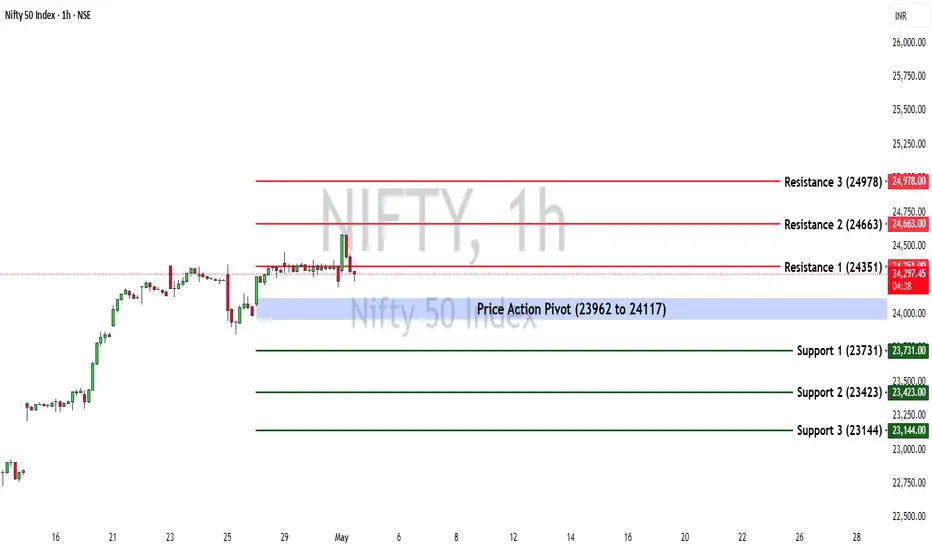
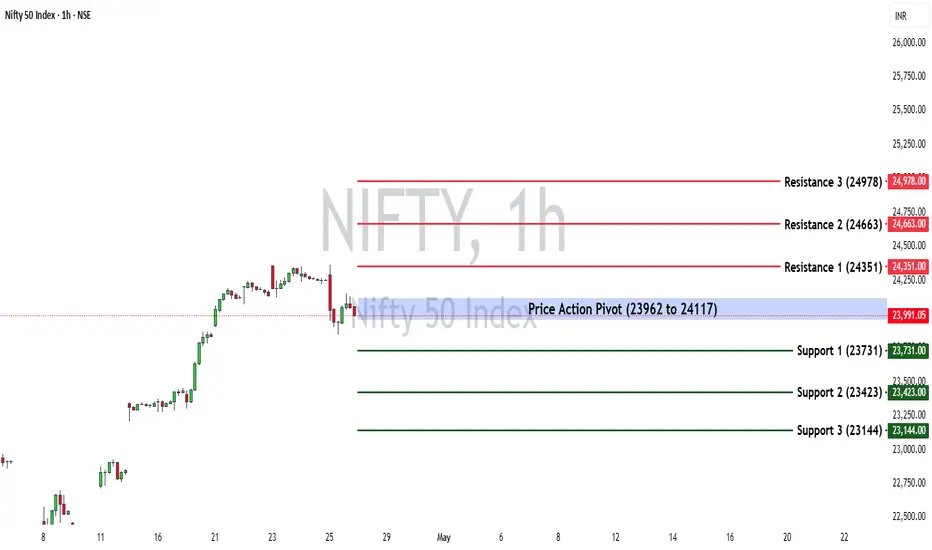
Nifty 50 at a Turning Point? Key Levels & Market Outlook AheadThe Nifty 50 opened with a gap-up of 97.5 points (0.41%) and ended the week at 24,039.35 (0.79%)
If Nifty sustains below 23,962, selling pressure may increase. However, a move above 24,117 could restore bullish momentum.
Key Levels for the Upcoming Week
🔹 Price Action Pivot Zone:
The crucial range to watch for potential trend reversals or continuation is 23,962-24,117.
🔹 Support & Resistance Levels:
Support:
S1: 23,731
S2: 23,423
S3: 23,144
Resistance:
R1: 24,351
R2: 24,663
R3: 24,978
Market Outlook
✅ Bullish Scenario: A sustained breakout above 24,117 could attract buying momentum, driving Nifty towards R1 (24,663) and beyond.
❌ Bearish Scenario: A drop below 23,962 may trigger selling pressure, pushing Nifty towards S1 (23,731) or lower.
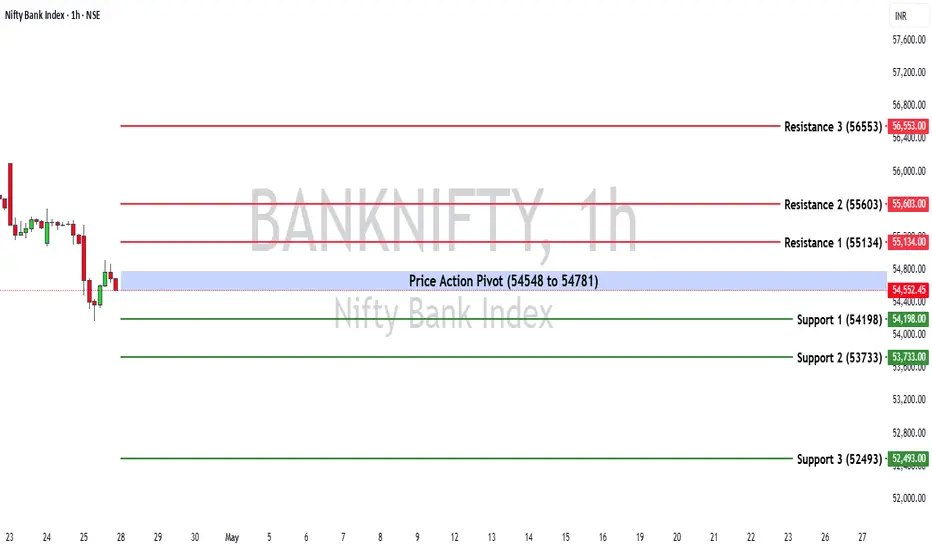
Bank Nifty Weekly Insights: Key Levels & TrendsBank Nifty ended the week at 54,664.05, registering a gain of 0.69%.
Key Levels for the Upcoming Week
🔹 Price Action Pivot Zone:
The critical range to monitor for potential trend reversals or continuation is 54,548 - 54,781
🔹 Support & Resistance Levels:
Support Levels:
S1: 54,198
S2: 53,733
S3: 52,493
Resistance Levels:
R1: 55,134
R2: 55,603
R3: 56,553
Market Outlook
✅ Bullish Scenario: A sustained move above 54,781 could trigger buying momentum, potentially driving Bank Nifty towards R1 (55,134) and beyond.
❌ Bearish Scenario: If the index falls below 54,548, selling pressure may increase, pulling it towards S1 (54,198) and lower levels.

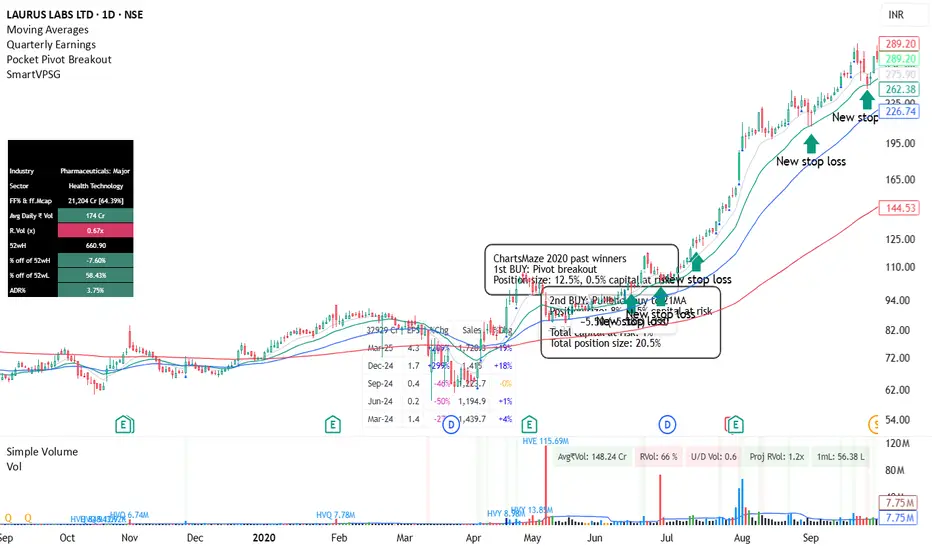
LAURAS LABS 2020 PAST WINNERThis is just for educational purposes, as I believe studying past winners helps you prepare for the next bull run and understand how winning stocks behave. I have marked the entry points so that you can see how many entries multibagger stocks typically provide.
Nifty 50 at a Turning Point? Key Levels & Market Outlook AheadThe Nifty 50 opened with a gap-up of 97.5 points (0.41%) and ended the week at 24,039.35 (0.79%)
If Nifty sustains below 23,962, selling pressure may increase. However, a move above 24,117 could restore bullish momentum.
Key Levels for the Upcoming Week
🔹 Price Action Pivot Zone:
The crucial range to watch for potential trend reversals or continuation is 23,962-24,117.
🔹 Support & Resistance Levels:
Support:
S1: 23,731
S2: 23,423
S3: 23,144
Resistance:
R1: 24,351
R2: 24,663
R3: 24,978
Market Outlook
✅ Bullish Scenario: A sustained breakout above 24,117 could attract buying momentum, driving Nifty towards R1 (24,663) and beyond.
❌ Bearish Scenario: A drop below 23,962 may trigger selling pressure, pushing Nifty towards S1 (23,731) or lower.
Disclaimer: lnkd.in
Bank Nifty Weekly Insights: Key Levels & TrendsBank Nifty ended the week at 54,664.05, registering a gain of 0.69%.
Key Levels for the Upcoming Week
🔹 Price Action Pivot Zone:
The critical range to monitor for potential trend reversals or continuation is 54,548 - 54,781
🔹 Support & Resistance Levels:
Support Levels:
S1: 54,198
S2: 53,733
S3: 52,493
Resistance Levels:
R1: 55,134
R2: 55,603
R3: 56,553
Market Outlook
✅ Bullish Scenario: A sustained move above 54,781 could trigger buying momentum, potentially driving Bank Nifty towards R1 (55,134) and beyond.
❌ Bearish Scenario: If the index falls below 54,548, selling pressure may increase, pulling it towards S1 (54,198) and lower levels.
Disclaimer: lnkd.in
Waaree Energies Technical Analysis with Confirm Targets Detailed chart analysis of Waaree Energies Ltd. based on the Daily Time Frame (1D)
Chart as of April 23, 2025
Current Price Movement
- LTP (Last Traded Price): ₹2,983.00
- Change: +₹367.10 (+14.03%) — A strong bullish candle with a significant gap-up.
- Volume: 19.82M — Strong volume confirmation indicating institutional interest.
Resistance / Supply Zones
1. Resistance - 1 (Supply Zone)
₹3,186.00 – ₹3,237.15
This is the nearest resistance zone where the stock may face selling pressure. Previous supply has emerged here, and buyers may take profit.
2. Major Resistance / Supply Zone
₹3,646.40 – ₹3,741.45
This zone marks the previous major highs and is a key resistance area. A breakout above this may indicate a strong continuation of the uptrend.
Support / Demand Zones
1. Major Support - 1 (Demand Zone)
₹2,455.20 – ₹2,512.70
This is the most recent breakout zone. If the price corrects, this area may act as a strong support level.
2. Support Zone - 2
- ₹2,294.40 – ₹2,323.30
- Acts as the next layer of support if ₹2,455 fails to hold.
3. Major Support - 2
- ₹2,009.40 – ₹2,075.15
- Long-term support zone, previously tested multiple times, can act as a strong demand zone in case of major correction.
Price Structure & Volume
- The chart shows a **strong bullish breakout** after forming a **higher low**.
- Today's price action indicates a **gap-up opening with heavy buying interest**.
- Volume confirms the breakout — higher than average volume during the up move suggests strong conviction.
Key Technical Takeaways
- Trend Reversal Confirmation: After a prolonged downtrend, price has shown a strong bullish reversal.
- Bullish Breakout: Price broke through multiple resistances with volume confirmation.
- Watch for Retest: In case of pullback, ₹2,455–₹2,512 zone should be watched for buying interest.
Targets
- First Target: ₹3,186–₹3,237
- Final Resistance Target: ₹3,646–₹3,741
- If the price fails to sustain above ₹2,983 and closes below ₹2,512 in coming sessions, it might signal a false breakout or correction.

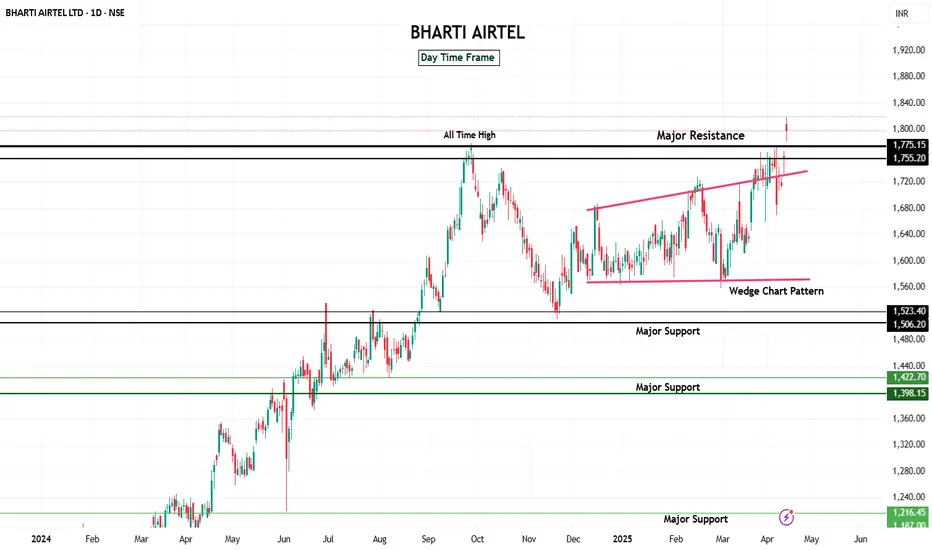
Bharti Airtel strong Breakout and New All time High"Why Bharti Airtel Stands Strong in India’s Ever-Changing Telecom Industry"
Bharti Airtel Limited is one of India’s largest and most trusted telecommunications companies. It operates in 18 countries across Asia and Africa, providing a wide range of services including
Telecommunication Services Sector
The telecom sector is the backbone of digital infrastructure, enabling mobile connectivity, internet, and data services for individuals, businesses, and governments.
Key Growth Drivers for Sector & Stock :
Rising internet and smartphone penetration
5G network rollouts
Digital transformation across industries
Increasing demand for cloud & enterprise connectivity
Growth in OTT, online gaming, and IoT devices
Why Bharti Airtel Stands Out
Strong market share in both mobile and broadband segments
Focused on premium customer base with higher ARPU
Aggressively expanding 5G coverage and fiber network
Consistent debt reduction and strong cash flows
Fast-growing enterprise business and digital services
ACI - Double Bottom (Bullish)Archean chemical industries is a leading specialty marine chemical manufacturer in India focused on producing and exporting bromine, industrial salt, and sulphate of potash across the world. Archean is the largest exporter of bromine and industrial salt in India and has amongst the lowest cost of production globally in both bromine and industrial salt.
Fundamentally sound company with PEG 0.79, ROE, ROCE, ROIC > 15%.
Technicals: Price is above 200MA. Double bottom formation after bearish Head & Shoulder. Trendline is about to breakout. Volumes have been steady in daily chart over the last 5D. Both DII, FII institutions have been increasing the stakes steadily in every quarter. 161.8% fib level would be long term target of 1069 which is also pivot R3 in weekly timeframe. Pivot targets are shown on chart.
Disclaimer: Educational purpose.

BANK NIFTY 50700BANK NIFTY 50700
Price Action: Bank Nifty closed at 51,502.70, down 0.18%
Technical Indicators:
RSI (14): Neutral at 53.92.
MACD: Showing a buy signal.
Stochastic RSI: Overbought at 99.29, suggesting caution.
ADX: Indicates a weak trend

NIFTY 22500NIFTY 22500
The Dow Jones Industrial Average surged around 3,000 points last night, marking one of its biggest gains in years

AUTO INDEX LOW AUTO INDEX LOW
AUTO INDEX COMING LOW
Nifty Auto Index reflects the performance of India's automobile sector. It is computed using the free float market capitalization method and has a base value of 1000 set on January 1, 2004

nifty coming june 2024 low 21200nifty coming june 2024 low 21200
The Nifty 50 Index is currently at 22,535.85, reflecting a 1.69% increase, but its will today down 21600

NIFTY 21300 NEXTNIFTY 21300 NEXT
The Nifty index has been fluctuating, with resistance levels being tested around 21,300.

IDFC FIRST BANK NEXT 48-36IDFC FIRST BANK NEXT 48-36
: The bank's share price dipped after its Q4FY25 business update, reversing some previous gains. However, it has delivered multibagger returns of 195% over five years

XAUUSD ANALYSIS 3 MIN TF ENTRY WITH GOOD R:R**Gold Trade Analysis: Rationale and Strategy**
**1. Price Reaction at Identified Zones (1-Hour Timeframe):**
- **Historical Significance:** The designated zones have consistently acted as strong support and resistance levels, evidenced by multiple instances of price reversals upon reaching these areas. Such behavior indicates substantial buying or selling interest, making them critical for anticipating future price movements.
**2. Anticipated Reversals:**
- **Supply and Demand Dynamics:** The expectation of reversals at these zones aligns with the principles of supply and demand. When price approaches a demand zone, increased buying interest often leads to upward movement; conversely, nearing a supply zone typically results in selling pressure and potential downward movement. citeturn0search0
**3. Entry Timeframe (3-Minute to 5-Minute):**
- **Precision in Execution:** Utilizing a lower timeframe, such as the 3-minute or 5-minute chart, allows for more precise entry points. This approach enables traders to observe detailed price action and confirm reversal signals within the broader 1-hour zones.
**4. Monitoring Price Reaction:**
- **Confirmation Signals:** It's crucial to watch for specific price action patterns—such as pin bars, engulfing candles, or bullish/bearish divergences—that confirm the anticipated reaction at these zones before entering a trade.
**5. First Take Profit (TP) and Minor Resistance ("Small White Zone"):**
- **Interim Resistance Levels:** The "small white zone" represents a minor resistance area where price may hesitate or consolidate. Recognizing this as the first take profit target allows for partial profit-taking and reassessment of market conditions before aiming for further targets.
**6. Risk Management:**
- **Protective Measures:** Implementing stop-loss orders just beyond the identified zones safeguards against unexpected breakouts or continuations, ensuring that potential losses are minimized.
HAPPY TRADING
