NIFTY BANK DOWN 50500NIFTY BANK DOWN 50500
The Dow Jones Industrial Average experienced a significant drop recently, falling by over 1,400 points, or 3.3%, due to widespread concerns triggered by new tariffs announced by President Trump
Pivot Points

DOW JONES FALL DOW JONES FALL -1600
The Dow Jones Industrial Average experienced a significant drop recently, falling by over 1,400 points, or 3.3%, due to widespread concerns triggered by new tariffs announced by President Trump

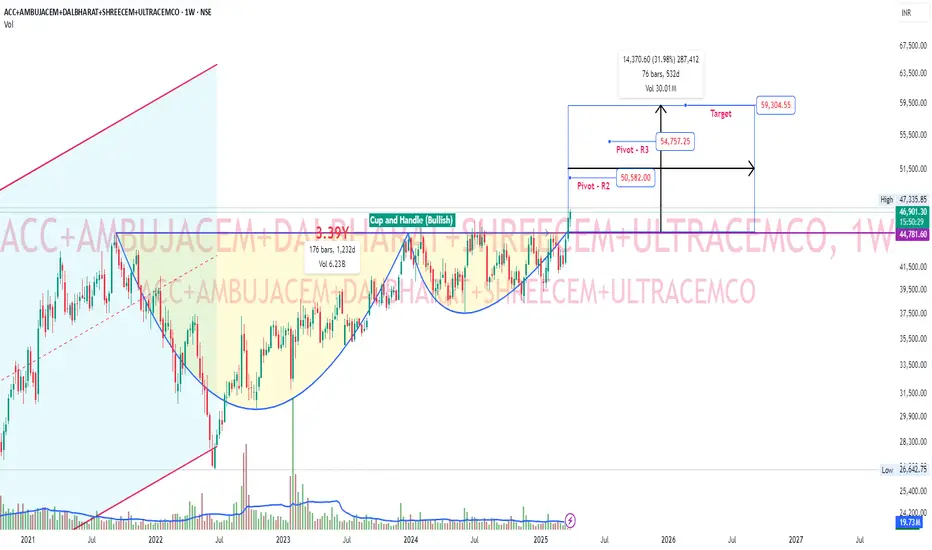
Cement - Custom Index - Cup and Handle BreakoutCreated custom index on ACC, AMBUJACEM, DALBHARAT, SHREECEM, ULTRACEMCO. Cup & handle breakout. Long buildup could also be seen on Ambuja and Shree cements. Pivot R2, R3 and target of cup is shown on chart.
XAU/USD One day pivot resistance zoneGreetings,
Hello traders, this is the XAU-USD 1H pivot resistance zone.
Based on market trend and previous day movement.
One day resistance 3 is represented by the yellow line.(3135.95)
Key levels;
Entry: 3135
Target: 3115
Stop loss: 3150
Risk Reward Ratio 1:3
Your likes and boosts motivate us to keep learning and sharing ideas!

KALYAN JIL WEAK TREND 450KALYAN JIL WEAK TREND 450
Kalyan Jewellers designs, manufactures, and sells a wide range of gold, diamond, platinum, and silver jewelry.
It operates across India and the Middle East, with a strong brand presence and a growing retail network

IGL UP TRENDIGL UP TREND
IGL has rebounded from a long-term trendline at ₹410, indicating strong support levels

Vedanta weak trend 450Vedanta weak trend 450
Market Cap: ₹1.82 trillion.
Dividend Yield: 9.31%.
Price-to-Earnings Ratio (P/E): 13.95
Operates in sectors like aluminum, copper, iron ore, power, and oil & gas
Recently acquired a nickel and cobalt plant, making it the sole producer of nickel in India

icici bank analysisicici bank analysis
ICICI Bank's share price is currently around ₹1,362.90, with a 52-week range between ₹1,048.10 and ₹1,373.00.
The bank has a market capitalization of ₹9,61,528 crore, a P/E ratio of 19.54, and a return on equity (ROE) of 19.47%

INDUSIND BANK WEAK TREND NEXT 630-INDUSIND BANK WEAK TREND NEXT 630-
₹606 (low) to ₹1,576.35 (high), indicating
P/E Ratio: 7.2, which is below the industry median, suggesting undervaluation

28-03 XAU/USD Key levelsGreetings, Dear traders this is the XAUUSD 15m pivot support zone. Based on market trend and previous day movement, candles taking support at the pivot R1 level 3071.59 suggest a short-term intraday buy direction.
Key levels;
Entry: 3076
Target: 3086
Stop loss: 3066
Risk Reward Ratio 1:1
Note; Intraday view only
Your likes and boosts motivate us to keep learning and sharing ideas!

XAU/USD Intraday long directionCondition: 1
Gold is at an all-time high.
Condition: 2
Candles taking support at the pivot R2 level (3041.07) indicate a short-term intraday buy direction
Key levels:
Entry - 3050
Target - 3060
Stop loss - 3040
Risk-Reward Ratio 1:1
We're inspired to keep learning and exchanging ideas by your comments and boosts!!!

25-03 XAU/USD LONGGreetings, This is the XAUUSD 15m pivot support zone. Based on the market trend and previous day's movement, candles that take support at the pivot level (3015.91) suggest a short-term intraday buy direction.(The sideways buy trend is seen by the white line)
Key levels
Entry: 3024
Target:3034
Stop loss:3014
Risk-Reward Ratio 1:1
Your likes and boosts have pushed us to continue learning and exchanging ideas!!!

Kotak bank consolidation breakoutKotak bank breaking out from consolidation rectangle pattern of about 3.18Y. Rectangle is a continuous pattern and likely to continue the uptrend. Soon ATH breakout and would reach 161.8% fib level after pivot target of 2376.5. RSI also had a clear breakout in weekly timeframe. Also higher timeframe looks good.

19-03 XAUUSD LONGGreetings, Dear traders this is the XAU/USD 15m pivot support zone. Based on market trend and previous day movement, candles taking support at the pivot level 3024.12 suggest a short-term intraday buy direction.
Trading ideas
Entry: 3029
Target: 3039
Stop loss: 3019
Risk Reward Ratio 1:1
Note; Intraday view only
Your likes and boosts motivate us to keep learning and sharing ideas!

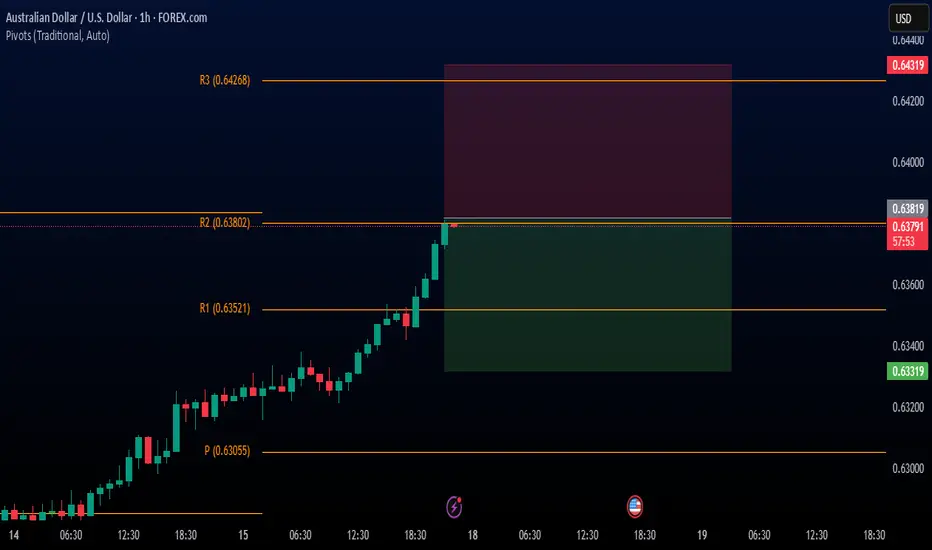
AUD USD Rally Needs a PitstopHello traders, This is the pivot resistance zone in the AUD/USD 1 hour. Candles taking resistance at the pivot R2 level of 0.63802 indicate a sell bias based on the market trend and the behavior of the previous day.
Trading ideas
Entry: 0.63819
Target: 0.64319
Stop loss: 0.63319
Risk Reward Ratio 1:1
Your likes and boosts motivate us to keep learning and sharing ideas!
18-03 XAU USD SHORTHello traders, this is the XAUUSD 15m pivot resistance zone. Based on the market trend and previous day's action, candles taking resistance at the pivot R3 level 3027 indicate a short-term intraday sell bias. (The white line is the sideways trendline from the previous day.)
Trading ideas
Entry: 3025
Target: 3005
Stop loss: 3035
Risk Reward Ratio 1:2
Note; Intraday view only
Your likes and boosts motivate us to keep learning and sharing ideas!

12-03 XAUUSD LONGGreetings, Dear traders this is the XAUUSD 15m pivot support zone. Based on market trend and previous day movement, candles taking support at the pivot level 2906.18 suggest a short-term intraday buy direction.
Entry: 2916
Target: 2926
Stop loss: 2906
Risk Reward Ratio 1:1
Note; Intraday view only
Your likes and boosts motivate us to keep learning and sharing ideas!

Support and resistance levelPrevious 20 candle period according to high and low point support and resistance level in 30 minute candle

10-03 XAUUSD LONGGreetings,The XAUUSD 15m pivot support zone is shown here. Candles taking support at the pivot S1 level indicate a short-term intraday buy direction based on market trend and prior day movement.
We're inspired to keep learning and exchanging ideas by your likes and boosts!!!
Entry : 2913.00
Target :2923.00
Stop loss:2903.00
Risk Reward Ratio 1:1
Note: Intraday view only

Nifty need reversalGreetings,The reason for the reversal is because, depending on the market trend, the 22678.70 (1d) zone, which is a pivot resistance area for the nifty intraday, may operate as a reversal zone.
Risk Reward Ratio 1:2

Nifty breakout scenerioNifty is in iptrend if it reaches 22600 angan take a support from there and reach upto 22720

EUR/USD Trading Plan: Key Support, Resistance & Entry PointsThe EUR/USD currency pair is one of the most traded pairs in the world and is often influenced by various factors, including economic indicators, geopolitical events, and monetary policies from the European Central Bank (ECB) and the Federal Reserve (Fed). As of March 10, 2025, the pair has been showing volatility due to recent economic data releases, interest rate expectations, and market sentiment.
Daily Chart Analysis:
• Trend: The daily trend shows a bullish outlook, with the EUR/USD maintaining above the 200-day moving average.
• Key Levels:
o Support: 1.0900
o Resistance: 1.1050
4-Hour Chart Analysis:
o Trend: The 4-hour chart indicates a recent bullish correction after a small pullback.
o Key Levels:
Support: 1.0930)
Resistance: 1.1040
1-Hour Chart Analysis:
o Trend: Short-term gauges a consolidation phase.
o Key Levels:
Support: 1.0920
Resistance: 1.0990
Key Support and Resistance Levels
• Support Levels:
o 1.0900: Strong psychological level and previous resistance.
o 1.0850: Fibonacci level that provides additional support.
• Resistance Levels:
o 1.1050: Recent swing high, seen as major resistance.
o 1.1100: Upper bound of the recent trading range.
Breakout Points
• A breakout above 1.1050 could signal further bullish momentum, targeting 1.1100 and potentially higher levels, depending on broader market conditions.
• A breakdown below 1.0900 would indicate bearish sentiment, possibly retesting lower support levels at 1.0850.
Trade Setup
Trade Idea
Bullish Setup: Buy EUR/USD
• Entry Point: 1.0955 (confirmation above key resistance on the 1-hour or 4-hour)
• Stop Loss: 1.0920 (below the recent support level)
• Take Profit: 1.1050 (targeting the established resistance)
✅ #forex
✅ #forextrading
✅ #forexanalysis
✅ #forexsignals
✅ #fxtrading
✅ #trading
✅ #eurusd
✅ #eurusdforecast
✅ #eurusdanalysis
✅ #eurusdtrading
✅ #eurusdsetup
✅ #eurusdsignal
✅ #technicalanalysis
✅ #priceaction
✅ #supportandresistance
✅ #trendanalysis
✅ #chartpatterns
✅ #elliottwave
✅ #swingtrading
✅ #daytrading
✅ #scalping
✅ #riskmanagement
✅ #tradingpsychology
✅ #tradingview
✅ #forexcommunity
✅ #marketanalysis

07-03 USD CHF BUYDear traders, here are the important pivot support zone of USDCHF (15m), candles taking support at the pivot S2 level it represents short time intraday buy direction,based on previous day movement and market trend.
Entry : 0.87700
Target :0.88200
Stop loss:0.87200
Profit: 50 Pips
Risk Reward Ratio 1:1
Note: Intraday view only
