Bata india on pole and flag patternif it break and close above 1960 can expect good move on daily time frame , must be on your watchlist.
please do your own analysis before take a trade
Poleflag

Apollo Tricoat Tubes- Nearing Upflag BreakoutHeadquartered in New Delhi, India, Apollo TriCoat is part of the APL Apollo Group. What makes Apollo different is its unusual approach to the business. The Company is not into conventional products, and remains focused on absorbing contemporary technology from various geographies to manufacture new-age products, which are often the first to be introduced to India.

pole and flag pattern in graphite indiacurrently in channel pattern. wait for a clear decisive breakout!

Sail Long opportunityNSE:SAIL
Stock - SAIL
TimeFrame - Monthly
Hello all!
Sail has been facing heavy resistance between 90 and 104 price band since May 2006. It finally broke that price band on April 2021 with a huge bullish candle and heavy volumes. It has now come back to retest the resistance-turned-support zone and has also formed a Flag and Pole pattern.
The Perfect entry would be after the flag breakout. The analysis would become invalid if the stock falls below the lower flag trendline
Do let me know your thoughts on this!
*NOT A CALL*

ICICI bank 14 % Move the Script is in good uptrend and now have recently retraced from FIB level and have shown good bullish candle. If it crosses 0.618 Level and Sustain a candle in 30 Min -1 Hour TF we can see good buying opportunity .
PLEASE MANAGE YOUR RISK

Nifty pvt bank bullish candidateNifty pvt bank spot cmp 18929
inverted head and shoulder
pole and flag
elliot wave
all 3 study suggest same thing
lets see if it follow the road map as per study..

HDFC BANK SWING TRADEPOLL AND FLAG formation in HDFC BANK. We can enter after breaking the consolidation and the HIGH VOLUME AREA. Targets are mentioned in the chart itself.

JSL - LongA classical pole & flag breakout with high volume on pole + low volume on pullback. Potential buy trade.

Birlasoft AnalysisBirlasoft : A fundamentally strong IT Company with a good chart setup. This company has given some excellent returns previous year. It has formed a bullish pole and flag pattern in 1h time frame. The stock is trying to go up and it can go up with the current market sentiment. Keep an eye on this stock.

JSW steel possible breakoutNSE:JSWSTEEL
observe bullish breakout in jswsteel above the trendline in coming days

TVS Motor Swing opportunityTVS Motor is testing its important support zone which was earlier its resistance area. It also formed a bullish flag and pole pattern on daily chart. Once it breaks out of that pattern can go long in this scrip

Hero moto case studyHERO MOTO SPOT 2675
HARMONIC + PRICE ACTION + CHART PATTERN + TIME CYCLE + HISTORICAL CYCLIC STUDY
TIME FRAME :- WEEKLY
We have considered historical case study, where counter gave a upmove of around 128% after that there was a retracement of 30% and finally a up-move of 81%
In this historical case we have considered pole and flag pattern formation,, where flag formation is in form of falling contracting wedge.. time of flag formation was around 39 weeks.
In flag formation there was formation of double bottom pattern, with positive divergence on RSI and at same time RSI gave a retest of breakout of falling trend line.
After the retracement was over counter gave a upmove of 81% from the low of retracement zone,, time consideration in pole and final leg of upmove have relation of 1.2 time.
Current case Study :-
There was a first up move leg of 130% after that current retracement zone going on where counter have retraced 28% which is almost equal to historical case study. Now if history have to repeat counter can give up move of 81% from current bottom of this retracement zone.
In this current case study there is pole and flag pattern formation,, where the flag formation is in form of falling contracting wedge, time of flag formation is almost 36 weeks, almost same a historical case study, if it have to be 39 week which means still consolidation of 2 more weeks possible in counter after that breakout from the flag formation can be seen, as time of pole formation is different for both the case so in terms of percentage time it can give breakout any time now.
In flag formation there is formation of double bottom pattern, with positive divergence on RSI and at same time RSI gave a retest of breakout of falling trend line , perfect copy of historical case study.
so now as per this cyclic study if counter gives breakout from pole and falg formation and time cycle maturity it can give upmove of 81% from current levels which will lead counter to around 4800 levels. and approx time for this move would be till november of 2022 as per historical time calculation.
Harmonic Study :-
Butterfly pattern formation on weekly time frame
Pre assumption of Butterfly pattern lead us to following conculsion
Leg C of Butterfly pattern formation is on verge to mature and if the final leg D of the pattern unfold ,
Which as per theory should be 1.27% extention of Leg XA , would lead us to levels of 4800 levels .
So pattern maturity lies around levels of 4800 as per butterfly formation.
Conclusion :- Two case study as per price action , chart pattern formation, time cycle lead us to levels of 4800 levels and harmonic study also lead us to levels of 4800 levels,,
Counter can be considered as good investment candidate from current levels..
for targets of 3600-4200-4800
Trade type : Investment
Time horizon :- 12-15 months
Good investment candidate.

LXCHEM in PoleFlagit shows symmetrical triangle and pole flag pattern on daily chart. have it on watch list for a potential 60% upside.

HDFC BANK - Awaiting a breakout soon.
A Darvas Box formed (good consolidation)
It can also be seen as a Pole Flag.
Moving averages have been supporting the stock well.
MACD crossover has been made.

Reliance Ready to BOOM!!! - BULLISH CONTINUATIONOn weekly Candle, It formed Flag Pole & Double Bottom , Indicating Breakout of Length of Size of Flag/Pole.
Support Levels: 2090 - 2010
Target Levels : 2400 - 2600
Note: This is for Education Purpose only


FLAG AND POLE IN EASEMYTRIPflag and pole pattern in easy trip planners. breakout above 620-625 range. targets are marked on the screen

FLAG & POLE BREAKOUT IN USD/JPY.One of the most profitable pattern to trade i.e. Flag & Pole which was forming in USD/JPY has given breakout with good bullish candle and volumes. It is expected that it will resume it's uptrend now until it reaches it's major resistance.

TECHM - Pole and FlagTechm Pole and flag breakout in daily chart. Looks good for swing trader SL below the accumulation range.

HAL POLE AND FLAG PATTERNStock did the breakout today expecting big move in this counter atleast 200 to 300 rs upside can go long with small SL as per chart pattern
Always do your own research before investing


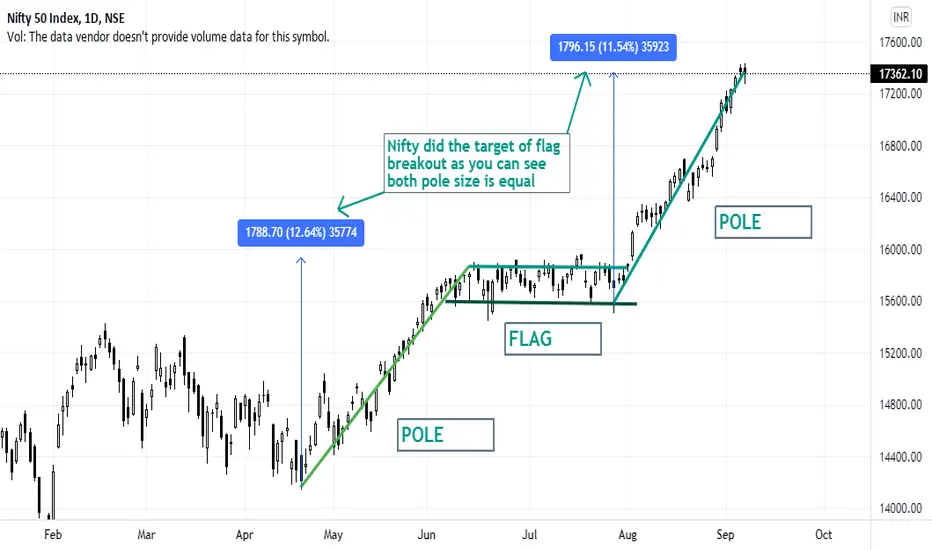
Nifty pole and flag breakoutAs you can see nifty did the target of pole and flag breakout now we can assume nifty will correct a bit here or will consolidate for time bing
Kotak Bank Long opportunityNSE:KOTAKBANK
Hello All!!
The chart is pretty much self-explanatory. There is a pole and flag pattern. Also, it's the bottom of the channel and is supported by a 50 week EMA.
This is thus a triple confluence and thus makes for a really good long position. The Reward to Risk ratio is also really good.
Do let me know your views on this.
HAPPY TRADING!!
*NOT A CALL*
