BUY TODAY SELL TOMORROW for 5%DON’T HAVE TIME TO MANAGE YOUR TRADES?
- Take BTST trades at 3:25 pm every day
- Try to exit by taking 4-7% profit of each trade
- SL can also be maintained as closing below the low of the breakout candle
Now, why do I prefer BTST over swing trades? The primary reason is that I have observed that 90% of the stocks give most of the movement in just 1-2 days and the rest of the time they either consolidate or fall
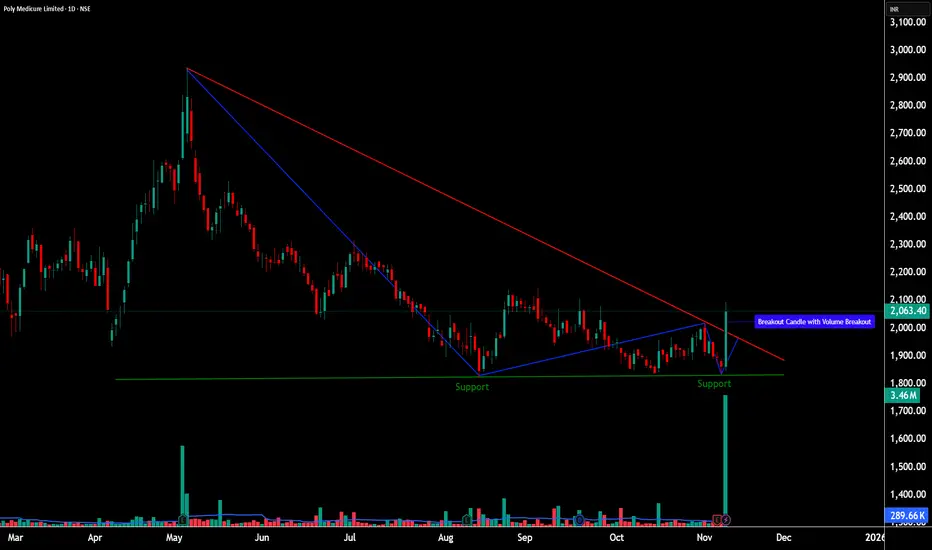
Trendline Breakout in POLYMED
BUY TODAY SELL TOMORROW for 5%
POLYMED

POLYMED - Breakout from Descending Triangle with Volume💹 Poly Medicure Ltd (NSE: POLYMED)
Sector: Healthcare & Diagnostics | CMP: ₹2,063.40 | View: Descending Triangle Breakout + 52-Week Volume Expansion
📊 Price Action
Poly Medicure finally broke out from a six-month descending structure with a sharp bullish candle. The move came after sustained compression near ₹1,800–₹1,850 support and resulted in a clean trendline breakout with the highest daily volume of the year.
Chart Pattern: Descending Triangle (Breakout in Progress)
Candlestick Pattern: Bullish Engulfing (Formed at Lower Boundary of Triangle – Base Support Zone ₹1,800–₹1,850)
📈 STWP Trading Analysis
STWP Trade Setup
Bullish Breakout: ₹2,094.30
Stop Loss: ₹1,829.30
Possible Intraday Demand Zone: 1869.50 - 1850.20
Possible Swing Demand Zone: 1869.50 - 1832.90
Momentum: High
Volume: 52-week breakout
This marks the possible conviction zone — where price, pattern, and participation align perfectly.
🧭 Support & Resistance
Support 1: ₹1,908 – immediate retest zone
Support 2: ₹1,752 – mid-base accumulation area
Support 3: ₹1,659 – final demand base
Resistance 1: ₹2,156 – near-term resistance
Resistance 2: ₹2,249 – previous supply pocket
Resistance 3: ₹2,404 – key breakout target zone
🔢 Fibonacci Levels
Retracement from the ₹3,000 high to ₹1,700 low shows:
38.2% level: ₹2,160
50% level: ₹2,350
📈 Volume & Momentum Setup
RSI: back above 61 — momentum returning
MACD: bullish crossover with growing histogram
CCI: high but justified by volume expansion
The breakout candle printed the highest daily volume in a year, confirming institutional accumulation.
While the weekly chart remains in recovery mode, the daily structure is already in breakout alignment.
🧩 STWP Summary View
Momentum: Strong
Trend: Early Reversal Attempt
Volume: Extremely High
Risk: Moderate (Stop below ₹1,830)
Bias: Bullish above ₹2,100 | Neutral below ₹1,850
________________________________________
⚠️ Disclosure & Disclaimer – Please Read Carefully
This post is created purely for educational and informational purposes and does not constitute investment advice or a buy/sell recommendation.
I am not a SEBI-registered investment adviser. All observations are based on technical studies and publicly available information.
Trading and investing involve risk; please manage position size and stop-loss discipline as per your risk profile.
Always consult a SEBI-registered financial advisor before making trading decisions.
________________________________________
Position Status: No active position in (POLYMED) at the time of analysis.
Data Source: TradingView & NSE India
💬 Found this useful?
🔼 Boost this post if you value clean, structured analysis.
💭 Drop your views — can Torrent Pharma sustain this breakout above ₹3,835?
🔁 Share this with traders who track institutional breakouts.
👉 Follow for more price-action based institutional setups.
🚀 Stay Calm. Stay Clean. Trade With Patience.
Trade Smart | Learn Zones | Be Self-Reliant 📊
________________________________________
Poly Medicure Limited - Breakout Setup, Move is ON...#POLYMED trading above Resistance of 2931
Next Resistance is at 4071
Support is at 2206
Here are previous charts:
Chart is self explanatory. Levels of breakout, possible up-moves (where stock may find resistances) and support (close below which, setup will be invalidated) are clearly defined.
Disclaimer: This is for demonstration and educational purpose only. This is not buying or selling recommendations. I am not SEBI registered. Please consult your financial advisor before taking any trade.

Poly Medicure Limited - Breakout Setup, Move is ON...#POLYMED trading above Resistance of 2339
Next Resistance is at 2931
Support is at 1782
Here are previous charts:
Chart is self explanatory. Levels of breakout, possible up-moves (where stock may find resistances) and support (close below which, setup will be invalidated) are clearly defined.
Disclaimer: This is for demonstration and educational purpose only. This is not buying or selling recommendations. I am not SEBI registered. Please consult your financial advisor before taking any trade.

Poly Medicure Limited - Breakout Setup, Move is ON...#POLYMED trading above Resistance of 1782
Next Resistance is at 2339
Support is at 1405
Here is previous chart:
Chart is self explanatory. Levels of breakout, possible up-moves (where stock may find resistances) and support (close below which, setup will be invalidated) are clearly defined.
Disclaimer: This is for demonstration and educational purpose only. This is not buying or selling recommendations. I am not SEBI registered. Please consult your financial advisor before taking any trade.

POLYMED - Long Setup, Move is ON..NSE:POLYMED
✅ #POLYMED trading above Resistance of 1782
✅ Next Resistance is at 2210
Related charts:
Charts are self-explanatory. Levels of breakout, possible up-moves (where stock may find resistances) and support (close below which, setup will be invalidated) are clearly defined.
Disclaimer: This is for demonstration and educational purpose only. This is not buying or selling recommendations. I am not SEBI registered. Please consult your financial advisor before taking any trade.

Poly Medicure Limited - Long Setup, Move is ON...#POLYMED trading above Resistance of 1405
Next Resistance is at 1782
Support is at 951
Here is previous chart:
Chart is self explanatory. Levels of breakout, possible up-moves (where stock may find resistances) and support (close below which, setup will be invalidated) are clearly defined.
Disclaimer: This is for demonstration and educational purpose only. This is not buying or selling recommendations. I am not SEBI registered. Please consult your financial advisor before taking any trade.

POLYMED INDIA FOR LONG TERM?BUY - POLYMEDICURE INDIA LTD
CMP - Rs. 940
Target - 1: Rs. 1150
Target - 2: Rs. 1400
.
.
.
Chart Pattern - Cup and Handle
Breakout Price - Rs. 958
.
.
.
Follow me for more!

POLYMED - Long Setup, Move is ON..NSE:POLYMED
✅ #POLYMED trading above Resistance of 1405
✅ Next Resistance is at 1782
Related charts:
Charts are self-explanatory. Levels of breakout, possible up-moves (where stock may find resistances) and support (close below which, setup will be invalidated) are clearly defined.
Disclaimer: This is for demonstration and educational purpose only. This is not buying or selling recommendations. I am not SEBI registered. Please consult your financial advisor before taking any trade.

POLYMED - Long Setup, Move is ON..NSE:POLYMED
✅ #POLYMED trading above Resistance of 1168
✅ Next Resistance is at 1405
Related charts:
Charts are self-explanatory. Levels of breakout, possible up-moves (where stock may find resistances) and support (close below which, setup will be invalidated) are clearly defined.
Disclaimer: This is for demonstration and educational purpose only. This is not buying or selling recommendations. I am not SEBI registered. Please consult your financial advisor before taking any trade.

Don't Dread ! Spread the Thread in Polymed ! Looks good Ahead !Poly Medicure Limited is an India-based manufacturer and top exporter of plastic medical disposables/ surgical Items with a portfolio of over 130 SKUs of disposable medical devices across 9 different product verticals.
Distribution Network
The company has a pan-India distribution network with over 260 distributors. It has reach to over 5,000 private and government hospitals and nursing homes across India. The company exports its products to over 110 countries. It earns 30% of revenues through domestic sales and the rest 70% through exports.
It derives major growth in exports from European Subcontinent.
Manufacturing Capabilities
The company owns and operates 8 manufacturing facilities across world. It owns 5 facilities in India, 1 each in China, Egypt and Italy.
The facility located in Egypt is owned by company's associate (ULTRAMED) wherein the company holds 23% economic interest.
R & D
The company operates its only R&D facility from Faridabad, India. The company has planned to expand its manufacturing facilities in Faridabad and Jaipur which are set to be ready by 2020 and 2021 respectively. Expansion includes manufacture of new products and capacity additions in its facilities.
It has over 300 patents to its name with 190+ pending applications.
It spent ~12 crores (2% of revenues) towards R&D in FY20 as compared to 10 crores in FY19

#POLYMED #SHORTTERM #SWING #NSEFlag Pattern on Weekly time Frame.
Breakout was witnessed and it was followed up by a retest which is always a good sign.
An Inverted Head and Shoulder Pattern can also be seen with the right shoulder in progress marching towards the neckline.
MACD structure also looks very positive.


POLYMED - Trading opportunity is discovered - Swing TradePOLYMED is trading at weekly & Daily Demand zone, This demand zone is also visible in lower Timeframes.
We can see that the selling volume is decreasing, so we can set our stop loss below the support zone and plan our trade accordingly.
I can conclude that this is a trade with Low Risk & High Reward.
If this analysis is useful to you then please like it & follow me for such analysis and and let me know what you think about this analysis in the comment box below.

POLYMED - Ichimoku Bullish Breakout Stock Name - Poly Medicure Limited
Ichimoku Cloud Setup :
1). Today's close is above the Conversion Line
2). Future Kumo is Turning Bullish
3). Chikou span is slanting upwards
All these parameters are showing bullishness at Current Market Price
and more bullishness AFTER crossing 1020.
#This is not Buy and Sell recommendation to any one. This is for education purpose and a helping hand to learn trading in Market.
# Cloud Trading
# Ichimoku Cloud
# Ichimoku Followers
I hope you all like my analysis.
Please do share your thoughts into comment section.
Please give a like, it motivates me to do analysis.

POLYMED Multiple Confirmation !!NSE:POLYMED
#NSE:POLYMED chart shows multiple pattern confirmations, #Trendline BO, #Descendingtriangle, #CupandHandle #Resistance BO
Levels marked on chart.
Don’t forget RRR.


POLYMED
CMP: 851
- Trading above box breakdown level (820)
- Facing resistance near 200 ema
- We may see good move once it crosses 200 ema

Breakout in Poly Medicure...Chart is self explanatory. Entry, Targets and Stop Loss are mentioned on the chart.
Disclaimer: This is for demonstration and educational purpose only. This is not buying or selling recommendations. I am not SEBI registered. Please consult your financial advisor before taking any trade.

Intraday Trade: watch for resistance breakoutbuy for intraday when it breaks trendline on 5 minute chart
For stoploss in Intraday use 5 minute chart and see nearest support.
for target use 5 min chart and fibonacci pivots as i don't keep predefined target.
try to book partially and trail.
Note: this is not a prediction for LONG/SHORT, trade will trigger only on given level as per technical analysis
NOTE: For Gapup or bo before 9:20
If gapup is more than 1% from bo level than avoid completely.
if less than 1% or gives bo before 9:20 than wait for
first 5 minute candle and entry above 5 minute candle
and revised SL below candle Low.

Poly Medicure LimitedTriangle pattern in Poly Medicure Limited. wait for the breakout with high volume


