Axis Bank | Gann Square of 9 Intraday Observation | 15 March 202Disclaimer:
This analysis is for educational purposes only. I am not a SEBI-registered advisor. This is not financial advice.
Symbol: AXISBANK (NSE)
Date Observed: 15 March 2024
Time Frame: 15-Minute Chart
Method: Gann Square of 9 (Price Capacity & Time Study)
This post documents a historical intraday market observation using the Gann Square of 9, focusing on how price capacity, trend context, and time alignment can highlight potential intraday reaction zones.
📉 Market Context & Reference Point Selection
Axis Bank showed downside pressure from the opening 15-minute candle.
In such conditions, the high of the first 15-minute candle (~1050) was treated as the 0-degree reference level, following Gann methodology.
This level acts as the starting point for measuring the intraday downward price cycle.
Correct trend identification and reference selection are essential before applying Square of 9 calculations.
🔢 Square of 9 Price Mapping
Based on the selected reference:
0 Degree: ~1050
45 Degree (Observed Normal Capacity): ~1034
The 45-degree level often represents the normal intraday price expansion range under regular market conditions.
⏱️ Price–Time Interaction (Observed Behavior)
Price interacted with the 45-degree level early in the session (around the third 15-minute candle).
Completion of normal price capacity well before the later part of the trading day has historically shown signs of temporary downside exhaustion.
After reaching this zone, the market displayed short-term stabilization followed by upward expansion.
This aligns with a commonly observed Gann concept:
When expected price capacity is completed early in time, the probability of a directional reaction may increase.
📘 Educational Takeaways
Gann Square of 9 helps define intraday price limits in advance
Trend context determines how reference points are selected
Time alignment adds confirmation to price-degree levels
Normal (45-degree) reactions are more frequent than rare cases
The approach encourages rule-based observation over emotional reaction
📌 Shared strictly for educational and historical chart-study purposes.
#AxisBank #GannSquareOf9 #WDGann #IntradayAnalysis #MarketEducation #PriceTime #TechnicalAnalysis
Positional

Axis Bank | Gann Square of 9 Intraday Observation | 18 March 202Disclaimer:
This analysis is for educational purposes only. I am not a SEBI-registered advisor. This is not financial advice.
Symbol: AXISBANK (NSE)
Date Observed: 18 March 2024
Time Frame: 15-Minute Chart
Method Used: Gann Square of 9 (Price–Time Study)
This post documents a historical intraday market observation using the Gann Square of 9, focusing on how price movement capacity and time alignment can highlight potential intraday reaction zones.
📊 Initial Market Structure
Axis Bank displayed upward momentum from the opening 15-minute candle.
The low of the first 15-minute candle (~1043) was treated as the 0-degree reference level.
This reference point marks the start of the intraday price cycle and is used for further Square of 9 calculations.
Correct identification of the 0-degree level is a key requirement for consistent Square of 9 analysis.
🔢 Square of 9 Level Mapping
Using Square of 9 price-degree relationships, the following levels were observed:
0 Degree: ~1043
45 Degree (Observed Normal Capacity): ~1057
The 45-degree level often reflects the normal intraday price expansion range under regular market conditions.
⏱️ Price & Time Interaction (Observed Behavior)
Price interacted with the 45-degree level early in the session (around the second 15-minute candle).
Completion of the normal price capacity well before the later part of the trading day has historically shown temporary price pressure.
After reaching this zone, the market displayed rejection behavior followed by short-term downside expansion.
This observation aligns with a commonly studied Gann principle:
Early completion of expected price capacity may increase the probability of a market reaction.
📘 Educational Takeaways
Gann Square of 9 helps define logical intraday price limits
Normal (45-degree) reactions occur more frequently than exceptional cases
Time context adds important confirmation to price levels
Minor price deviations around calculated levels are part of normal market behavior
The method supports rule-based observation, not prediction
📌 Shared strictly for educational and historical chart-study purposes.
#AxisBank #GannSquareOf9 #WDGann #IntradayAnalysis #MarketEducation #PriceTime #TechnicalAnalysis

Positional Trading (1–3 Months): A Complete Guide1. What Is Positional Trading?
Positional trading is a medium-term trading style where traders hold positions for several weeks to a few months, typically 1–3 months. The goal is to capture larger price moves driven by trends, macro factors, earnings cycles, or sectoral momentum—without the stress of daily market noise.
Unlike intraday or swing trading, positional traders are less concerned with short-term volatility and focus more on the overall direction of the market or a specific asset.
This approach sits perfectly between swing trading (days to weeks) and long-term investing (years).
2. Who Should Choose Positional Trading?
Positional trading is ideal for:
Traders with full-time jobs
Traders who cannot monitor screens all day
Those who prefer low-stress, high-conviction trades
Traders comfortable holding through minor pullbacks
People who enjoy technical + fundamental analysis
It is not ideal for traders who panic during temporary drawdowns or need constant action.
3. Time Horizon and Market Scope
Holding Period:
Minimum: 2–3 weeks
Maximum: 3 months (sometimes slightly longer)
Markets Suitable for Positional Trading:
Equities (stocks)
Indices
Commodities
Forex (higher timeframes)
Cryptocurrencies (with higher risk control)
In the Indian market, positional trading is extremely popular in NSE cash stocks, index futures, and sectoral themes.
4. Core Philosophy of Positional Trading
The core idea is simple:
“Trade the trend, not the noise.”
Positional traders:
Enter near early or mid-trend
Hold through normal corrections
Exit when the trend weakens or reverses
They rely on patience, discipline, and high-probability setups rather than frequent trades.
5. Analysis Used in Positional Trading
Positional trading uses a blend of Technical, Fundamental, and Sentiment Analysis.
A. Technical Analysis (Primary Tool)
Higher timeframes are crucial:
Weekly charts
Daily charts
Key tools:
Trendlines & channels
Support and resistance
Moving averages (50 EMA, 100 EMA, 200 EMA)
MACD
RSI (40–80 range in trends)
Breakouts from consolidation
Chart patterns (Cup & Handle, Flags, Triangles)
Positional traders avoid over-indicator clutter and focus on structure and trend.
B. Fundamental Analysis (Confirmation Tool)
Fundamentals help answer:
“Does this trend make sense?”
Important factors:
Earnings growth
Revenue growth
Debt levels
Sector outlook
Management guidance
Macroeconomic data (rates, inflation)
You don’t need deep balance-sheet modeling—just directional clarity.
C. Sector & Market Sentiment
Strong stocks usually come from strong sectors.
Positional traders track:
Sector rotation
Index trend (NIFTY, BANK NIFTY)
Institutional activity (FII/DII)
Global cues
A stock moving against its sector often underperforms.
6. Entry Strategy in Positional Trading
Entries are planned, not rushed.
Common entry methods:
Breakout above major resistance
Pullback to rising moving average
Retest of breakout level
Trendline bounce
Fresh highs with strong volume
Positional traders wait for confirmation, not prediction.
7. Stop Loss Strategy
Stop loss is non-negotiable.
Types of stop loss:
Swing low / swing high
Below key support
Below moving average (for long trades)
Volatility-based (ATR)
Stops are wider than intraday trades but smaller relative to potential reward.
A positional trader accepts small losses calmly to protect capital.
8. Target Setting and Trade Management
Targets are based on:
Resistance zones
Measured move projections
Risk-reward ratio (minimum 1:2, ideally 1:3 or more)
Trade management techniques:
Partial profit booking
Trailing stop loss
Moving stop to cost after confirmation
Holding winners longer than losers
The biggest profits come from letting trends run.
9. Risk Management and Position Sizing
Risk management defines survival.
Rules positional traders follow:
Risk only 1–2% of capital per trade
Never over-leverage
Diversify across sectors
Avoid correlated trades
Even a 40–50% win rate can be profitable with proper risk-reward.
10. Psychology of Positional Trading
Psychology is the biggest challenge.
Common emotional hurdles:
Fear during pullbacks
Greed after quick profits
Impatience during consolidation
Doubt due to news headlines
Successful positional traders:
Trust their analysis
Avoid over-trading
Ignore short-term noise
Maintain a trading journal
They think in probabilities, not predictions.
11. Advantages of Positional Trading
Lower stress than intraday trading
Less screen time
Better risk-reward opportunities
Fewer trades, lower costs
Suitable for part-time traders
Captures meaningful market moves
12. Disadvantages of Positional Trading
Requires patience
Capital gets blocked longer
Drawdowns can test emotions
Overnight and gap risk
Misses short-term opportunities
Understanding these drawbacks helps manage expectations.
13. Positional Trading vs Other Styles
Style Holding Period Stress Level Capital Use
Intraday Minutes–hours Very high High
Swing Days–weeks Medium Medium
Positional 1–3 months Low–Medium Efficient
Investing Years Low Long-term
14. Final Thoughts
Positional trading is a professional, disciplined approach to the markets. It rewards patience, structure, and consistency rather than speed or excitement.
If you can:
Follow rules
Control emotions
Respect risk
Hold quality setups
Then positional trading can deliver stable and scalable returns over time.
“Big money is not made in buying or selling, but in waiting.”

HCLTECH | Failed H&S → Bullish reversalFailed H&S as price reclaimed neckline with higher low intact
-RSI >50, EMAs (9/21) rising, OBV trending up
-Sector tailwind: IT supported by rising USDINR
Trade plan
-Buy > 1726 (with volume > 20-DMA)
SL: 1615
-Positional target: 2400
-R:R ≈ 1:6

NIFTY 2Hr ChannelNSE:NIFTY
NIFTY 50 – 2H Structure Update
Nifty is trading within a well-defined rising channel, indicating an intact medium-term bullish structure.
Price has taken support from the demand zone (blue zone) and bounced strongly, confirming buyers’ presence at lower levels.
Currently, price is consolidating above the previous breakout zone (~26,100), which now acts as an important support.
As long as this support holds, the higher-high higher-low structure remains valid.
🔹 Immediate Support: 26,100–26,000
🔹 Resistance / Supply: Near upper channel zone
🔹 Trend Bias: Buy on dips while above demand
🔹 Risk Area: Sustained breakdown below the blue zone can invite deeper retracement
Market is in a healthy pause after a sharp rally, not weakness.
Patience and level-based trading is the key here.
==============
⚠️ Disclaimer:
==============
This content is shared strictly for educational and informational purposes.
We are not SEBI-registered investment advisors or analysts.
The views expressed are personal opinions, based on publicly available data and market observations.
Please consult a SEBI-registered investment advisor before taking any investment or trading decisions.
Any actions taken based on this content are entirely at your own risk and responsibility.
========================
Trade Secrets By Pratik
========================

Thyrocare-A beautiful breakout is done!Thyrocare has given a good closing today above its previous ATH.
Stock has formed a beautiful rounding bottom pattern. Volumes buildup before breakout is decent as well.
Previously, i had covered Policybazar & Zomato with such patterns and they have given amazing returns.
Keep this stock in watchlist. This can give similar move as well.
Entering at ATH levels is tricky but these stocks come with excellent reward opportunity.
I am NISM certified RA and not SEBI registered.
This is not a recommendation but is shared for you to learn.

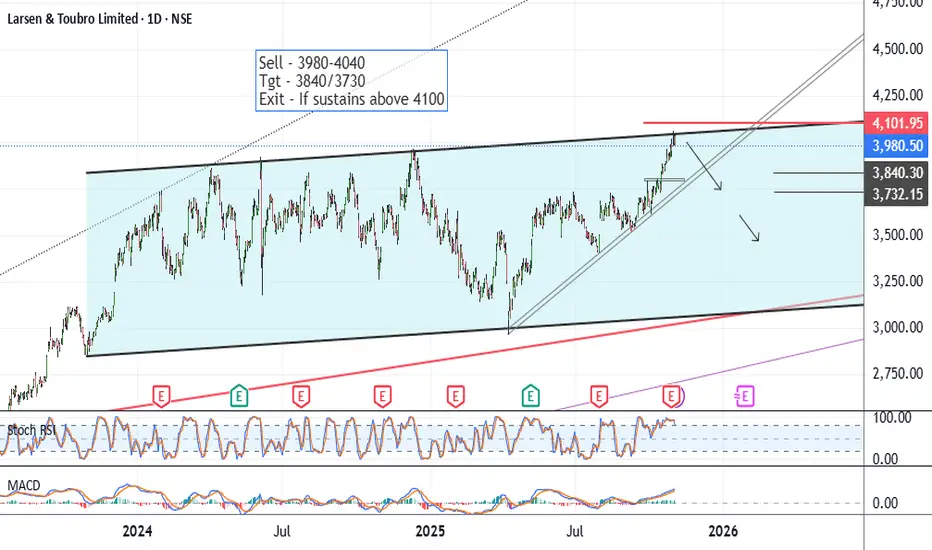
LT - Positional Short SetupCMP 3980 on 04.11.25
In the last 2 years, the stock has been traveling in a rising wedge pattern. At present, it has reached higher levels. If it reverses from these levels, there could be a short opportunity.
All important levels are marked on the chart.
Possible targets may be 3840/3730 or even more downside, depending upon the scenario.
If it sustains above 4100, the exit plan should be exercised.
All the above illustrations and descriptions are for educational and observation purposes only. It is not a buying or selling recommendation.
All the best.
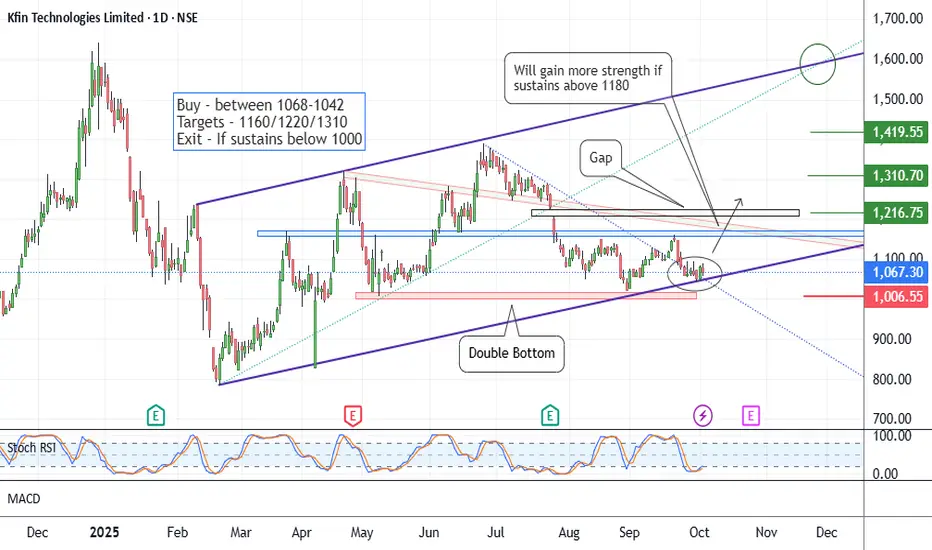
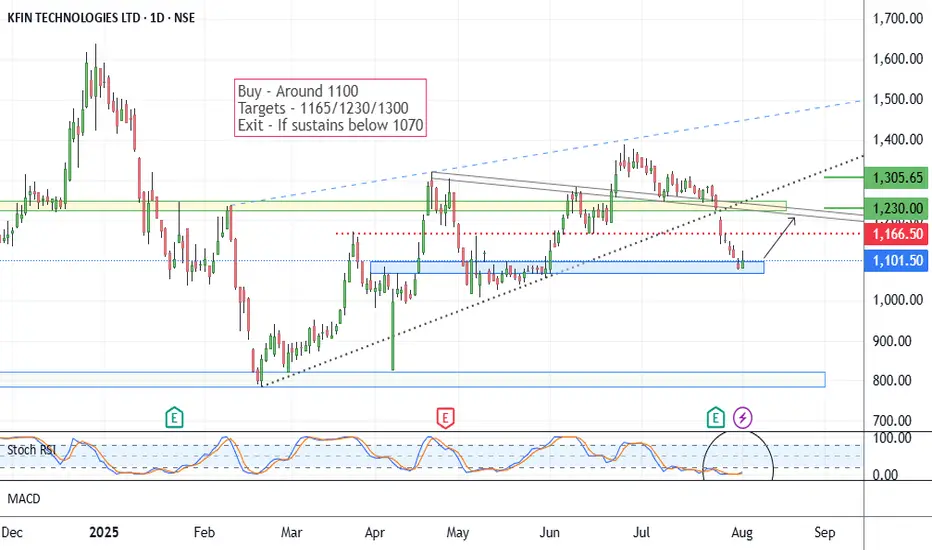
Kfin Tech - Low Risk Long SetupCMP 1067 on 04.10.25
All important levels are marked on the chart.
The price has been traveling in a parallel channel and presently resting at the lower edge of the channel.
Also, a double bottom pattern was formed, with a bottom of around 1000.
First target is 1160, considering the stop loss of 1000.
If it crosses 1180 and sustains above, it will gain more strength.
If it sustains below 1000 levels, the setup will go weak.
One should keep the position size in accordance with the risk capacity.
All these illustrations are only for learning and observation purposes; they should not be considered as trading recommendations.
All the best.
Hindware - Keep On WatchCMP 200 on 22.04.25
The stock price has dropped more than 60% since August 2023. This time, it has been consolidating in a narrow range for the last two months.
If it gives a move upside after this consolidation, we may see the price of 245,345 or even more.
One should buy wisely in the range of 200-180, keeping the stop loss levels in mind. If it sustains below 175, the setup will show weakness.
Keep the position size according to the risk management.
All these illustrations are only for learning and sharing purposes, not a buy or sell recommendation in any way. It is only for paper trading.
All the best.

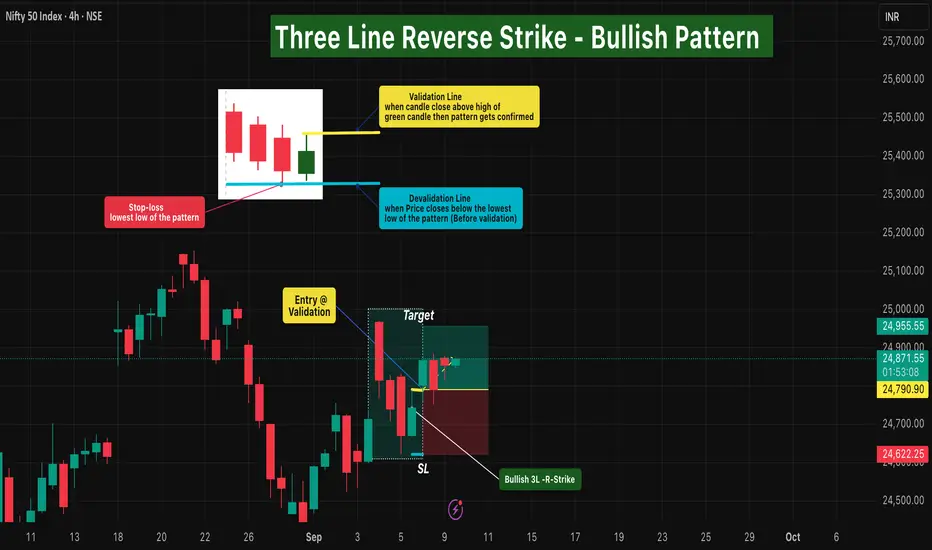
Three Line Reverse Strike - Bullish Pattern (NIFTY-4H)🔹 Intro / Overview
The Three-Line Reverse Strike (Bullish Pattern) is a rare yet powerful reversal setup.
It forms when three consecutive strong bearish candles 🟥 🟥 🟥 are immediately followed by a strong bullish candle 🟩
This sudden shift shows sellers losing control and buyers stepping in with conviction.
“3 Bears fall… 1 Bull strikes back stronger 🐂"
___________________________________________________________
📖 How to Use
✅ Validation Line → High of the Bullish candle.
❌ Devalidation Line → Lowest Low of the entire 4-candle pattern(Before Validation).
- Entry → Confirmed when any current candle closes above the Validation line.
- Stop-Loss → Lowest Low of the pattern.
- Target → 1x the stop-loss distance.
- Trailing → Remaining lots can be managed using ATR, Fibonacci levels, Box Trailing, or swing structure for extended upside.
____________________________________________________________
🎯 Trading Plan(educational only)
Entry → On close above Validation line (Bullish High).
Stop Loss → Lowest Low of the pattern.
Target → First TP at 1R (Entry–SL distance).
Remaining lots → Trail with volatility tools to capture extended trends.
____________________________________________________________
📊 Chart Explanation
- This is a positional setup 🕰️:
- 3️⃣ Strong Bearish candles show seller dominance.
- 1️⃣ Strong Bullish candle reverses momentum and forms the setup.
- Validation → High of the Bullish candle.
- Devalidation → Lowest Low of the (3 Bearish + 1 Bullish) sequence.
-Lowest Low ⛔, Target = 1R 🎯, trailing for extended move 🚀.
____________________________________________________________
👀 Observation
- Most effective after prolonged downtrends or near support zones.
- Works best with confirmation from volume and EMA trend filters.
- Provides a clear visual shift from bearish momentum to bullish reversal.
____________________________________________________________
❗ Why It Matters?
- Shows sellers exhausting after consecutive pressure.
- Buyers step in aggressively with a strong bullish candle.
- Gives a structured entry, SL, and TP framework.
- Reduces noise by relying on a clear multi-candle sequence.
____________________________________________________________
🎯 Conclusion
The Three-Line Reverse Strike – Bullish Pattern highlights a powerful momentum shift.
By applying strict Validation, Devalidation, and disciplined stop-loss rules, traders can capture strong reversals while limiting risk.
🔥 Patterns don’t predict. Rules protect.
____________________________________________________________
⚠️ Disclaimer
📘 For educational purposes only.
🙅 Not SEBI registered.
❌ Not a buy/sell recommendation.
🧠 Purely a learning resource.
📊 Not Financial Advice.
Bajaj Finance - Seems to be on SupportCMP 853 on 12.08.25
In the last 15-20 days, the stock price has come down to 853 from 970. Present level may act as support again, as can be seen on the chart.
If it bounces back, it will form a Double bottom pattern.
Stochastic RSI is showing a reversal sign too.
Targets may be 885/915+.
If it sustains below 840-835 levels, the setup will go weak.
The risk-reward ratio is good at this point.
This illustration is for educational and sharing purposes; this should not be taken as a buying or selling recommendation.
All the best.

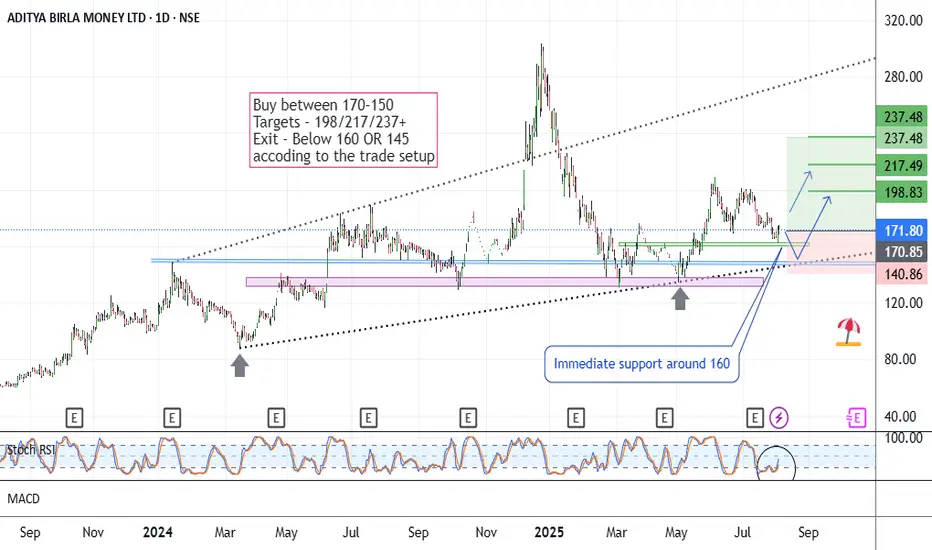
AB Money - Positional LongCMP 171.80 on 04.08.25
The chart is self-explanatory. Resistances and supports are mentioned according to the setup. Immediate support seems to be around 160, whereas the lower support area is around 148.
Stochastic RSI is trying to rise at present.
If it goes upward, targets may be 217, 237, or more.
Entry-level and position size should be considered according to the exit price (if going at a loss).
If it sustains below 145, this setup will go weak.
This illustration is purely my own view, for learning and sharing purposes only. This is not buying or selling advice, as I am not a registered analyst.
All the best.
Kfintech - Positional Long SetupIn the last month of July, the stock price fell from 1380 to 1100. Presently seems on a support area. As you may see on the chart. This setup is based on a reversal possibility from the support range around 1080.
Stochastic RSI shows a reversal sign.
Possible targets may be 1165/1230 and 1305.
If it sustains below 1070-1050 levels, the setup will go weak. Below 1070, the exit plan should be considered.
One has to keep the position size according to the risk management.
All these illustrations are my personal view, only for learning and observation purposes; this is not buying or selling advice.
All the best.
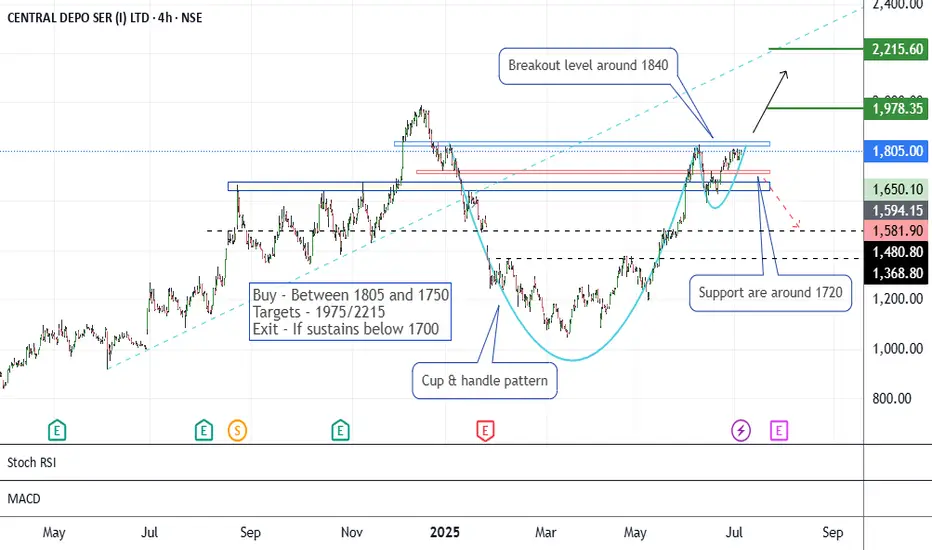
CDSL - An AnalysisThe stock price has formed a Cup & Handle-like pattern since January 2025. This moment is reaching near the breakout levels of 1820-1840.
If it sustains above 1840, it may go bullish to see the levels of 1975/2215.
Support levels are around 1710.
One has to maintain risk management according to the exit levels below 1700.
Second view -
If it does not sustain above the levels of 1840-1860, and slips down below 1700, the setup will show weakness and a bearish view. Then it may go lower to the levels of 1480 and 1365.
All these illustrations are for learning and knowledge-sharing purposes. It should not be considered as a buying or selling recommendation.
All the best.
HCLTECHBased on my analysis for long Only for education purpose only not for any buying or selling recommendations.

MOTISONS, positive outlook in coming daysNSE:MOTISONS
Again coming up with trade idea. tight consolidation in range of 3-4% within last 5-6 days. Price is taking support on short term EMA. Looks like weak hands are exiting. Breaking above the pivot line (22.08) could lead to significant push when crossing with good volume. Good volume is observed today.
SL is somewhere around 5-6% (Refer the long position drawn over the chart).
One can invest 10% portfolio size as per following calculations
Position sizing and managing risk is the key.
Portfolio is: 1,00,000
Position size: 10,000
Risk 5%: 500. Which means only 0.5% of overall portfolio value is under risk.
Stay connected for commentary for coming days.
Disclaimer:
The information provided herein is for educational and informational purposes only and should not be construed as investment advice. The stock analysis and recommendations are based on publicly available information, data sources believed to be reliable, and our interpretation at the time of writing.
Investing in equities involves risks, including the risk of loss of capital. Past performance is not indicative of future results. Readers and investors are advised to conduct their own research or consult a qualified financial advisor before making any investment decisions.
The author(s), affiliates, or associated entities may hold positions in the stocks mentioned, and such positions are subject to change without notice.
We do not guarantee the accuracy, completeness, or timeliness of any information presented, and we disclaim any liability for financial losses or damages resulting from the use of this content.

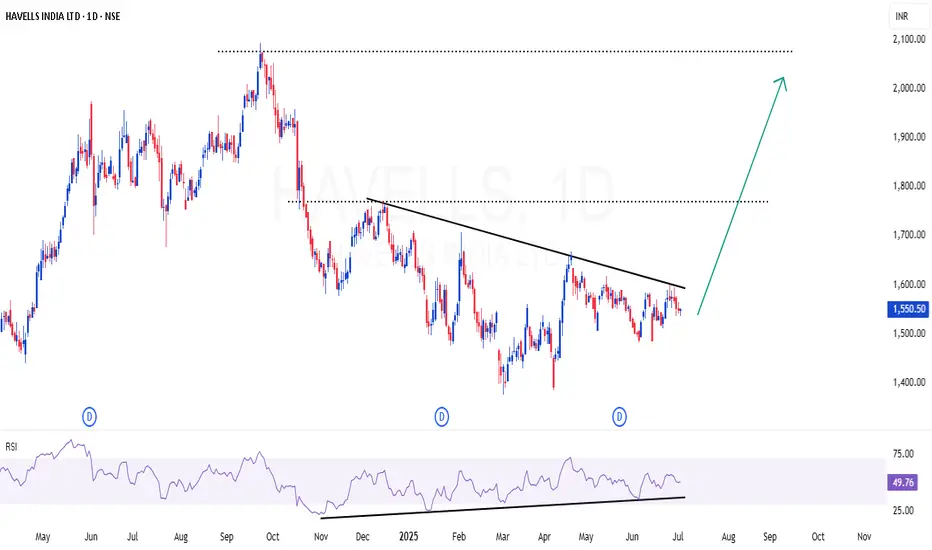
HAVELLS | Pleasant set up - INHS & RSI divergenceHAVELLS | Pleasant set up - INHS & RSI divergence
Strong RSI divergence in daily time frame
Inverted Head & Shoulder setup also in visual
A small dip may be possible for 8-10% in this stock , as market (NIFTY) is over heated. But we can consider that as opportunity to scale up the position
CMP : 1550 (Dip : 1480)
Inside Bars After High Volume – CERA Setting Up Near Key CT📌 Timeframe: Weekly (WTF)
📌 Type: Technical Observation / Swing Structure
📌 Concept: Counter Trendline Breakout Setup
CERA is currently navigating a highly constructive zone from a swing trading lens. Here's what's developing technically:
🔹 Higher Low Formation:
The stock has established a higher low structure, with the white internal trendline offering visible support across recent weeks. Interestingly, this aligns perfectly with the 200-period EMA on the weekly timeframe, enhancing its significance as a dynamic support layer.
🔹 Volume Clues:
Two of the highest volume candles on the weekly chart have now been followed by inside bars, a potential sign of absorption or base building. This tightening within volume zones signals institutional interest and a possible buildup phase.
🔹 Supply Zone Identified:
An overhead supply (marked in orange)
🔹 EMA Context: The blue 200 EMA further reinforces the idea of Supportive price behavior around this line validates its role.
🔍 This post is for educational discussion only. No recommendation or forecast is implied. Please conduct your own due diligence.

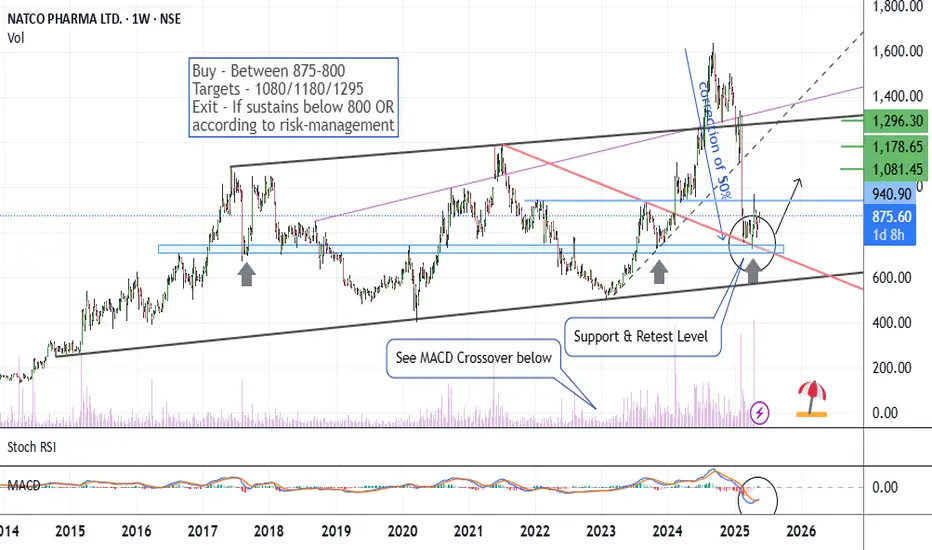
Natco Pharma - Enough CorrectionCMP 875 on 22.05.25
The stock price dropped 50% between September 2024 and March 2025. In recent days, it has been consolidating near the 800 levels, which is acting as a support zone, as shown on the chart.
MACD shows a likely crossover, too.
If it gives an upside move, further targets may be 1080/1180 or more.
One has to keep the position size according to the risk management.
The setup will go weak if it sustains below 800-775 levels.
All these illustrations are only for learning and sharing purposes, not a piece of trading advice in any way.
All the best.
Max Financial - Positional Short SetupCMP 1305 on 02.05.25
In the last 2 months, the stock price has increased by around 30%. This time forming a double top-like pattern. If the price is rejected from these levels, a bearish move may come ahead.
If the price remains below the 1300 levels, targets of 1245/1210 and 1165 may be seen.
One should wait for the confirmation for a short setup, while considering risk management.
The setup fails if the price sustains above 1330.
All these illustrations are only for learning and sharing purposes, not a trading recommendation. It is only for paper trading.
All the best.

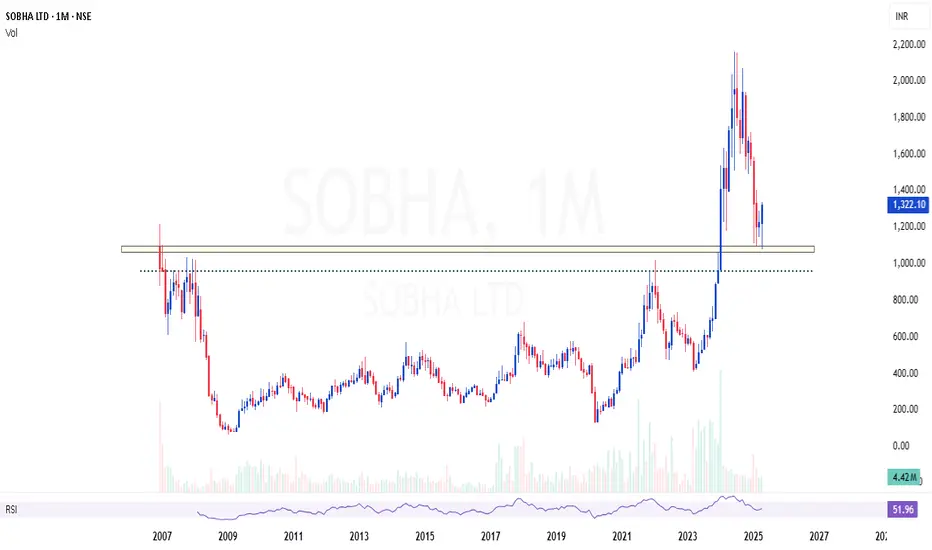
SOBHA | Excellent area of value - Looks strong buySOBHA | Excellent area of value in monthly time frame - Looks strong buy
Showing strong reversal candles at support
CMP : 1322 (Dip : 1000)
MAITHANALL | One of my favorite stock - But this time tradingMAITHANALL | One of my favorite stock - But this time trading
Trendline breakout - Looks good for 40%
CMP : 965
SL : 900
Target : 1300

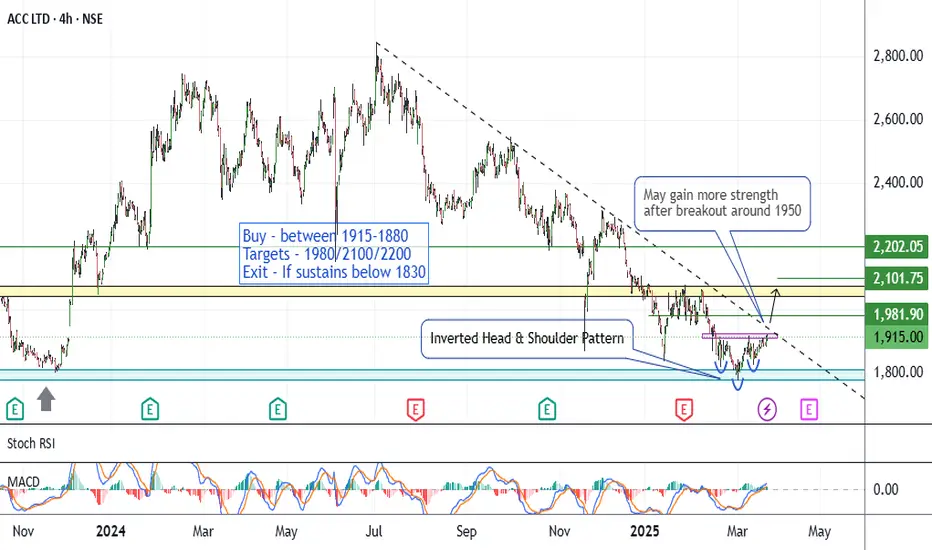
ACC - Long SetupCMP 1915 On 24.03.25
Since July 24, the stock price has dropped around 40%. According to the chart setup, it seems to be getting ready for a breakout now.
Has been consolidating into a small range in recent sessions. Now formed an inverted Head & Shoulder pattern. Also, there will be a breakout of the dotted line, joining the tops of wicks of the last 8 months.
If gives a breakout around 1950, there may be a bullish phase ahead. Targets may be 1980/2100 and 2200.
The setup will lose significance if sustains below 1830.
The strategy should be coupled with some hedging tool for better risk coverage, if possible. Or keep your position size according to the risk capacity.
All these illustrations are only for learning and sharing purposes, only for paper trading. It is not a buy or sell recommendation.
All the best.