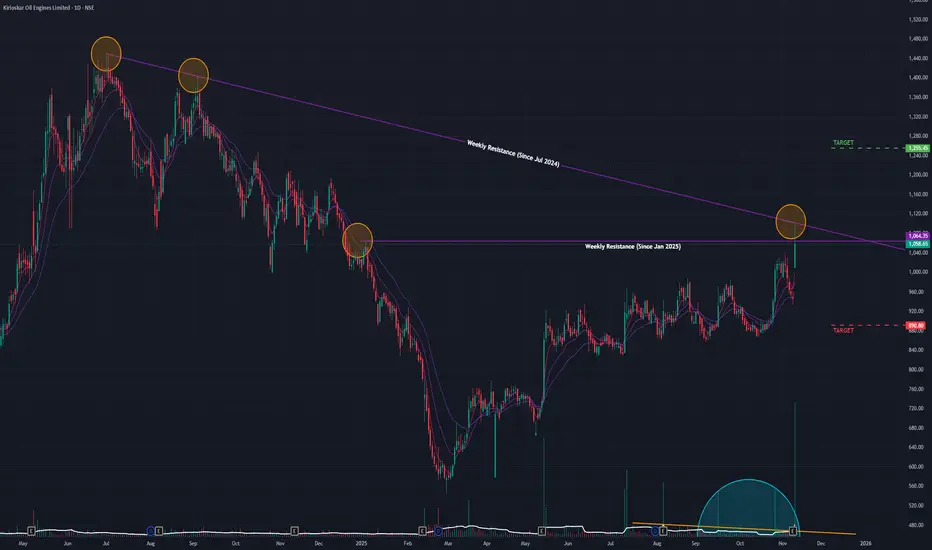
Kirloskar (D): Bullish, Awaiting Breakout ConfirmationThis is a "wait and watch" scenario. The stock is at a critical decision point. A massive fundamental catalyst (record-breaking earnings) has met a powerful technical resistance. The price-action of the next few days will be crucial.
🚀 1. The Fundamental Catalyst
Today's explosive move was fundamentally driven. The stock gapped up and surged +11.98% on 11.37 Million in volume as a direct response to its record-breaking Q2 2026 earnings (44% profit growth). This provides a strong, non-speculative a to the bullish case.
📈 2. The Long-Term Context (The Setup)
- The 2024-2025 Correction: After its ATH in July 2024, the stock entered a downtrend, which found its bottom in February 2025.
- The Recovery: Since then, the stock has been in a slow, methodical uptrend, forming a bullish structure of Higher Lows .
- Drying Volume: Volume had dried up during this slow uptrend, a classic sign of accumulation before a major move.
🎯 3. Today's Action (The "Battle at Resistance")
The stock's upward progress was blocked by a dual resistance :
1. A short-term horizontal resistance (since Jan 2025).
2. A long-term angular resistance (from the Jul 2024 ATH).
Today, the stock's gap-up broke the short-term horizontal resistance intraday , but by the market's close, sellers pushed it back down. It failed to close above this level . This "rejection" or "failed close" signals that a significant supply of sellers (profit-takers) exists at this exact point, despite the great news.
📊 4. Confluence of Bullish Indicators
Despite today's rejection, the underlying trend is powerfully bullish:
- RSI: The Relative Strength Index is rising on the Daily, Weekly, and Monthly charts .
- EMAs: The short-term Exponential Moving Averages are in a "PCO" (Price Crossover) state on all three timeframes .
This "trifecta" of bullishness across all timeframes suggests today's rejection is likely a pause, not a top.
🧠 5. Future Scenarios & Key Levels to Watch
The next few days will define the trend.
🐂 The Bullish Case (Confirmation)
- Trigger: We need to see a decisive daily close above the horizontal resistance, followed by a break of the main angular trendline.
- Target: This would confirm the breakout and open the path to the ₹1,255 level.
🐻 The Bearish Case (Rejection)
- Trigger: If today's failed close is a bull trap and the momentum is lost.
- Target: The price will likely fall to retest the primary support level at ₹890 .
Potentialbreakout
Yatra Online (D): Strongly Bullish, Fundamentally-Driven BOThis is a high-conviction breakout, driven by explosive quarterly earnings. The stock has successfully broken its short-term consolidation but was temporarily rejected at its multi-year high. The underlying momentum is exceptionally strong.
🚀 1. The Fundamental Catalyst (The "Why")
The technicals are being driven by fundamentals. Today's +11.88% surge on massive 35.31 Million volume is a direct response to Yatra's record-breaking Q2 2026 earnings , which featured:
- Net Profit up 96% year-over-year.
- Revenue up 48% year-over-year.
- A raised full-year EBITDA guidance from the company.
📈 2. The Long-Term Context (The Setup)
- The Bottom & Reversal: After making its all-time low in March 2025 , the stock has been in a strong, sustained uptrend.
- The Consolidation: From August 2025, the stock entered a sideways trend, building a base for its next move. Volume was declining during this period—a classic sign of accumulation.
🎯 3. Today's Action (The "Two-Resistance Battle")
Today's price action was a textbook example of a breakout hitting two resistance levels:
- Resistance 1 (CLEARED): The short-term horizontal resistance from September 2025 (at ~₹172 ). The stock decisively broke and closed above this level.
- Resistance 2 (REJECTED): The long-term horizontal resistance from January 2024 (the previous multi-year high). The stock breached this level intraday to make a new ATH, but failed to close above it . This is a key sign of selling pressure or profit-taking at the old high.
📊 4. Key Technical Indicators
Indicator analysis confirms the bullish power across all timeframes:
- RSI: The Relative Strength Index is rising on the Daily, Weekly, and Monthly charts .
- EMAs: The short-term Exponential Moving Averages are in a "PCO" (Price Crossover) state on all three timeframes .
🧠 5. Future Scenarios & Key Levels to Watch
The path forward is now clearly defined by the two resistance levels identified.
🐂 The Bullish Case (Confirmation)
- Trigger: The stock must now get a decisive daily close above the long-term resistance (the Jan 2024 high it was rejected from today).
- Target: Once it clears that final hurdle, the path is open to price target of ₹205 .
🐻 The Pullback Case (Healthy Re-test)
- Trigger: If the stock is unable to continue the immediate momentum (due to the rejection) and pulls back.
- Target: The price will likely fall to re-test the resistance-turned-support at ₹172 . A "bounce" off this level would be a textbook, healthy confirmation of the breakout and a new buying opportunity.

Bharat Forge (D): Strongly Bullish, Multi-Resistance BreakoutThis is a high-conviction breakout event. The stock has decisively broken out of a 17-month corrective pattern, shattering two major resistance levels simultaneously. This move is supported by a powerful confluence of bullish indicators across all timeframes and is underpinned by strong fundamental results.
📈 1. The Long-Term Context
- The Correction: After hitting its All-Time High (ATH) in June 2024 , the stock entered a 10-month corrective downtrend.
- The Reversal: This trend reversed in April 2025 , and the stock began a new recovery.
- The Consolidation: This recovery was capped by two distinct resistance levels, forcing the stock into a consolidation phase where, volume was drying up (a sign of accumulation).
🚀 2. The Decisive Breakout (Today's Action)
Today, the stock broke this stalemate with explosive force:
- The Surge: A powerful +5.55% rally on high-conviction volume of 4.81 Million shares.
- The Dual Breakout: This move shattered both key resistance levels at once:
1. The long-term angular resistance (from the June 2024 ATH).
2. The short-term horizontal resistance (from June 2025, at the ₹1,362 level).
- The Catalyst: This technical breakout is supported by strong Q2 earnings, which act as a fundamental driver, giving the move a higher probability of success.
📊 3. Confluence of Bullish Indicators
This breakout is not isolated. It is confirmed by a rare "trifecta" of bullish signals on Daily, Weekly, and Monthly timeframes:
- RSI: The Relative Strength Index is rising on all three timeframes .
- EMAs: The short-term Exponential Moving Averages are in a "PCO" (Price Crossover) state on all three timeframes .
- SMAs: A recent SMA Golden Cross (50-day crossing 200-day) is active, confirming the new long-term uptrend.
🎯 4. Future Scenarios & Key Levels to Watch
This breakout provides a very clear road map based on identified levels:
🐂 The Bullish Case (Momentum Continues)
- Trigger: If the current momentum is sustained, the stock is in a new uptrend.
- Target 1 (Short-Term): ₹1,525
- Target 2 (Medium-Term): ₹1,625
🐻 The Pullback Scenarios
- Scenario A (Healthy Re-test): The momentum pauses, and the stock pulls back to test the "resistance-turned-support" level at ₹1,362 . A bounce from here would be a textbook confirmation and a secondary buying opportunity.
- Scenario B (Breakout Failure): If the breakout is a "fakeout," the stock will fail to hold ₹1,362 and will likely fall to the next major support level at ₹1,305 .

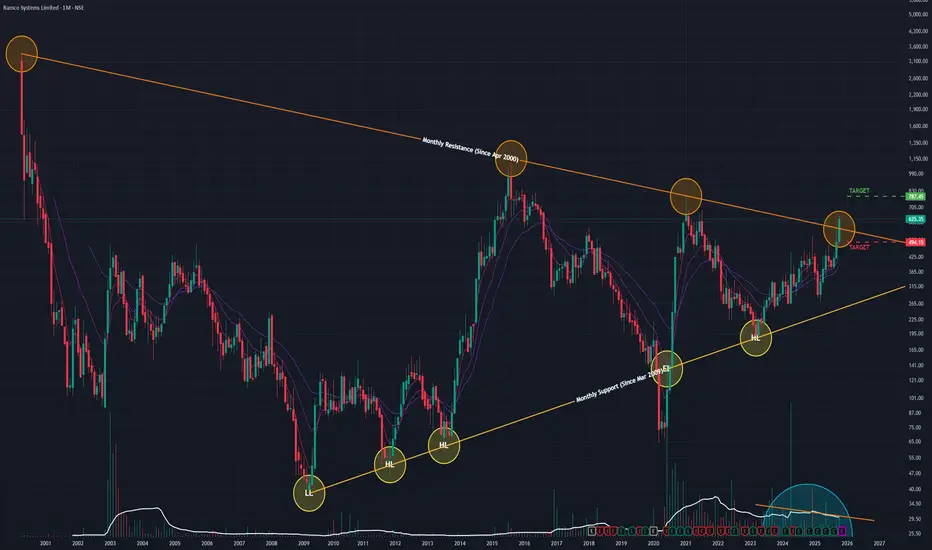
Ramco Systems (M): Extremely Bullish, Multi-Decade BreakoutThis stock is displaying one of the most powerful bullish technical signals possible: a decisive breakout from a 25-year angular resistance trendline . This is a major, long-term secular trend change.
📈 1. The Long-Term Context
- The 25-Year Pattern: Since its peak in April 2000, the stock has been held down by a massive, multi-decade angular resistance trendline.
- The Bottom & Reversal: The stock formed its ultimate bottom in March 2009. Since then, it has been in a slow, 16-year recovery, forming a pattern of Higher Lows against this unbreachable resistance.
- Volume Contraction: Volume was declining (or contracting) during the final phases of this consolidation. This is a classic sign of seller exhaustion right before a major breakout.
🚀 2. The Decisive Breakout
In October 2025, this 25-year pattern was shattered:
- The Surge: The stock surged +26.61% in a single month.
- High-Conviction Volume: This move was backed by a massive spike in volume ( 2.77 Million shares), confirming strong institutional interest and the validity of the breakout.
- The Close: Most importantly, the stock closed firmly above the 25-year trendline, signaling the "lid" has finally been broken.
📊 3. Key Technical Indicators
The underlying momentum supports this new long-term trend:
- RSI: The Relative Strength Index is rising, showing that strong buying momentum is accelerating.
- EMAs: The short-term Exponential Moving Averages are in a "PCO" (Price Crossover) state, confirming the new bullish trend is in effect across timeframes.
🎯 4. Future Scenarios & Key Levels to Watch
This breakout provides a very clear road map.
🐂 The Bullish Case (Confirmation)
- Confirmation: The "gold standard" for a breakout of this magnitude is a successful "re-test." We want to see the price pull back to the old trendline (now new support, around ₹560 ) and "bounce," confirming the breakout is genuine.
- Target: Once confirmed, the next logical technical price target is ₹787 .
🐻 The Bearish Case (Breakout Failure)
- Trigger: If the momentum is not sustained, and the breakout is a "fakeout" (a "bull trap").
- Confirmation: The stock fails to hold its gains and closes back below the broken trendline (around ₹560 support level) on high volume.
- Target: This failure would invalidate the immediate thesis and likely lead to a sharp sell-off.
Navin Flourine (M): Strongly Bullish, Multi-Year BreakoutThe stock has decisively broken out of a multi-year consolidation phase, backed by exceptional volume. This move signals the end of its sideways trend and the potential start of a new, major bull market.
📈 1. The Long-Term Context
- Primary Uptrend: The stock was in a powerful primary uptrend from July 2013 to May 2021.
- Multi-Year Consolidation: Since May 2021, the stock has been in a wide and long sideways consolidation phase.
- The "Lid": This entire consolidation was capped by a formidable horizontal resistance line formed in September 2022. This level rejected multiple breakout attempts over the last three years.
- Volume: Volume during this long consolidation was average, suggesting a balance between buyers and sellers as the stock built its base.
🚀 2. The Decisive Breakout (The October 2025 Event)
This month, the entire multi-year pattern changed:
- The Surge: The stock surged +23.06% in a powerful, decisive move.
- High-Conviction Volume: This breakout was accompanied by 6.9 Million in volume, confirming strong institutional interest and the validity of the move.
- The Close: Most importantly, the stock closed firmly above the multi-year horizontal resistance, signaling the "lid" has finally been broken.
📊 3. Key Technical Indicators
The underlying momentum strongly supports this bullish breakout:
- RSI: The Relative Strength Index (RSI) is rising, showing that buying strength is accelerating.
- EMAs: The short-term Exponential Moving Averages are in a "PCO" (Price Crossover) state, confirming the new bullish trend.
🎯 4. Future Scenarios & Key Levels to Watch
⚠️ A Note of Caution (The "Fakeout" Risk)
The primary risk after a powerful breakout is a "fakeout" (or "bull trap" ). This happens when the price breaks out, lures in buyers, but then fails to hold its gains and falls back below the broken resistance level.
🐂 The Bullish Case (Breakout Confirmation)
- Confirmation: The bullish momentum continues. The "old resistance" level (around ₹4,938 ) must now prove to be the "new support." A small pullback to retest this level, followed by a bounce, would be the strongest confirmation.
- Target: If the breakout is sustained, the next logical price target is ₹7,445 .
🐻 The Bearish Case (Breakout Failure)
- Trigger: The momentum fails, and the breakout is confirmed as a "fakeout."
- Confirmation: The stock falls and closes back below the critical resistance-turned-support line.
- Target: This failure would trap the new buyers and likely lead to a sharp sell-off, with the price falling back toward the lower end of its old trading range, starting with the ₹4,495 level.

PayTM (M): Strongly Bullish, Pending BreakoutThe stock has completed a major trend reversal from its 2024 all-time lows. It is now challenging a critical, multi-year resistance level. All technical indicators suggest that pressure is building for a significant bullish breakout.
📈 1. The Long-Term Context
- Major Reversal: After hitting its all-time low in May 2024, the stock has reversed its trend and has been in a sustained uptrend for over a year.
- Multi-Year Base: This entire move has built a massive base, leading to the current showdown at a key horizontal resistance line formed in January 2022 .
- Recent Consolidation: For the past three months, the stock has consolidated just below this major resistance. The volume has been "drying up" during this period, which is a classic bullish sign of seller exhaustion.
🚀 2. The Current Setup (The Decisive Move)
- Price Compression: The stock is currently coiling in a tight range, less than 5% below this critical multi-year resistance.
- Building Momentum: The surge in October ( +15.96% on 63.19M in volume ) showed a strong rejection of lower prices and a powerful move back up to test the "lid" of this pattern.
📊 3. Key Technical Indicators
The underlying momentum strongly supports a bullish resolution:
- RSI: The Relative Strength Index is in a clear rising state, showing that buying strength is building.
- EMAs: The short-term Exponential Moving Averages are in a "PCO" (Price Crossover) state, confirming the bullish momentum is intact across timeframes.
🎯 4. Future Scenarios & Key Levels to Watch
The setup provides two very clear scenarios. The immediate action is to watch for the breakout.
🐂 The Bullish Case (Breakout Confirmation)
- Trigger: A decisive, high-volume close above the horizontal resistance line (approx. ₹1,350 - ₹1,370 ).
- Confirmation: This would confirm the multi-year base is complete and the stock is entering a new, long-term bull market.
- Target: The next logical price target would be ₹1,725 .
🐻 The Bearish Case (Breakout Failure)
- Trigger: The stock fails to break the resistance and momentum is not sustained.
- Confirmation: A high-volume rejection from this level, followed by a break below the recent consolidation.
- Target: This failure would likely see the stock fall to retest its immediate support level at ₹1,090 .

HindPetro (M): Strongly Bullish, Breakout in ProgressThe stock has decisively broken out of a 10-month accumulation phase on high volume, signaling a potential new leg up. The bullish indicators are all aligned, and the focus now shifts to whether this breakout can be sustained.
📈 1. The Long-Term Context
- Consolidation Phase: The stock has been in a broad sideways trend since January 2024, building a large base.
- Key Resistance: A horizontal resistance line formed in September 2024 has acted as a "lid," rejecting all price advances for the past year.
- Drying Volume: volume has been "drying up" during this consolidation. This is a classic sign of seller exhaustion and accumulation by buyers.
🚀 2. The Decisive Breakout
- The Surge: In October, the stock finally broke this pattern with a decisive 7.35% surge.
- High-Conviction Volume: This move was backed by massive, high-conviction volume of 106.56 Million shares, confirming strong institutional interest and the validity of the breakout.
- The Close: Most importantly, the stock closed firmly above the horizontal resistance trendline , turning that old "lid" into a new potential "floor" (support).
📊 3. Key Technical Indicators
The underlying momentum supports this bullish move:
- EMAs: Short-term Exponential Moving Averages are in a "PCO" (Price Crossover) state, confirming strong, positive momentum.
- RSI: The Relative Strength Index (RSI) is rising, showing that buying strength is accelerating with the price.
🎯 4. Future Scenarios & Key Levels to Watch
⚠️ A Note of Caution
Instead of a "double-top," the key risk to watch for is a "fakeout" (or a "look above and fail"). Also watch for bearish divergence
🐂 The Bullish Case (Breakout Confirmation)
- Confirmation: The stock must now hold above the old resistance level (the breakout point). A successful retest of this level would be the strongest bullish confirmation.
- Target 1: ₹565
- Target 2: ₹700 (if upside momentum accelerates)
🐻 The Bearish Case (Breakout Failure)
- Trigger: If the current breakout is a "fakeout," the price will fail to hold and will drop back below the resistance line it just broke.
- Target: A failure here would likely see the stock fall to retest the immediate support level of ₹375.

Precision Wires (M): Strongly Bullish (ATH Breakout)The stock has decisively broken out of a 10-month consolidation range, creating a new All-Time High (ATH) on exceptional volume. This signals the potential start of a new, major uptrend.
📈 1. The Long-Term Context
- Sideways Trend: The stock was in a prolonged sideways consolidation phase starting from January 2024.
- Volume Contraction: During this sideways period, volume was "drying up," which is a classic bullish sign of seller exhaustion and accumulation.
- The "Lid": This consolidation formed a strong horizontal resistance level that capped all rally attempts throughout the year.
🚀 2. The Decisive Breakout (The October 2025 Event)
In October, the stock broke this pattern with explosive force:
- Massive Surge: The stock surged 23.11% in a single move.
- Exceptional Volume: This surge was backed by massive, high-conviction volume of 24.51 Million shares, confirming strong institutional interest.
- ATH Achieved: This move pushed the stock to a new All-Time High and, most importantly, closed firmly above the horizontal resistance that defined the 2024 & 2025 trading range.
📊 3. Key Technical Indicators
The underlying momentum supports this bullish breakout:
- EMAs: Short-term Exponential Moving Averages are in a "PCO" (Price Crossover) state, signaling a new, strong bullish trend.
- RSI: The Relative Strength Index (RSI) is rising, indicating that buying momentum is strong and accelerating.
🎯 4. Future Scenarios & Key Levels to Watch
⚠️ A Note of Caution
While the breakout is clear, we need to be cautious. After such a sharp vertical move, a "pause" or "pullback" is healthy. The primary risk to monitor is potential bearish divergence
🐂 The Bullish Case (Breakout Continuation)
- Confirmation: The old resistance must now act as new support. As long as the stock holds above this breakout level, the trend is intact.
- Target 1:₹320
- Target 2:₹410 (if momentum continues)
🐻 The Bearish Case (Breakout Failure)
- Trigger: If the breakout fails, the stock will fall back below the old horizontal resistance level (the one it just broke).
- Confirmation: A high-volume move back into the old range.
- Target: This would signal a "fakeout" and could lead to a sharp decline to the nearest support ₹170 .

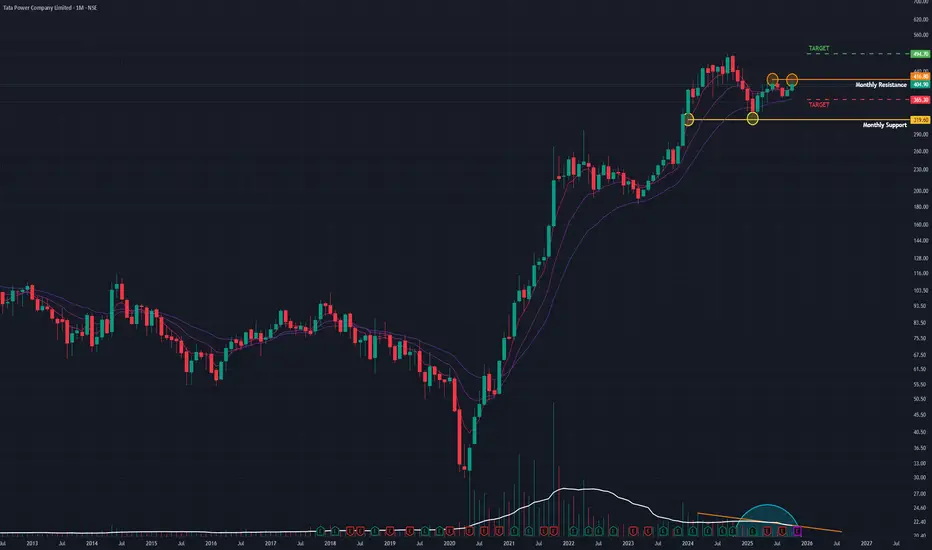
Tata Power (M): Coiling Spring Ready for an ATH Breakout?Tata Power is displaying a classic and very clean technical setup. After its parabolic run to an All-Time High (ATH) in September 2024 (around ₹490 ), the stock has entered a healthy, multi-month sideways consolidation. This is a bullish "coiling spring" or "accumulation" pattern.
📊 The Technicals
1. The Range (The "Box"):
The battle lines are clearly drawn.
- Resistance: A strong horizontal supply zone at the ATH, around ₹405 - ₹415 .
- Support: A firm demand zone and the bottom of the range at ₹365 .
2. Volume is Key:
The most bullish signal here is the volume contraction . Throughout this sideways "box," the volume has been drying up. This indicates that sellers are becoming scarce, and the stock is being absorbed by buyers in preparation for the next move.
3. Momentum Indicators:
- EMAs: Short-term EMAs are in a "PCO" (Price Crossover) state, showing bullish momentum.
- RSI: The RSI is rising, indicating that buying strength is building up under the surface.
4. Recent Price Action:
The surge in October (+4.18% on high volume) was an attempt to break this resistance. It failed, which confirms that the ₹415 level is a formidable barrier that will require significant volume to overcome.
🎯 The Scenarios
This is a "wait and watch" setup where we let the price tell us what to do next.
- 🐂 THE BULLISH CASE (Trigger)
I am watching for a decisive daily close above the ₹415 resistance level . This must be accompanied by a high-volume spike (higher than the October attempt) to confirm that the supply has finally been absorbed.
- Target 1: ₹490 .
- Next Target: Price discovery.
- 🐻 THE BEARISH CASE (Invalidation)
If the stock fails to break out and instead breaks down with conviction, the setup is invalidated.
- Trigger: A daily close below the ₹365 support level .
- Target: A deeper correction.
Conclusion:
The indicators and volume profile suggest a bullish resolution. The stock is coiling, and the pressure is building. The smart money is waiting for the high-volume breakout above ₹415 for confirmation.
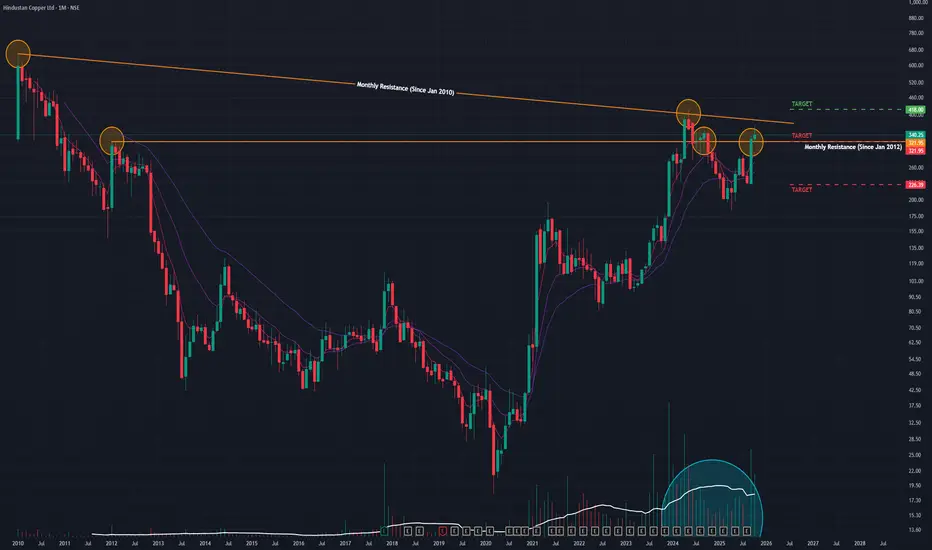
HindCopper (M): Very Bullish, but at a major inflection pointThe stock has successfully completed a multi-decade base breakout and is now challenging its final long-term resistance. The momentum is bullish, but a new ATH will require a confirmed break of the 2010 trendline.
📈 1. The Long-Term Context (The "Big Picture")
- Parabolic Uptrend: After hitting its all-time low in March 2020, the stock has been in a massive bullish uptrend, surging over 2,170% from its bottom.
- Brief Correction: This major move was followed by a healthy, brief downtrend/consolidation that found its low in May 2025, allowing the chart to reset for its next move.
- Recent Rising Volume: Critically, trading volume has been rising significantly in recent months, confirming strong investor interest in this new trend.
🚀 2. The Current Breakout (The Decisive Move)
The stock is currently navigating two of the most significant resistance levels on its multi-decade chart:
1. Jan 2012 Horizontal Resistance: A major structural level that capped all rallies for over 12 years.
2. Jan 2010 Angular Resistance: A long-term downtrend line that forms the final barrier to a new price discovery phase.
In September and October, the stock achieved a major milestone: it broke out and closed above the 12-year horizontal resistance line .
During October, the stock successfully retested this old resistance as new support . While it finished the month with a 3.28% gain on exceptionally high volume , it also formed an "inverted hammer" candle. This candle at a new support level is a sign of a "battle," where sellers tried to push the price down but buyers ultimately stepped in, defending the breakout.
📊 3. Key Technical Indicators
The underlying momentum on higher timeframes supports a bullish resolution:
- RSI: The Relative Strength Index is rising on the Monthly chart, indicating strong, sustained buying momentum.
- EMAs: The short-term Exponential Moving Averages are in a "PCO" (Price Crossover) state on the Monthly timeframe, confirming the long-term trend is powerfully bullish.
🎯 4. Future Scenarios & Key Levels to Watch
The stock is currently coiled less than 15% below its final angular resistance from 2010.
🐂 The Bullish Case (Final Breakout)
- Trigger: A decisive, high-volume breakout and close above the 2010 angular resistance trendline .
- Confirmation: This would confirm the start of a new, long-term bull market and put the stock into "blue-sky" price discovery.
- Target: The next logical technical price target is projected to be ₹415 , with a high probability of a move toward a new ATH.
🐻 The Bearish Case (Breakout Failure)
- Trigger: The stock fails to break the 2010 trendline and, more importantly, loses its new support (the 2012 breakout level).
- Confirmation: A high-volume close below the ₹320 support level.
- Target: This failure would signal a fake breakout and could lead to a sharp correction, retesting the next major support level at ₹225 .
Conclusion
This is a high-conviction breakout setup. The successful retest of the 12-year resistance is a very bullish sign. All eyes should now be on the 2010 angular trendline . A break above it would be the final confirmation, while a failure and drop below ₹320 would invalidate the immediate bullish thesis.
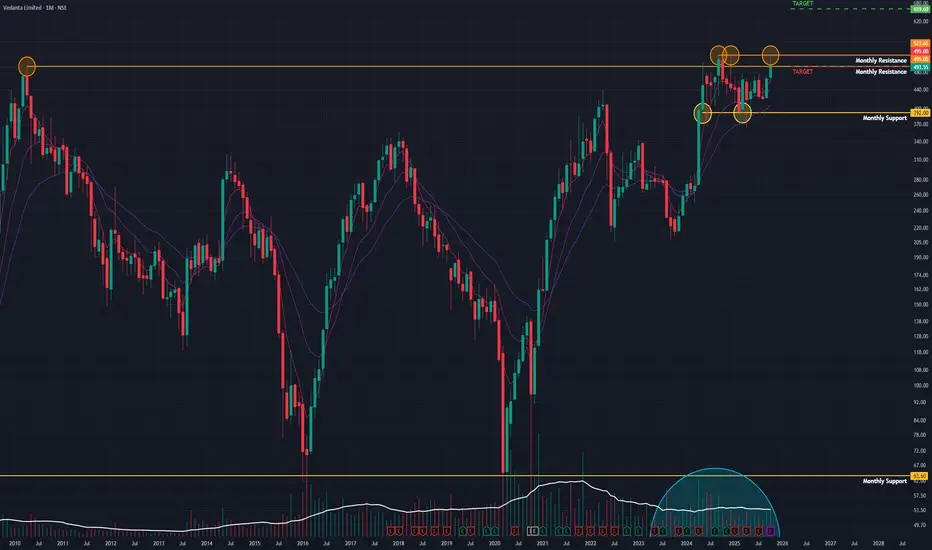
Vedanta (M): Bullish, but at a critical decision point.The stock is currently consolidating in a tight range after a historic, multi-decade breakout. The price is now coiling for its next major move. The key is whether the old resistance at ₹490 holds as new support.
📈 1. The Long-Term Context (The "Big Picture")
- Historic Breakout: After a long sideways trend, the stock finally broke its 14-year resistance line (dating back to April 2010) and subsequently set a new All-Time High (ATH) in December 2024.
- Consolidation Phase: Since that ATH, the stock has not rallied further but has entered a healthy sideways consolidation. This is a common pattern where a stock "digests" its massive gains and builds a new base.
- Failed Attempts: As you noted, there have been several attempts to break out of this new, smaller consolidation channel, but all have failed so far.
🔍 2. The Current Setup (The Decisive Range)
This consolidation has created two very clear levels that define the stock's next move:
- Short-Term Resistance: The ATH set in late 2024 (around Sep/Dec).
- Critical Support: The old long-term resistance level at ₹490 . This is the most important level to watch.
The recent surge this month ( +5.96% on 236.66 Million in volume ) was another test of the top of this channel, which was not yet successful.
📊 3. Key Technical Indicators
The underlying momentum supports a bullish resolution:
- RSI: The Relative Strength Index is rising, showing that buying strength is quietly building.
- EMAs: The short-term Exponential Moving Averages are in a "PCO" (Price Crossover) state, signaling positive momentum.
🎯 4. Future Scenarios & Key Levels to Watch
The price action in the coming days and weeks is critical. Monitor these two potential scenarios:
🐂 The Bullish Case (Continuation)
- Trigger: A decisive, high-volume breakout and close above the short-term resistance (the post-2024 ATH).
- Confirmation: This would confirm the consolidation phase is over and the next leg of the primary uptrend has begun.
- Target: The next logical price target is projected to be ₹650 .
🐻 The Bearish Case (Breakdown)
- Trigger: The breakout fails, and selling pressure pushes the stock below the critical support floor.
- Confirmation: A high-volume close below ₹490 . This would be a significant failure, as the "resistance-turned-support" level would have broken.
- Target: This breakdown would signal a deeper correction.
Conclusion
The bullish indicators (RSI, EMAs) combined with the recent high-volume surge suggest buyers are accumulating. The primary focus should be on the ₹490 level . As long as it holds, the bias remains bullish, and this is just a pause before the next rally to the ₹650 target.
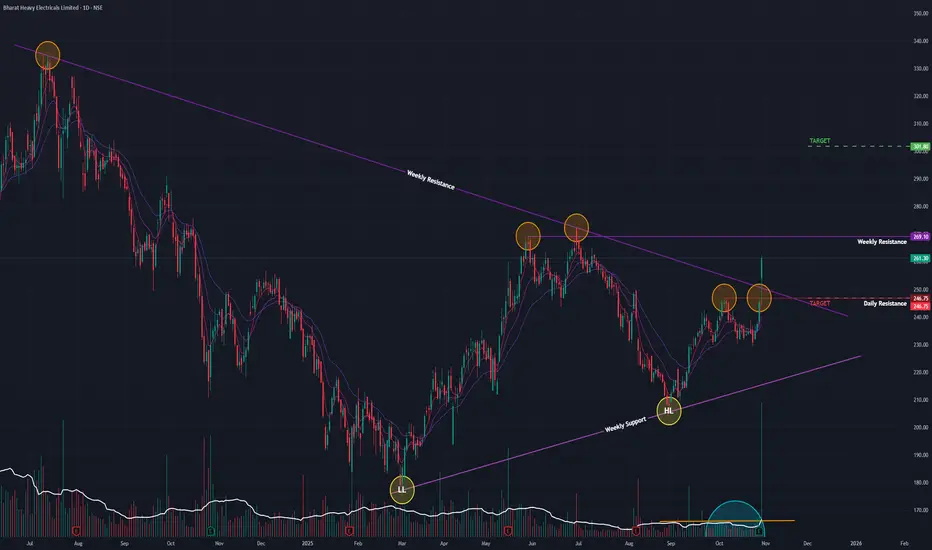
BHEL (D): Strongly Bullish, on a high-volume trendline breakoutThe stock has shown a significant character change, breaking a long-term corrective downtrend with exceptional force. All short-term and long-term indicators are aligning, suggesting a new bullish leg has begun.
📉 1. The Long-Term Context (The "Big Picture")
- Massive Run-Up: After a parabolic 1,720% surge from its March 2020 bottom, the stock hit a major peak in July 2024.
- Corrective Downtrend: This was followed by a healthy 8-month correction (Jul 2024 – Feb 2025), which allowed the stock to build a new base.
- Reversal Pattern: In recent months, the stock has reversed this trend by forming a clear pattern of Higher Lows , indicating that selling pressure has been absorbed and accumulation has taken place.
🚀 2. The Current Breakout (Today's Decisive Action)
Today's price action is the most significant bullish signal for the stock this year.
- High-Volume Surge: The stock surged +6.48% on massive volume of 75.43 Million shares, indicating strong institutional interest.
- Major Trendline Break: The price gapped up above the angular resistance trendline (formed since the July 2024 high) and, most importantly, closed firmly above it .
- Short-Term Breakout: This move also broke and closed above a minor, short-term resistance, adding to the bullish conviction.
📊 3. Key Technical Indicators
The underlying momentum across all timeframes supports this breakout:
- RSI: The Relative Strength Index is rising on the Daily, Weekly, and Monthly charts, showing broad-based, building momentum.
- EMAs: Short-term Exponential Moving Averages are in a "PCO" (Price Crossover) state on all three timeframes, confirming the trend is strongly bullish.
🎯 4. Future Scenarios & Key Levels to Watch
The path forward is now defined by two clear levels:
🐂 The Bullish Case (Breakout Confirmation)
- Immediate Hurdle: The next major test is the horizontal resistance at ₹265 .
- Confirmation: A decisive close above ₹265 would confirm the breakout and open the door for a significant rally.
- Target: If this momentum is sustained, the next logical price target is the ₹300 level.
🐻 The Bearish Case (Fake Breakout)
- Trigger: If today's move is a "fakeout," the price will fail to breach ₹265 and fall back below the broken angular trendline.
- Confirmation: A close back below the gap-up level (today's open) would be a bearish sign.
- Target: This failure would likely see the stock fall to retest its closest support at ₹245 .
Conclusion
Today's high-volume, gap-up breakout above a multi-month downtrend line is a powerful bullish event. The indicators are all aligned, suggesting this is the start of a new upward move. The key level to watch for confirmation is ₹265 .
MRPL (D): At a Critical ResistanceOverall Context and Current Setup
After reaching its all-time high in February 2024, MRPL entered a pronounced downtrend. However, a potential reversal has been forming since March 2025, marked by the stock establishing a clear pattern of Higher Lows .
The stock is currently challenging a critical, long-term horizontal resistance line that originated in October 2024. This level has repelled multiple breakout attempts in the past.
Today's Price Action
Today, the stock showed significant bullish intent, surging 4.26% on massive volume of 31.2 million shares . Despite this strength, the price action revealed a key struggle:
- The stock broke above the resistance line intraday but failed to secure a close above it. This indicates that significant selling pressure still exists at this level.
Bullish Indicators
Several indicators support a potential bullish breakout:
- Volume: Buying interest has been increasing, with surging volume over the past few days.
- SMA: A Golden Crossover (e.g., 50-day SMA crossing above the 200-day SMA) confirmed just three days ago, signaling potential long-term bullish momentum.
- EMAs: Short-term Exponential Moving Averages are in a positive crossover state (showing bullish alignment) across the Monthly, Weekly, and Daily timeframes.
- RSI: The Relative Strength Index (RSI) is rising on all three timeframes, indicating strengthening upward momentum.
Potential Scenarios
The current setup presents a classic conflict between strong bullish indicators and a powerful overhead resistance.
1. Bullish Scenario: The primary confirmation signal to watch for is a decisive daily close above the resistance line, supported by high volume. If the stock can achieve this, it would signal a confirmed breakout, with the next potential target near the 195 level .
2. Bearish/Consolidation Scenario: If the breakout fails and momentum wanes, the stock is likely to pull back. The most significant support level to watch would be at 138 , which aligns with the recent structure of higher lows.
Conclusion: The battle at this resistance line is critical. The price action in the coming days will be key to determining whether the bullish momentum is strong enough to finally break through or if the stock will reject this level once again.

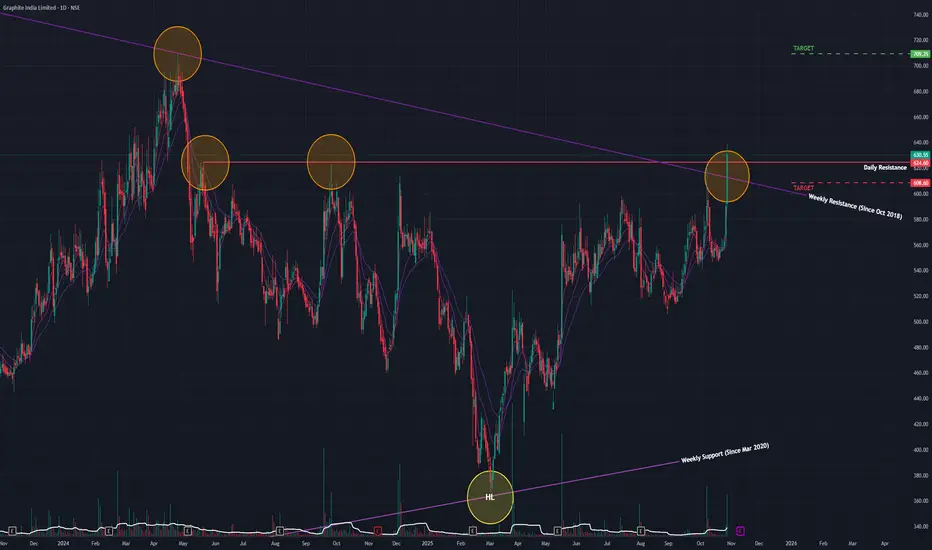
Graphite (D): Mighty Dual-Resistance Breakout Signals Major RevAfter being in a multi-year downtrend since its All-Time High (ATH) in August 2018, Graphite India (GRAPHITE) is showing compelling signs of a major trend reversal. Today's powerful price action has broken through two critical resistance levels, suggesting a new uptrend may be underway.
The Long-Term Bottoming Process
While the stock peaked in 2018, a very long-term bottoming process has been in place. Since April 2020, the stock has been forming a pattern of Higher Lows (clearly visible on the Monthly chart), indicating a gradual shift from supply to demand over the years. Although there was a more recent downtrend from May 2024, that appears to have reversed starting in March 2025.
Today's Decisive Dual Breakout
Today's session (Wednesday, October 29, 2025) was technically very significant:
- Strong Price Surge: The stock rallied by +6.82% .
- Massive Volume: The move was supported by a huge volume of 8.6 million shares , indicating strong buyer conviction.
- Dual Resistance Breach: In a powerful display, the stock broke out and closed above two key resistance levels simultaneously :
1. A long-term angular resistance trendline in place since October 2018.
2. A short-term horizontal resistance trendline formed since May 2024.
Breaking through a confluence of long-term and short-term resistance on high volume is a potent bullish signal.
Broad-Based Technical Strength
This breakout is strongly supported by a clear alignment of momentum indicators across all major timeframes (Monthly, Weekly, and Daily):
- Short-Term EMAs: All three timeframes are in a bullish Positive Crossover (PCO) state.
- RSI (Relative Strength Index): The RSI is also in a rising trend on all three timeframes.
Outlook and Key Levels to Watch
With this dual breakout, the technical landscape has shifted significantly in favor of the bulls.
- Bullish Target: If the stock can sustain this momentum, the next logical area of resistance and potential price target is the ₹709 level. The ideal confirmation, would be a successful re-test of the broken resistance zone followed by a bounce.
- Critical Support: If this breakout proves to be a "fakeout" and the price falls back below the broken resistance, the key support level to watch is ₹608 . A close below this would negate the bullish signal.
In conclusion, today's action represents a potentially major turning point for Graphite India. Confirmation via a successful retest would provide the highest confidence that a new long-term uptrend has begun.
Adani Green (D): Surges 10.79% But Fails at Key ResistanceAfter being in a downtrend since June 2024, Adani Green is showing clear signs of a potential trend reversal. Since March 2025, the stock has been building a bullish base by forming a constructive pattern of Higher Lows . However, this new uptrend is now facing its most significant test.
Today's Battle at Resistance
The stock's upward progress has been blocked by a major horizontal resistance trendline . Today's session (Wednesday, October 29, 2025) saw a powerful attempt to break this level:
- The stock surged by an impressive +10.79% .
- This move was backed by a very strong volume of 36.23 million shares .
Critically, despite the significant buying pressure, the stock was unable to close above this key resistance level , indicating that sellers are still actively defending this zone.
A Mixed Technical Picture
The technical indicators paint a picture of a new uptrend that is still fighting to confirm itself:
- Bullish Signals:
- The RSI (Relative Strength Index) is in a rising trend across the Monthly, Weekly, and Daily timeframes.
- A long-term SMA Golden Crossover has been in effect for the past month.
- Lagging/Cautionary Signals:
- The short-term EMAs have not yet formed a bullish Positive Crossover (PCO) state on the Daily and Monthly charts. This suggests the new uptrend is still in its early and unconfirmed stages.
Outlook and Key Levels to Watch
The stock is at a classic "prove it" moment. The battle at this horizontal resistance is the key.
- Bullish Scenario: A decisive, high-volume close above the resistance trendline is required to confirm the breakout and validate the new uptrend. If this occurs, the path could open for a move toward the *₹1,445 level.
- Bearish Scenario: If today's move was a "bull trap" and momentum fades, a rejection from this level could send the stock back to test its recent support, with a potential downside to ₹995 .
Given that the stock is attempting to reverse a significant downtrend, this resistance is a major hurdle. Caution is warranted until a successful breakout is confirmed with a strong daily close above the line.

Sai Silks (D): Confirms Major Breakout with Successful RetestAfter a long downtrend that ended in May 2025, Sai Silks (Kalamandir) has been in a clear trend reversal, establishing a constructive pattern of Higher Lows . This new uptrend has now achieved a significant technical milestone.
The Breakout and Confirmation
The stock's primary challenge was a long-term horizontal resistance trendline that had been in place since May 2024. This level has now been decisively cleared in a two-step process:
1. The Breakout (Yesterday): The stock successfully broke out and closed above this key resistance, signaling a major victory for the bulls.
2. The Confirmation (Today): Today, this breakout was put to the test. The stock gapped up at the open, but bears tried to push the price back down, resulting in a re-test of the old resistance line . In a very strong bullish sign, the level held. The stock closed positive at +2.28% on massive volume of 72.88 million shares, confirming that the old resistance has successfully flipped into new support.
Broad-Based Technical Strength
This powerful "Breakout and Retest" pattern is strongly supported by a complete alignment of momentum indicators. The short-term Exponential Moving Averages (EMAs) are in a Positive Crossover (PCO) state, and the Relative Strength Index (RSI) is rising across all three timeframes: Monthly, Weekly, and Daily .
This multi-timeframe alignment confirms that the underlying momentum is broad, synchronized, and strengthening.
Outlook and Key Levels to Watch
The successful re-test is a high-conviction signal that the primary trend has shifted and is poised to continue upwards.
- Bullish Target: If this bullish momentum continues, the next logical area of resistance and potential price target is the ₹270 level.
- Critical Support: The most immediate support level to watch is now ₹191 . A failure to hold above this level would be a cause for concern and would suggest the breakout has failed.

SBI Life (D): Breaks Consolidation, Now Faces All-Time High TestAfter a long consolidation phase that began in May 2025, SBI Life has delivered a decisive breakout. This move signals a potential end to the sideways action and a resumption of the primary uptrend, but it now faces its most significant hurdle.
1. The Breakout from Consolidation
Today's session (Monday, October 27, 2025) was a clear win for the bulls:
- The stock gapped up at the open, clearing the consolidation range's resistance.
- It surged to close with a gain of +3.44% on a solid volume of 2.87 million shares.
This action has propelled the stock to less than 2% below its major long-term resistance level formed by the All-Time High (ATH).
2. The Bullish Undercurrent
The potential for a successful breakout to new highs is strongly supported by a powerful alignment of momentum indicators across all major timeframes (Monthly, Weekly, and Daily):
- Short-Term EMAs: All three timeframes are in a bullish Positive Crossover (PCO) state.
- RSI (Relative Strength Index): The RSI is also in a rising trend on all three timeframes.
This multi-timeframe alignment shows a broad and synchronized bullish momentum building under the key ATH level.
3. A Critical Warning: The "Bull Trap" Scenario
As you've insightfully noted, a breakout to a new high is not automatically a "buy" signal. A critical "what-if" scenario must be monitored closely, as the price is approaching a level that could form a Double Top or Triple Top (a bearish reversal pattern).
Traders should watch for these two warning signs at the ATH level:
1. Bearish Divergence: The price pushes to a new high, but the RSI fails to, creating a lower high. This is a classic sign of weakening momentum.
2. Low Volume: The breakout occurs on low or unconvincing volume, suggesting a lack of genuine conviction from institutional buyers.
If this combination occurs, it would signal a high probability of a "bull trap" and a potential bearish reversal.
Outlook
This is a time for patience and careful observation. The stock has broken its immediate resistance but now faces the final boss. Before any action, the key is to wait for the price-action at the All-Time High.
A failed breakout with divergence would be a bearish signal. A confirmed , high-volume breakout would be the true signal that the uptrend is resuming.

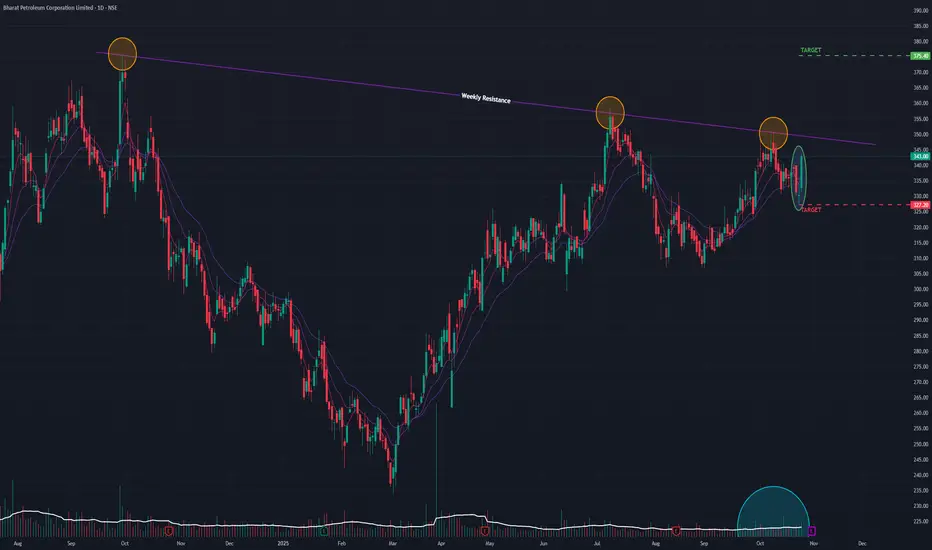
BPCL (D): Forms Bullish MorningStar, Challenges Major ResistanceAfter reversing from a short-term downtrend, BPCL (Bharat Petroleum Corporation Ltd) has flashed a powerful bullish signal. However, this newfound momentum is now running directly into a major, long-term resistance trendline that has capped its progress, setting the stage for a critical battle.
The Bullish Setup: A Morning Star at Support
Today's price action (Monday, October 27, 2025) was highly constructive for the bulls:
- Price & Volume Surge: The stock rallied +3.80% on a strong volume of 11.77 million shares .
- Classic Reversal Pattern: This move completed a "Morning Star" candlestick pattern . This is a classic three-candle bullish reversal pattern that often signals the bottom of a downtrend and a new shift in momentum.
Broad-Based Technical Strength
This bullish pattern is strongly supported by a powerful alignment of indicators across all major timeframes (Monthly, Weekly, and Daily):
- Short-Term EMAs: All three timeframes are in a bullish Positive Crossover (PCO) state.
- RSI (Relative Strength Index): The RSI is also in a rising trend on all three timeframes.
This multi-timeframe alignment indicates that the underlying momentum is broad, synchronized, and strengthening.
The Immediate Hurdle: Long-Term Resistance
Despite these bullish signals, the stock is now positioned less than 2% below a major long-term resistance trendline formed since its All-Time High. This line represents a significant historical barrier for the stock.
Outlook and Key Levels to Watch
The stock is at a clear "prove it" moment. The outcome of the battle at this resistance will likely determine the next major move.
- Bullish Breakout Scenario: A decisive close above the long-term resistance on high volume would confirm the breakout and validate the Morning Star pattern. This would signal a continuation of the new uptrend, with a potential next target of ₹375 .
- Bearish Rejection Scenario: If the stock fails to breach this resistance and momentum fades, it could be rejected. The first key support level would be the bottom of the Morning Star pattern, around ₹325 .
In conclusion, the price action in the coming days is critical. All eyes should be on this key resistance level for either a confirmed breakout or a rejection.
IDFC First (D) - High-Volume Breakout Confirms Bullish ReversalAfter a significant downtrend from its All-Time High in September 2023, IDFC First Bank has been in a clear trend reversal since April 2025. This new uptrend has just been powerfully confirmed by a high-volume breakout, signaling strong buyer commitment.
This Week's Decisive Breakout
The past week has been pivotal for the stock, culminating in a decisive technical event:
- Massive Weekly Volume: The stock has surged +9.85% so far this week, supported by an enormous total volume of 207.92 million shares .
- Today's Confirmation: Today's session (Thursday, October 23, 2025) saw a +2.85% gain on a massive 94.12 million shares, confirming the bullish conviction.
- Key Resistance Breach: Most importantly, the stock broke out and closed above a key short-term horizontal resistance trendline that had been in place since July 2025.
Broad-Based Technical Strength
This bullish price action is strongly underpinned by a powerful alignment of momentum indicators across all major timeframes (Monthly, Weekly, and Daily):
- Short-Term EMAs: All three timeframes are in a bullish Positive Crossover (PCO) state.
- RSI (Relative Strength Index): The RSI is also in a rising trend on all three timeframes.
This multi-timeframe alignment indicates that the bullish momentum is broad, synchronized, and strengthening.
Outlook and Key Levels to Watch
With the resistance now cleared, the path of least resistance has shifted upwards.
- Bullish Target: If this bullish momentum continues, the next logical area of resistance and potential target is the ₹90 level.
- Critical Support: The recently broken resistance now becomes the most critical new support level. A successful retest of this level would be a strong sign, while a failure to hold it would be a warning. A deeper support level exists at ₹70 , but the immediate focus should be on the new breakout zone.

Bank of India (D) - Breakaway Gap Signals New MomentumAfter a severe, decade-long downtrend from its All-Time High in September 2010, Bank of India has been in a slow and steady reversal phase since June 2020. This bottoming process has become more evident since June 2022, with the stock consistently carving out a bullish structure of Higher Lows , indicating a gradual shift in control from sellers to buyers.
Today's Decisive Breakaway Gap
Today's session (Thursday, October 23, 2025) provided a powerful confirmation of this new strength. The stock surged +4.05% on huge volume of 22.05 million shares.
Crucially, this move was a breakaway gap , with the stock opening above a key short-term horizontal resistance trendline and closing strong. Gapping and closing above a significant resistance level on high volume is a very strong bullish signal, indicating aggressive buyer commitment.
Broad-Based Technical Strength
This bullish price action is strongly supported by a clear alignment of momentum indicators across all major timeframes (Monthly, Weekly, and Daily):
- Short-Term EMAs: All three timeframes are in a bullish Positive Crossover (PCO) state.
- RSI (Relative Strength Index): The RSI is also in a rising trend on all three timeframes.
This multi-timeframe alignment confirms that the underlying momentum is broad, synchronized, and strengthening.
Outlook and Key Levels to Watch
With the short-term resistance now cleared, the stock has two key levels to monitor:
- The Next Hurdle (Resistance): The stock is still "well below" its primary long-term horizontal resistance line. This is the next major obstacle to clear.
- Bullish Target: A successful, high-volume breakout above that long-term resistance would confirm a major, multi-year trend reversal and open the path towards the ₹150 level.
- Critical Support: The recently broken short-term resistance, around ₹130 , is now the most critical support level to watch. As long as the stock holds above this "line in the sand," the immediate bullish momentum remains intact.
In conclusion, today's gap-up is a significant development, but the stock must now prove it can overcome the far more significant long-term resistance to complete its multi-year reversal.

JK Tyre (D) - Bullish Reversal Coils for Breakout AttemptAfter a significant downtrend from its All-Time High in February 2024, JK Tyre has successfully reversed its trend. Since March 2025, the stock has been establishing a constructive pattern of Higher Lows , indicating a clear and systematic shift from selling pressure to accumulation.
Current Standoff: Coiled Below Resistance
The stock is currently trading just below a significant overhead resistance level. This horizontal barrier is the primary hurdle that needs to be cleared to confirm the next leg of the uptrend.
Notably, the trading volume has been moderate , which is not a negative sign in this context. It is often characteristic of a "coiled spring" or an accumulation phase just before a decisive breakout, as selling pressure diminishes.
Powerful Underlying Strength
The bullish case is strongly supported by a powerful alignment of momentum indicators across all major timeframes (Monthly, Weekly, and Daily):
- Short-Term EMAs: All three timeframes are in a bullish Positive Crossover (PCO) state.
- RSI (Relative Strength Index): The RSI is also in a rising trend on all three timeframes.
This multi-timeframe alignment indicates that the bullish momentum is broad, synchronized, and strengthening, suggesting that an attempt to break the overhead resistance is likely.
Outlook and Key Levels to Watch
The stock is at a clear inflection point. The resolution of the battle at this resistance level will likely determine the next major move.
- Bullish Scenario: A decisive close above the resistance on high volume would confirm the breakout. This would signal a continuation of the new uptrend, with a potential next target of ₹485 .
- Bearish Scenario: If the stock fails to breach the resistance and momentum fades, it could be rejected and pull back to test levels around ₹370 .

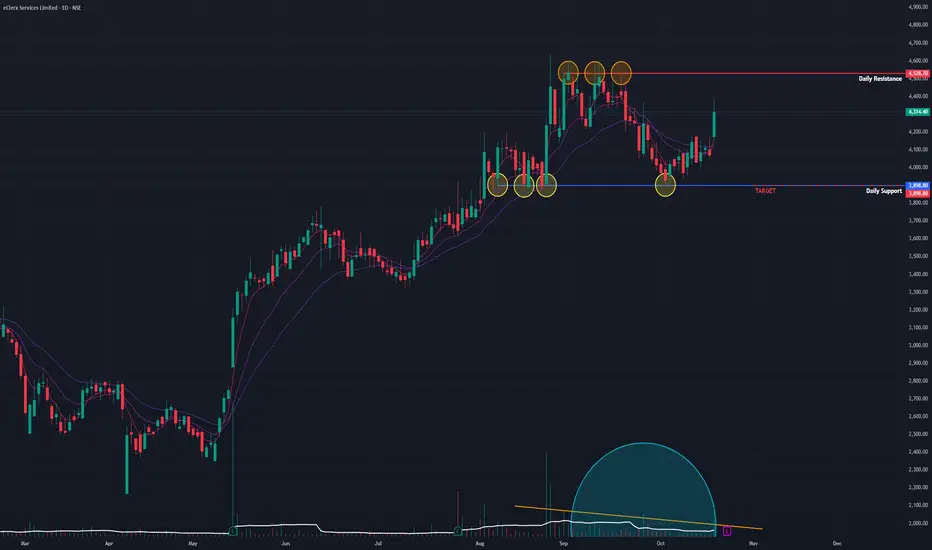
eClerx (D) - Gathers Momentum for All-Time High BreakoutAfter a lengthy consolidation phase, eClerx Services is showing strong signs of renewed bullish momentum, positioning itself for a potential breakout to new all-time highs.
The Context: A Healthy Consolidation
Since reaching its All-Time High (ATH) in April 2025 , the stock has been trading within a well-defined sideways range, consistently respecting the upper resistance and lower support trendlines. A key bullish characteristic of this consolidation phase has been the noticeable drying up of trading volume , which typically suggests that selling pressure is exhausted and the stock is gathering energy for its next move.
Today's Bullish Action
Today's session (Monday, October 20, 2025) saw a significant surge in buying interest:
- The stock rallied by +6.01%.
- This move has brought the price to within 5% of the critical horizontal resistance level formed by the ATH.
This action suggests that buyers are becoming more aggressive and are preparing to challenge the upper boundary of the consolidation range.
Underlying Technical Strength
The potential for a breakout is strongly supported by key momentum indicators across all major timeframes (Monthly, Weekly, and Daily):
- The Relative Strength Index (RSI) is in a rising state.
- The short-term Exponential Moving Averages (EMAs) are in a bullish positive crossover state.
These signals indicate a broad and strengthening underlying trend that could fuel a successful breakout.
Outlook and Key Levels to Watch
The immediate path for the stock hinges on its ability to overcome the ATH resistance.
- Bullish Scenario: If the current momentum continues and the stock achieves a decisive, high-volume close above the horizontal resistance , it would confirm a breakout. This would signal a continuation of the primary uptrend, with a potential next target of ₹5,150 .
- Bearish Scenario: If the stock fails to break out and momentum fades, it will likely be rejected from the resistance and could fall back to test the lower support of the consolidation range, around the ₹3,900 level.
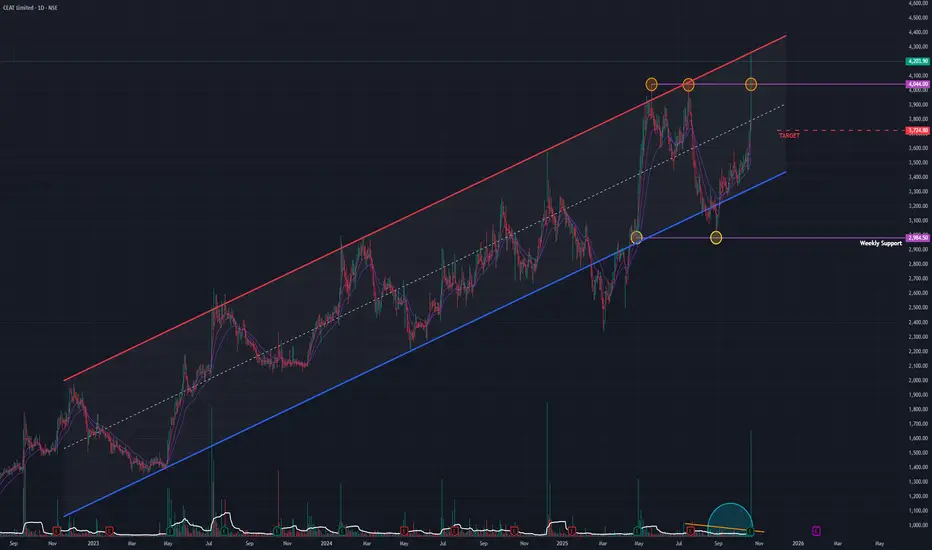
CEAT (D) - Critical Crossroads: Breakout vs. Channel ReversalAfter a multi-year uptrend, CEAT Ltd has arrived at a major inflection point. While it has broken a key horizontal resistance and hit a new all-time high, it has also run into the upper boundary of a long-term channel, a point that has historically marked a reversal. This creates a classic standoff between two powerful technical signals.
The Bullish Case: The Breakout
The primary argument for the bulls is the recent show of strength and the clearing of a significant hurdle:
- New All-Time High (ATH): The stock has successfully pushed into new territory, which is an inherently bullish sign.
- Horizontal Breakout: It has decisively broken out and closed above the horizontal resistance line formed by both the previous ATH and the upper limit of its recent consolidation phase.
- Consolidation & Dry Volume: Prior to this move, the stock was in a healthy consolidation phase since April 2025, during which volume was drying up . This is a classic sign that selling pressure was diminishing, often setting the stage for an upward move.
The Bearish Case: The Channel Resistance
Despite the breakout, the stock is still operating within the rules of a much larger, long-term pattern:
- The Parallel Channel: Since April 2020, the stock has been trading within a well-defined ascending parallel channel . It has consistently respected the upper trendline as a point of strong resistance and the lower trendline as support.
- Rejection at the Top: Today, by hitting its new ATH, the stock has also simultaneously hit the upper resistance trendline of this channel . Historically, every time the price has reached this boundary, it has reversed and trended back down towards the channel's support.
Conclusion and Key Scenarios to Watch
The price action in the next few trading sessions is critical and will likely resolve this technical conflict.
- Bullish Breakout Scenario: For the uptrend to accelerate, the stock must do something it has never done: achieve a decisive, high-volume close above the upper trendline of the parallel channel . If this occurs, it would invalidate the channel pattern and could signal a powerful new leg up, with a potential target of ₹5,100 .
- Bearish Reversal Scenario: If history repeats itself and the channel resistance holds, the stock will likely be rejected from this level. A failure to stay above the recent horizontal breakout would be the first sign of weakness, potentially leading to a reversal back down to the channel's median, around the ₹3,725 level.
In short, the market is at a "prove it" moment. The bulls have broken a minor resistance, but the bears are defending a major long-term boundary. The winner of this battle will likely dictate the trend for the coming months.