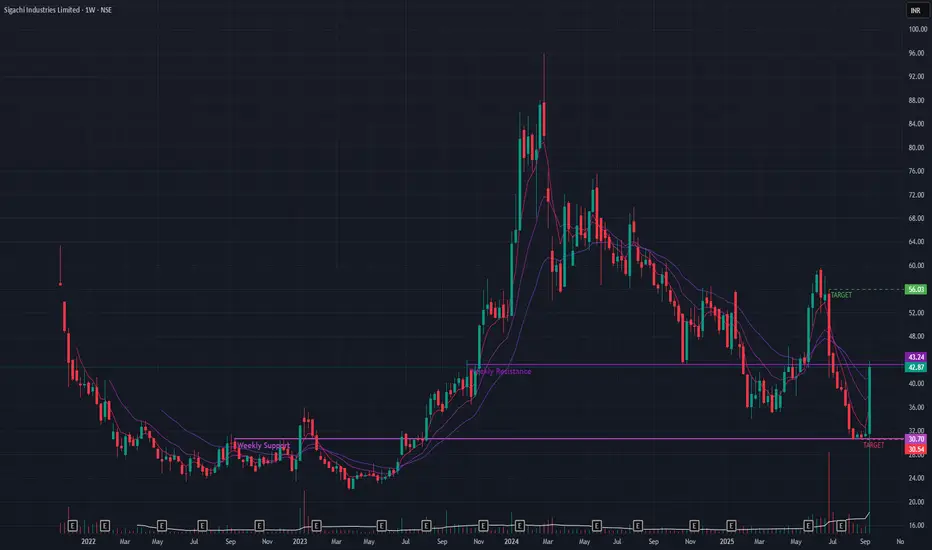
Sigachi Ind (Weekly Timeframe) - Is this the trend reversal?After a period of decline following its February 2024 peak, Sigachi Industries has shown a dramatic burst of momentum. However, the stock has now reached a critical juncture, and confirmation is required to suggest a sustainable trend reversal.
## Recent Price Action
A massive +36.27% rally last week, backed by exceptionally high volume , has put the stock back on the radar. This surge has pushed the price directly against a significant long-term resistance trendline . A breakout above this level would be a major technical victory for the bulls.
## Cautionary Signals to Consider
Despite the powerful rally, several indicators suggest a "wait-and-see" approach:
Trend Confirmation: The stock has not yet formed a higher low , a key technical signal required to confirm a reversal from a downtrend to an uptrend.
EMA Posture: The short-term Exponential Moving Averages (EMAs) have not yet achieved a Positive Crossover (PCO) . This indicates that the recent surge, while strong, has not yet been sustained long enough to reverse the short-term trend momentum.
## Key Levels and Outlook
The stock is at a clear decision point.
Bullish Scenario: A decisive breakout above the current resistance trendline, again on high volume , would be a strong bullish signal. If this occurs, the next potential upside target is the ₹56 level.
Bearish Scenario: If the stock fails to breach this resistance and the momentum fades, it could fall back to test support near the ₹30 level.
Wait for further price-action !!
Potentialreversalzone
Breakout Potential After Trendline BreakA possible breakout is expected once the price breaks through a key trendline. This strategy focuses on identifying significant trendlines formed by price highs or lows. When the price breaches this trendline, it could signal a change in market direction, indicating a potential breakout. Traders should monitor volume and other indicators to confirm the breakout's strength before taking action.

Hindustan Zinc Time to Buy???Hindustan Zinc (HINDZINC) Analysis 🚀
After a Stage 2 breakout from ₹410 levels, the stock skyrocketed to ₹810, delivering a remarkable 100% return within a month. However, it has now retraced to its previous breakout zone of ₹410-₹415, signaling a potential Stage 4 decline.
Currently, the stock is trading near the previous breakout zone, and two scenarios are in play:
Scenario 1: Potential Double Bottom/W Pattern Formation
If the stock forms a Double Bottom/W pattern and breaks out of the trendline, it could turn into a promising swing trade candidate.
Entry: ₹482 (Safe traders can wait for a close above this level).
Targets:
T1: ₹575 (+19.5%, RR 1:1.23)
T2: ₹716 (+48%, RR 1:3)
T3: ₹810 (ATH, +68%, RR 1:4)
Stop Loss: ₹410 (-16%)
💡 Why watch this scenario?
The Risk-Reward ratio is favorable, and the breakout could indicate strength. If you feel compelled to trade, adding small quantities around the previous breakout levels of ₹410 could be a safer bet. Add only Test Quantities.
Scenario 2: Breakdown Below ₹411
If the stock breaks below ₹411, it could re-enter the previous breakout base, with potential downside targets of ₹350-₹325. In this case, shorting opportunities might arise, but only if market sentiment aligns.
Technical Overview 🔍
The stock is trading well below all key DMAs, indicating weakness.
The Lower High-Lower Low (LH-LL) structure is intact with no signs of reversal yet.
Overall market trend: LH-LL and trading below the 200 DMA. Any bounce could just be a natural pullback.
Fundamentals 🧐
Hindustan Zinc recently posted decent quarterly results, but the broader market trend and technicals should guide your decisions here.
Risks & Sugestions ⚠️
Risk Management: With a 16% risk on SL, position sizing is crucial. Avoid committing big capital without proper confirmation.
Market Context: Be wary of overall market trends, as the broader market is still weak.
Emotional Trading: Don’t get tempted by sudden spikes in the market. Always wait for confirmation.
👉 Pro Tip: Missing an opportunity is better than burning your capital. Start small to gauge strength before scaling your position.
Educational Takeaway ✍️
This stock offers a good learning opportunity for breakout and retracement patterns. Add it to your watchlist but focus on risk management and position sizing.
Disclaimer: This analysis is for educational purposes only. Consult your financial advisor before making any investment decisions.

Whirlpool of India - A Long Term Investment StockIn this Monthly chart wave (1) is completed at 2787 and wave achieved its minimum retracement range....If wave (2) is already completed at 1186 then wave (3) is already started and may achieve given targets of wave (3) in upcoming months or so....but if wave (2) is still in progress then 1458--927 support(buying) range for the stock....

ICICIBANK - LONG TERM - HARMONICSPotential Bullish butterfly yet to complete.
PRZ marked with the completion of the above-mentioned pattern. Also, potential targets on the CD retracement are marked with fib retracement plot.
Security is in a bearish trend as 20 EMA is trailing below 50 & 100 EMA on daily TF.

KPIT TECH - LONG TERM - HARMONICSPotential Bullish butterfly yet to complete.
PRZ marked with the completion of the above-mentioned pattern.
Also, potential targets on the CD retracement are marked with fib retracement plot.

ASTEC LIFESCIENCES - LONG TERM - HARMONICSPotential Bullish AB=CD harmonic pattern.
Resistance marked basis on current swings fib retracement. Supports marked on the basis of Fib extensions.
If 1538 is broken, next support will be 1493.

ION EXCHANGE - LONG TERM - HARMONICBullish gartley pattern completed on daily TF. Potential targets on reversal marked with Fib retracement of CD leg.
Also, a major demand zone is present at reversal levels. Stochastic RSI and RSI 14 indicate reversal too.

Pidilite - Long Term - HarmonicPotential PRZ of 2200 based on latest retracement and Fib extensions. Also, the Potential Bullish bat pattern shows PRZ in the vicinity of 2200.

SELF EXPLANATORY SERIES : QUICK ANALYSIS ON CEBBCO.In this self explanatory series I will be posting charts with pure technical analysis only without full length explanations , Traders can ask their doubts in comments section, Happy trading.
Disclaimer : This idea was to just give you an insight about my own view and personal observations. Please do your own research or consult an investment advisor before doing any investment or trading.

WATCHOUT FOR THE CLOSING ABOVE 190!!!Once the stock closes over 190 it may look to test the higher levels, it even has the potential to go past the all time high levels. Rerating lies ahead of this stock so a strong buy is recommended once it fulfills the conditions.

A possibile Sharp Fall!! - Bearish Butterfly & Broadening WedgeExpecting TVC:USOIL to go for a sharp correction.
Harmonics 4-point & 5-point pattern helped identify a Potential Trend Reversal Zone, where bullish movement may end & trend may reverse.
Got a terminal candle confirmation in the PRZ.
Also, in a broader view prices formed a Broadening Wedge Pattern (a-b-c-d-e wave structure) which might possibly be a B-wave in an A-B-C Correction Wave pattern.

BULLISH CYPHER & Double BottomNSE:KEI has taken support around the Harmonic PRZ & Trend has reversed.
After a sharp fall, price formed a Double Bottom Pattern & near Breakout.
If it breaks above 350, expecting a 10% up movement

Bullish Crab Reversal ZoneStock currently taking support near the PRZ & expecting a trend reversal in the coming sessions.

Bullish BAMM & Gartley Pattern formationPrice has broken previous high & moving upside strongly. Expecting a +10% movement.


Bullish Crab - Expect upside moveTrend reversal after taking support around the PRZ. Expecting good upside after price breaks 38.2% resistance level the coming day.

Bullish Shark - Potential Trend Reversal ZoneNG may turn bullish if it takes support in this PRZ. With proper confirmation we can go long, else if pattern gets violated; GO with the existing trend.
Updated previous charts PRZ, as it was violated.

Bullish Shark - Bullish Trend ReversalTaking support around the PRZ of the Bullish Shark Pattern.
Expecting a trend reversal from these levels.

Bullish Gartley Harmonic patternStock may face correction upto 2100 levels, and then expecting a Bullish trend reversal from PRZ.

BEARISH GARTLEY If price starts consolidating in the PRZ, Expecting a correction movement.
If PRZ is broken by strong Price Action in the coming day, go long.

Bearish Bat & Wolfe WaveExpecting price to consolidate in the PRZ region and go for a correction.
Possibilities of a Bearish Wolfe Wave formation exist.

Nifty: A Deeper EW CountIn my previous post on Nifty I observed that we are in a possible wave iii of the larger 5th. See below...
We have been correcting from the 'double up' level mentioned in that post and a casual look at the chart has been yelling the beginning of wave iv.
But a deeper EW count has been telling something else to me. I know that there could be many conflicting counts on this chart but this one is the most preferred by me.
This analysis is for a sub-wave which starts from 10033. According to this count we are in wave (iv) of this sub-wave. I have drawn a Potential Reversal Zone (10430-10605) which may offer a nice buying opportunity. If this count is correct, we 'll reverse from this zone and resume the uptrend of wave iii of 5th (see previous post for clarity on wave iii and 5th).
Remember that this count would fail below 10405, so this can be taken as stop-loss level.
Trade Safe
Keep liking for better ideas.
Regards
Bravo
