Fintechzoom Bitcoin Price and Forecast AnalysisThe current price of Bitcoin is influenced by a specific market structure characterized by key technical indicators:
Blue Lines : Representing a fan-like pattern diverging to the right, these lines serve as dynamic levels of support and resistance. Their role can shift depending on market momentum, influencing the price direction of Bitcoin.
Red Arcs : These arcs exert downward pressure on Bitcoin’s price. However, historically, once these arcs are breached, Bitcoin tends to experience a rally.
Since late July, the far-right red arc has been exerting significant downward pressure on Bitcoin's price. On the other hand, the blue line, located around the $55,000 mark, may offer substantial support from below.
The key to Bitcoin’s price trajectory in early autumn lies in the battle between this red arc’s downward force and the support from the blue line. Should Bitcoin manage to break above the red arc, we could witness a strong upward movement.
Given the significant trading volumes observed on August 5th, which I interpret as a shakeout of weak market participants, my primary forecast suggests that Bitcoin is likely to break through the red arc and rise in value.
My Wave Analysis also supports this bullish outlook, indicating a potential rise within the framework of the fifth wave.
FAQ
What price will Bitcoin reach in 2030?
While it's difficult to pinpoint an exact figure, various expert predictions suggest Bitcoin could reach anywhere from $500,000 to $1,000,000 by 2030, depending on adoption rates and macroeconomic factors.
How much is $100 Bitcoin worth right now?
To determine the current value, multiply $100 by the current Bitcoin price, which fluctuates constantly. For example, at a Bitcoin price of $30,000, $100 worth of Bitcoin would be approximately 0.0033 BTC.
How much is Bitcoin selling today?
Bitcoin’s price is dynamic, but as of today, it is trading around $58k.
Will Bitcoin rise again?
Yes, most analysts believe Bitcoin will rise again, driven by increasing institutional adoption, macroeconomic trends, and technological advancements within the blockchain space.
Prediction

Double Bottom pattern breakout in AUBANKAU SMALL FINANCE BANK LTD
Key highlights: 💡⚡
✅On 1 Hour Time Frame Stock Showing Breakout of Double Bottom Pattern.
✅Strong Bullish Candlestick Form on this timeframe.
✅It can give movement up to the Breakout target of 670+.
✅Can Go Long in this Stock by placing a stop loss below 640-.

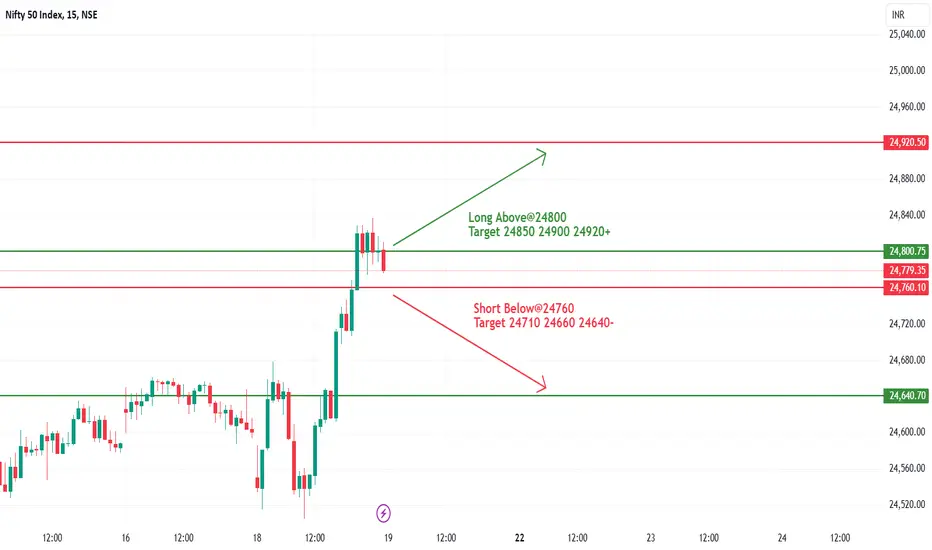
#NIFTY Intraday Support and Resistance Levels -19/07/2024Nifty will be gap up opening in today's session. After opening nifty sustain above 24800 level and then possible upside rally up to 24920 level in today's session. in case nifty trades below 24760 level then the downside target can go up to the 24640 level.
Bullish Flag pattern breakout in BATAINDIABATA INDIA LTD
Key highlights: 💡⚡
✅On 1 Day Time Frame Stock Showing Breakout of Bullish Flag Pattern.
✅Strong Bullish Candlestick Form on this timeframe.
✅It can give movement up to the Breakout target of 1630+.
✅Can Go Long in this Stock by placing a stop loss below 1432-.

Falling Wedge pattern breakout in BAJAJFINSBAJAJ FINSERV LTD
Key highlights: 💡⚡
✅On 1 Hour Time Frame Stock Showing Breakout of Falling Wedge Pattern.
✅Strong Bullish Candlestick Form on this timeframe.
✅It can give movement up to the Breakout target of 1631+.
✅Can Go Long in this Stock by placing a stop loss below 1591-.

Descending Channel pattern breakout in MFSLMAX FINANCIAL SERVICES LTD
Key highlights: 💡⚡
✅On 1 Day Time Frame Stock Showing Breakout of Descending Channel Pattern.
✅Strong Bullish Candlestick Form on this timeframe.
✅It can give movement up to the Breakout target of 1080+.
✅Can Go Long in this Stock by placing a stop loss below 937-.

[INTRADAY] #BANKNIFTY PE & CE Levels(06/06/2024) Today will be gap up opening in BANKNIFTY. After opening if banknifty sustain above 49050 level then possible upside rally of 400-500 points upto 49450 level & this rally can extend another 400 points if market gives breakout 49550 level in todays session. Any Major downside only expected in case banknifty starts trading below 48950 level. also possible reversal downside 49450 level.

NIFTYNXT50-NIFTYJR Intraday Prediction Levels for 24 April 2024The chart indicates 15 min time frame. These Levels act as Support and Resistance according to position of price. These are strictly for Intraday Trading only. Execution only after break out and close above the Resistance zone or break down and close below the Support zone.
These levels act as support and resistance. You have to trade according to level breakout or breakdown.
To buy or sell you can follow Buy/Sell Indication given by indicator or you can follow cloud also.
If you are a new trader then just watch (No Trade) these levels for some days.
Happy trading.
Disclaimer:
I am not a SEBI Registered Analyst. Anything posted here is my own analysis and views. This is created for educational purposes only. Always consult with your Financial Advisor before taking any decision or trade.

Bank Nifty prediction for MondayThere seems to be a strong support by the bulls, to not let the index go down, but the last session was week for the bulls. as of today BNFTY maintained a good support given by 48500 level. Monday opening will be a gap down as those holding wants to exit at the earliest. but bulls will hold it from falling by 9:50 am.
there is a support around 48300 level. Hence, by 9:50 am Monday, Index will touch 48280 and from there will be flat till 11:00 am, and start rising to close at 48700 and On Tuesday a Gap up to close beyond 48010 level as that is the expiry day.

INDOSTAR Analysis & PredictionThis is the analysis of INDOSTAR in Weekly Time Frame. Watch carefully. The chart explains itself.
The stock managed to break the long term resistance with increasing volume. It can retest the breakout level. If it will sustain above the breakout level, it is good for the stock. Generally Multiyear Breakout is a bullish signal for stocks.
There are some prediction levels. These Levels act as Support and Resistance according to position of price. You have to trade according to level breakout or breakdown.
Always maintain your risk management.
Book your profit according to your “STOMACH”.
Disclaimer:
This is not investment advice. I am not a SEBI Registered Analyst. Anything posted here is my own analysis and views. This is created for educational purposes only. Always consult your Financial Advisor before taking any decision or trade.
Happy trading.
About INDOSTAR :
Indostar Capital Finance Ltd. engages in the provision of lending used and new commercial vehicles. It operates through the following segments: Corporate Lending, Small and Medium Enterprises Lending, Commercial Vehicle Lending, and Housing Finance. The company was founded by Atul Kapur and Sameer Sushil Sain in July 21, 2009 and is headquartered in Mumbai, India.

BAJ AUTO ready for NEW ALL TIME HIGHBAJ AUTO ready for NEW ALL TIME HIGH
Baj Auto is following good Price Action. wait for Trendline Breakout for New All Time High
Follow Chart For Levels

BankNifty following Trenline SupportBankNifty following Trenline Support since 12th FEB
Good Till Sustain above Trendline
if Broken then Short below Trenline for Target,
T1 45664
T2 44633

"Nifty Tomorrow: Unveiling the Crystal Ball of Market PredictionIf Nifty maintains above 12,960, it signals a bullish breakout, but if it falls below 12,630, it could trigger selling pressure until 12,270. Keep a close watch on the one-hour candle closing.

Nifty Idea 09-02-2024as you can see from the chart nifty is respecting the support area
it needs to break the zone in the hourly frame for a new down move.

EIHOTELThis is the chart of EIHOTEL Ltd, the stock has given a breakout on weekly timeframe and can continue its bull run further. I am Bullish on the stock for targets of 368, 400, 430, 460
Stoploss - 318
Only for Educational Purpose
Do your own research.

Gold Outlook 2024:Analyzing Bullish Trends, Key Resistance LevelBullish Bias:
Weekly chart indicates a bullish bias for Gold.
Relative Strength Index (RSI) comfortably above 50.
RSI-based 20-period Moving Average provides additional support.
XAU/USD remains within the upper half of a long-term ascending regression channel.
Key Levels:
Interim resistance at $2,060 with 61.8% Fibonacci trend-based extension.
Confirmation of support at this level could lead to a test of $2,125-$2,150.
Potential profit-taking in this range may temporarily impede the uptrend.
Further bullish targets at $2,200 and $2,440 based on Fibonacci extensions.
Sustaining above $2,200 is crucial for continued buyer interest.
Downside Support:
Strong support at $1,960-$1,950, including the 20-week SMA, 50-week SMA, and mid-point of the ascending regression channel.
Failure at this support could lead to a decline to $1,880 (100-week SMA) and $1,850 (200-week SMA).
Weekly close below $1,850 may attract additional sellers, opening the door for a move toward $1,800 (lower limit of the ascending regression channel).
Summary:
Gold is bullish with potential resistance at $2,060 and further targets at $2,125-$2,150, $2,200, and $2,440. Strong support is seen at $1,960-$1,950, and a failure could trigger a decline towards $1,880 and $1,850, with $1,800 as a lower limit.
Investors should monitor key levels for potential trend continuation or reversal, and the sustainability of support and resistance levels is crucial for determining the next directional move in the Gold market.

Simple Bank Nifty Analysis!Buyers Showing strength but still facing Resistance at 43700 to 43800. If sustain above 43850 then good move is expected or a gap up opening.
Trendline Support at 43650 to 43680
Key level 43580 keep eyes on it if trade below then may sellers gets active more.
BN made a V shaped recovery from last fall but very slowpace then selling.
Note : Do your own analysis before making any trade or investment.

Bitcoin Price Prediction 2025Bitcoin (BTC)
Price: $37,829.17 USD
Price: 18.15 ETH
1hr Change: 0.17%
24hr Change: 1.14%
7d Change: 4.02%
Volume: $22,694,872,312.93
Market Cap: $739,648,195,822.46
Circulating Supply: 19,552,325.00
Total Supply: 19,552,325.00
The price of Bitcoin is $37,758. It has a 24-hour trading volume of $77.41 billion, a market capitalization of $738.25 billion, and holds 50.91% of the market dominance. Over the last 24 hours, Bitcoin’s price has increased by 1.06%.
Bitcoin’s highest value was on November 10, 2021, when it reached $68,770. Its lowest-ever price was on July 17, 2010, at just $0.05. Since its all-time high, the lowest it has fallen to is $15,599, while the highest it has reached after that low point was $38,407.
Currently, the market sentiment towards Bitcoin is bullish, and the Fear & Greed Index indicates a score of 73, suggesting ‘Greed’.

Ashok Leyland Support BrokenAshok leyland opened flat but during today's session the price dropped more than 3%. A strong body red candle broke the support of 175.90 which is a shallow pullback retracement level of 23.60%. Also it's important to mention that the moving averages are in a bearish cross. So, all these indicate a downtrend. The next important level to consider is 166.80 which could act as a strong support.
Hit the like button!! Show some energy!!
Disclaimer: This is my pre market analysis and my trading journal. Not a suggestion to buy or sell. The material is only for educational purposes.
Thanks
Er. Simranjit Singh Virdi

Important For Option Trader Royal Trend👑Royal Trade👑
Hello Guys in This Video We share How to Trade in Option's Market.
#We talk in this video what we need to learn in market.
Difference between technical analysis and option trading
Technical analysis and options trading can go hand in hand. Many of the best practices for options trading come directly from technical analysis concepts. Technical analysis focuses on price. Fundamental analysis does not solely focus on price.
why we learn option chain?
Option chain is a chart that will give in-depth information related to all stock contracts available for Nifty stocks. The best thing about the option chain is that it provides valuable information about the current security value and how it will affect it in the long term.
What is the purpose of option chain?
It can be used in creating an option strategy at several strike prices. It can be used to analyse and draw noteworthy insights about the stock and its probable movements. It helps the traders in evaluating the liquidity and the depth of the option contract.
How important is option chain analysis?
The option chain analysis data provides a very comprehensive view for all the available options for any particular underlying asset. This helps in understanding and selecting the correct option for trading or investment purpose.
NOTE
#We Are Not Promote Anything
#This channel Purpose to share market ideas.
Thanks for Watching🙏

Simple Bitcoin ForecastThis theory is based on a finishing of a head and shoulder pattern and reaching a higher low at or around the time of the halving. If history repeats itself the price should start to rise from that point going forward.

RETRACEMENT DONE IN BANK NIFTY RETRACEMENT DONE IN BANK NIFTY
Bank Nifty Trading in 50-61% FIB RETRACEMENT ZONE
Short Triggered in BankNifty
MIN 750 POINTS FALL EXPECTED
TARGET 44000 - 43900- 43800

Banknifty has shown Positivity in yesterday|Today's 09/08 levelsGood Morning Traders.
Yesterday we have seen very small range of banknifty, it was facing everytime resistance at 45000-45100. If i am not wrong it has given proper breakout of 45k on 30 mints chart, after that, it has came more down than expected for retest the levels. Well as compare to nifty. It was better. Today also we can face a resistance at 200 EMA, which is at 45200 levels now. Well guy's trade accordingly, as if market will not give momentum, your options premiums will be highly decay due to time in expiry. So trade carefully.
Today's Important levels for Banknifty:-
Buy above 45125, if levels got sustained at least for 30 mints.
Targets we can see in upside 45224/45368++
Keep stop loss at 44979
Sale below 44794, if levels got sustained at least for 30 mints.
Targets we can see in downside 44642/44534/44418--
Keep stop loss at 44979
Note:- Guy's always follow strict stop loss to save your capital from unexpected market direction.
Disclaimer:- Please always do your own analysis or consult with your financial advisor before taking any kind of trades.
Dear traders, If you like my work then do not forget to hit like and follow me, and guy's let me know what do you think about this idea in comment box, i would be love to reply all of you guy's.
Thankyou.
