Weekly Analysis with buy/Sell scenarios in Gold/XAUUSD👋👋👋 Friends, What's your view on Gold???
Last week, global gold prices showed a volatile but upward bias, with spot gold recovering after a dip and ending the week with gains of roughly 1–2%, holding near the $5,000–$5,050 zone;
As per the current scenario we may further expect consolidation in this zone and range bound trading in coming days till it reaches to 4500 or take the liquidity of 5150 level.
If price breaks 5150 level and sustain above, we may see new high. Though the level of 5300 is also critical
Critical notes.
1. 4500, 5150 and 5300 level are critical and should be monitored for high probability trade opportunities.
2. 4500 is very strong level for any buy opportunity with high probability and reward.
3. 5150 is equilibrium level of previous week candle, which makes it critical level of reversal.
4. 5300 is strong level of first quadrant of range. It is critical make or break level.
5. Price will for any or some sort of PD arrays at these level followed by entry models.
6. Most probably price will take liquidity of Key Level/FVG/RDRB level and create MSS/CISD/TS/iFVG in LTF.
7. Price should show rejection/reversal in respective LTF (1h/15m) at Key Level/FVG zone.
8. Take the trade only once clear entry model i.e. turtle soup. iFVG break, CDS or MSS happens on LTF
All these combinations are signalling a high probability and high RnR trade scenario.
Note – if you liked this analysis, please boost the idea so that other can also get benefit of it.
Also follow me for notification for incoming ideas.
Also Feel free to comment if you have any input to share.
Disclaimer: This analysis is for educational purposes only and does not constitute investment advice. Please do your own research (DYOR) and check with your financial advisor before making any trading decisions.
Priceactionanalysis

#BANKNIFTY PE & CE Levels(16/02/2026)Bank Nifty is expected to open with a gap down around the 60100–60050 zone, indicating early weakness compared to the previous close. Price has already shown selling pressure in the last session and is now approaching a key intraday support area. The opening reaction near 60050 will be very important to decide the next directional move.
On the upside, 60050–60100 is acting as an immediate support band. If price sustains above 60050 and forms strong bullish candles on the 15-minute timeframe, a recovery trade can be considered by buying CE around 60050–60100 with upside targets at 60250, 60350, and 60450+. A strong breakout and hold above 60450 can further extend the rally toward 60550 and higher levels.
On the downside, if price fails to hold 60000 and breaks below 59950, fresh selling pressure may trigger. In that case, PE can be considered below 59950 with targets at 59750, 59650, and 59550. A sustained move below 59550 would confirm deeper intraday weakness.
Overall, with a gap down opening near support, avoid chasing trades in the middle range. Either wait for a confirmed bounce above 60050 or a clean breakdown below 59950. Maintain strict stop loss and trail profits according to momentum.

#NIFTY Intraday Support and Resistance Levels - 16/02/2026Nifty is expected to open with a gap down around the 25470–25450 zone, indicating initial bearish sentiment compared to the previous close. Price is currently trading below the immediate resistance zone of 25550 and has shown consistent selling pressure in the last session. The early reaction near 25450 will be crucial to determine whether this gap down extends further or results in a bounce.
On the upside, 25550 is acting as an important resistance level. If price reclaims 25550 with strong bullish momentum and sustains above it on the 15-minute timeframe, a long position can be considered above 25550 with targets at 25650, 25700, and 25750+. A clean breakout above 25750 may further push the index toward 25800 and higher levels. However, unless 25550 is decisively broken and sustained, upside moves should be treated as pullback rallies.
On the downside, if price breaks and sustains below 25450, fresh selling pressure may accelerate. Short positions can be considered below 25450 with targets at 25350, 25300, and 25250. If 25250 is breached with strong momentum, the next support zone near 25200–25180 could come into play. Traders should watch for strong bearish candles or breakdown retests for confirmation rather than entering on the first spike.
Overall, with a gap down opening and price trading below key resistance, the bias remains slightly bearish unless 25550 is reclaimed. Avoid trading in the consolidation zone between 25450 and 25550. Wait for a clear breakout or breakdown, maintain strict stop loss, and trail profits as per momentum to manage risk effectively.

Astral Chart Breakout – Bullish SetupAstral has delivered a solid breakout above 1590, with price sustaining above this key level. The breakout candle confirms strength, signaling strong momentum and opening the door for a potential rally.
📊 Technical Outlook
Breakout Zone (Support): 1590
Immediate Targets: 1700 → 1860
Trend: Bullish continuation as long as price holds above 1590
🔑 Key Notes
Watch for volume confirmation to validate breakout strength.
Consider a stop-loss below 1590 or the breakout candle’s low for risk management.
Sustained momentum could push price toward the higher resistance zone near 1860.

Divgi TorqTransfer Systems cmp 744.55 Weekly Chart since listedDivgi TorqTransfer Systems cmp 744.55 by Weekly Chart view since listed
- Support Zone 475 to 575 Price Band
- Resistance Zone 760 to 860 Price Band
- Falling Resistance Trendline Breakout well sustained
- Bullish Head & Shoulders formed under the Resistance Zone
- Heavy Volumes spike plus good sync with average traded quantity
- Support Zone formed strong ground with Volumes based upwards momentum

TVSSCS: Trendline Breakout Post Strong Q3FY26, Chart of the WeekTVS Supply Chain Solutions Just Broke Out on 12x Volume After Hitting Rock Bottom; Technical Reversal Meets a ₹6,300 Crore Order Pipeline. This Breakout Could Define TVS Supply's Next 12 Months. Let's Understand in "Chart of the Week"
As per the Latest SEBI Mandate, this isn't a Trading/Investment RECOMMENDATION nor for Educational Purposes; it is just for Informational purposes only. The chart data used is 3 Months old, as Showing Live Chart Data is not allowed according to the New SEBI Mandate.
Disclaimer: "I am not a SEBI REGISTERED RESEARCH ANALYST AND INVESTMENT ADVISER."
This analysis is intended solely for informational purposes and should not be interpreted as financial advice. It is advisable to consult a qualified financial advisor or conduct thorough research before making investment decisions.
Price Action:
- The stock has experienced significant volatility over the past 18 months, declining approximately 49% from its peak of ₹258 in September 2023 to the current level
- Recent price action shows a dramatic reversal, with the stock surging on record volumes after hitting multi-year lows around ₹92-100 zone
Volume Spread Analysis:
- Exceptional volume spike visible in the latest session: 84.25 million shares traded versus 20-day average of 6.66 million
- This represents a volume explosion of approximately 12.6x the normal trading activity
- The volume surge accompanies the price breakout, indicating strong institutional participation and genuine buying interest
- Prior to this breakout, the stock exhibited consistently low volumes during the downtrend, suggesting capitulation and lack of seller interest at lower levels
Base Formation and Accumulation:
- The stock formed a classic accumulation base between September 2025 and February 2026, spanning approximately 5 months
- Base range: ₹92-140, with the stock consolidating primarily in the ₹100-125 zone
- This base represents a 60%+ correction from the all-time highs, suggesting significant value discovery
- The base formation shows Some characteristics of a rounding bottom pattern with decreasing volatility toward the end
- Smart money appears to have accumulated positions during the ₹100-115 range when retail sentiment was most negative
Key Support Levels:
- Immediate Support: ₹115-120 (recent breakout zone and prior resistance)
- Secondary Support: ₹105-110 (base midpoint and volume cluster)
- Strong Support: ₹92-100 (52-week low and multi-year support zone)
- Critical Support: ₹85 (psychological level; breach would invalidate bullish structure)
Key Resistance Levels:
- Immediate Resistance: ₹140-145 (previous swing high from October 2025)
- Major Resistance: ₹160-170 (200-day moving average zone and gap resistance)
- Psychological Resistance: ₹180-190 (quarterly pivot and volume resistance)
- Long-term Resistance: ₹220-230 (2024 swing high cluster)
- Ultimate Resistance: ₹258 (all-time high from September 2023)
Trend Structure:
- The stock has broken above multiple descending trendlines that had contained price action since September 2023
- The current breakout suggests potential channel exit and trend reversal
Fundamental and Sectoral Backdrop:
Company Overview:
- TVS Supply Chain Solutions is one of India's largest integrated supply chain solutions providers and part of the ₹8.5 billion TVS Group
- Operations span across two primary segments: Integrated Supply Chain Solutions (55% of revenue) and Network Solutions (including Global Forwarding Solutions and Integrated Final Mile Solutions)
- Global presence across 26 countries and 4 continents with 24.7 million sq. ft. of warehouse capacity (19.9 million sq. ft. in India)
- Serves over 91 Fortune 500 customers across automotive, industrial, consumer, technology, rail, utilities, and healthcare sectors
Recent Financial Performance:
- Q3 FY26 revenue grew 11.1% year-on-year to ₹2,715.8 crore
- EBITDA rose 36.7% to ₹205.8 crore, with margins expanding to 7.6% from 6.2%
- The company reported a consolidated net profit of ₹10.72 crore in Q3 December 2025 compared with a net loss of ₹24.65 crore in Q3 December 2024
- Excluding the impact of new wage code compliance costs, adjusted profit stood at ₹18.02 crore versus a loss of ₹23.80 crore in the prior year
- The company has a ₹6,300 crore order pipeline
Strategic Initiatives and Growth Catalysts:
- Strategic acquisition of Swamy & Sons 3PL for ₹88 crore to strengthen FMCG logistics capabilities
- Swamy & Sons has deep domain expertise in FMCG logistics with a strong presence in Andhra Pradesh and Telangana
- The acquisition brings 116 warehouses across 5 states totaling approximately 4 million sq. ft., with over 70% of revenue from FMCG players
- Recent contract wins include a 3-year contract from DICV (Daimler India Commercial Vehicles) for in-plant warehouse management
- New CEO Vikas Chadha appointed effective January 22, 2026, bringing fresh leadership perspective
Sectoral Outlook: Indian Logistics Industry:
- India's logistics sector is valued at approximately $243.8 billion in 2025 and projected to reach $429.0 billion by 2034
- The sector is well-positioned for strong growth with an expected CAGR of 10.7% till 2026
- Logistics costs have dipped below 10% of GDP for the first time, down from 13-14%
- Union Budget 2026-27 allocates ₹5,98,520 crore to the transport sector with initiatives including new Dedicated Freight Corridors and 20 National Waterways
Government Policy Support:
- PM Gati Shakti National Master Plan has integrated 57 Central Ministries and 36 states with 1,700 data layers for unified infrastructure planning
- National Logistics Policy aims to reduce logistics costs from 13-14% of GDP to 8% by 2030
- 35 key locations approved for Multi-Modal Logistics Parks development, with 5 expected to be operational by 2027
- Indian e-commerce is expected to grow at a CAGR of 27% to reach $163 billion by 2026, driving demand for efficient last-mile delivery services
Industry Tailwinds:
- Rise of third-party logistics with the India 3PL market forecast to increase by $16.77 billion at a 9.45% CAGR between 2023 and 2028
- E-commerce volumes surged to $380 billion in 2025, with AI adoption tripling among SMEs for predictive routing
- Manufacturing push under Make in India and PLI schemes increasing demand for integrated supply chain solutions
- Dedicated Freight Corridors hit 96% operational status, improving rail connectivity
Competitive Position and Concerns:
- TVS SCS has positioned itself among the top warehousing 3PL service providers in India post Swamy & Sons acquisition
- The company's digital capabilities leveraging AI, IoT, and Machine Learning provide competitive advantages
- However, the company has faced challenges including high valuation multiples, weak capital efficiency, and ongoing regulatory disputes
- Five-year sales growth of 8.64% is considered modest for a growing sector
- Stock has significantly underperformed both the Sensex and the transport services sector over the past 1-2 years
Technical Summary:
- The stock has completed a multi-month base formation and broken out on exceptional volumes, suggesting institutional accumulation
- The breakout from the descending channel indicates a possible trend reversal
- Critical resistance zones exist at ₹140-145, ₹160-170, and ₹180-190 that will determine the sustainability of this move
- Volume confirmation is the strongest technical positive, with 12.6x average volume supporting the breakout
Fundamental Summary:
- The company has achieved a profitability turnaround, with Q3 FY26 showing margin expansion and return to profit after previous quarter losses
- Strategic acquisition of Swamy & Sons strengthens FMCG logistics capabilities, a high-growth segment within supply chain
- A robust order pipeline of ₹6,300 crore provides revenue visibility for coming quarters
- The Indian logistics sector is entering a golden period with government support, infrastructure development, and e-commerce growth creating strong tailwinds
Critical Factors to Monitor:
- Ability to sustain above ₹115-120 support zone in near term
- Follow-through buying in coming sessions to confirm breakout validity
- Quarterly execution and margin trajectory in FY26 Q4 and FY27
- Integration success of Swamy & Sons acquisition and synergy realization
- Broader market conditions and risk appetite for mid-cap stocks
- Progress on the ₹6,300 crore order pipeline conversion to revenue
My 2 Cents:
- The technical setup suggests this could be a pivotal moment for TVS Supply Chain, with the potential for a sustained upward move if the breakout holds
- The combination of technical reversal patterns, record volume, and improving fundamentals creates a compelling near-term setup
- However, investors should remain cautious about the multiple overhead resistance levels and the stock's history of failed rallies
- The sectoral tailwinds from government infrastructure spending and e-commerce growth provide a supportive macro backdrop
- Risk management through appropriate stop-losses below ₹115 is essential given the stock's high volatility
Full Coverage on my Mid-Week Newsletter coming Wednesday.
Keep in the Watchlist and DOYR.
NO RECO. For Buy/Sell.
📌Thank you for exploring my idea! I hope you found it valuable.
🙏FOLLOW for more
👍BOOST if you found it useful.
✍️COMMENT below with your views.
Meanwhile, check out my other stock ideas on the right side until this trade is activated. I would love your feedback.
As per the Latest SEBI Mandate, this isn't a Trading/Investment RECOMMENDATION nor for Educational Purposes; it is just for Informational purposes only. The chart data used is 3 Months old, as Showing Live Chart Data is not allowed according to the New SEBI Mandate.
Disclaimer: "I am not a SEBI REGISTERED RESEARCH ANALYST AND INVESTMENT ADVISER."
This analysis is intended solely for informational purposes and should not be interpreted as financial advice. It is advisable to consult a qualified financial advisor or conduct thorough research before making investment decisions.

Weekly Analysis with buy/Sell scenarios in Nifty👋👋👋 Friends, What's your view on Nifty???
Last week, the Nifty 50 closed with a negative bias, slipping around 1% and failing to sustain above the 26,000 resistance, with selling pressure intensifying toward the latter half and the index ending near 25,450; institutional flows remained a key drag as FIIs were net sellers for the week (approx. ₹-3,508.38 Cr outflow estimated from daily trends) while DIIs provided partial support with net buying of ~₹11,208.74 Cr, including a sharp buy figure of about ₹5,500 Cr on 13 Feb alone against FII selling of ~₹7,400 Cr , reflecting continued domestic absorption of foreign outflows.
In terms of positioning, FII derivatives data indicated a cautious to bearish stance with hedging visible in index options, while cash market selling suggests lack of directional conviction; delivery data (cash segment participation) remained moderate, indicating limited carry-forward conviction and more short-term trading activity rather than aggressive positional buying, which aligns with the broader “sell on rise” structure.
Overall, unless Nifty reclaims the 25,900–26,000 zone with sustained FII buying and improved delivery participation, the market bias remains sideways to negative in the near term.
Critical points ……………….
1. Week closed strong bearish and price at critical level of 25450.
2. This level is forming cluster of key levels; hence this may act as consolidation zone or a short term pullback.
3. If price closes below this level and sustain. It may then target next level of 25000.
4. Till the price is running below 26000, we should look for sell on rise.
Note – if you liked this analysis, please boost the idea so that other can also get benefit of it.
Also follow me for notification for incoming ideas.
Also Feel free to comment if you have any input to share.
Disclaimer: This analysis is for educational purposes only and does not constitute investment advice. Please do your own research (DYOR) and check with your financial advisor before making any trading decisions.

Silver Losing Sheen With A Failed Tenkan ReclaimFailed Tenkan reclaim on 4H.
Price remains trapped below a thick bearish Kumo.
Weekly has now closed three consecutive candles below Kijun — momentum clearly shifting.
Chikou is free. Structure is heavy.
Unless 267120 is taken out decisively on a 4H closing basis, downside pressure persists.
235690 → 229850 → 224000 → 218150 remain in focus.
Sellers control the tape until equilibrium is reclaimed.

Kross cmp 224 by Daily Chart view since listedKross cmp 224 by Daily Chart view since listed
- Support Zone 187 to 206 Price Band
- Resistance Zone 222 to 239 Price Band
- Bullish Rounding Bottoms followed by Cup & Handle
- Falling Resistance Trendline Breakout seems in progress
- Resistance Zone Breakout anticipated by steady attempts
- Volumes flat yet closely synced with average traded quantity

#NIFTY Intraday Support and Resistance Levels - 17/02/2026Nifty is expected to open flat around the 25680–25700 zone, indicating a neutral start near immediate resistance. Price has shown a strong recovery from lower levels and is now approaching the 25700–25710 resistance band, which will act as a key decision zone in the early session. Since the market is opening flat near resistance, the first 15–30 minutes will be crucial to confirm direction.
On the upside, if Nifty sustains above 25750 with strong bullish momentum and a solid 15-minute candle close, fresh long positions can be considered. A breakout above 25750 can trigger momentum toward 25850, 25900, and 25950+. Holding above 25750 will indicate strength and continuation of the current recovery structure.
On the downside, if the index fails to sustain above 25700 and breaks below 25700 with strong selling pressure, short positions can be considered. A breakdown below 25700 may lead to targets around 25600, 25550, and 25500. Further weakness below 25500 can extend the fall toward the next support zone near 25450–25400.
Overall, with a flat opening near resistance, avoid entering in the narrow range between 25680 and 25750. Wait for a clear breakout or breakdown confirmation, maintain strict stop loss, and trail profits properly as momentum builds.

#BANKNIFTY PE & CE Levels(17/02/2026)Bank Nifty is expected to open flat around the 60950–61000 zone, indicating a neutral start after the recent strong recovery move. Price is currently trading near an important resistance band around 60950–61050, which will act as the immediate decision zone for today’s session. Since the market has already shown a sharp upside bounce from lower levels, traders should be cautious of both breakout continuation and potential rejection from resistance.
On the upside, if Bank Nifty sustains above 61050 with strong bullish momentum on the 15-minute timeframe, fresh long positions can be considered. A sustained breakout may push the index toward 61250, 61350, and 61450+. Holding above 61050 will indicate strength and continuation of bullish momentum, especially if accompanied by strong volume candles.
On the downside, if price faces rejection near 60950–61000 and breaks below 60900, a short-term pullback can be expected. Selling pressure below 60900 may lead to targets around 60750, 60650, and 60550. Further weakness below 60450 can extend the decline toward 60250, 60150, and 60050 levels. Traders should wait for confirmation through strong breakdown candles rather than entering on small fluctuations.
Overall, with a flat opening near resistance, the first 15–30 minutes will be crucial. Avoid trading in the narrow range between 60900 and 61050. Wait for a clear breakout or breakdown, maintain strict stop loss, and trail profits properly as momentum builds.

NIFTY IT at a Structural Inflection – Monthly Kumo Now in FocusNIFTY IT has entered a rare multi-timeframe alignment of weakness , with higher timeframes under structural stress and lower timeframe stretched.
Monthly – Regime Under Pressure
8 consecutive closes below Kijun.
Price testing the cloud top.
14-month flat Span B below acting as long-term equilibrium magnet.
The long-term trend is being tested — not just corrected.
Weekly – Breakdown Confirmed
Weekly Kumo breakdown.
Kijun rejection confirmed.
Thin forward cloud → low structural support ahead.
Momentum bias remains negative.
Daily – Tactical Exhaustion
Bearish TK cross.
~3 ATR extension below Kijun.
RSI deeply oversold.
Flat Daily Kijun aligned with supply.
Short-term bounce possible. Broader pressure intact.
The monthly cloud is the line in the sand — hold it and we base, lose it and the structure changes.

Weekly Analysis with buy/Sell scenarios in BTC👋👋👋 Friends, What's your view on BTC???
Last week, Bitcoin (BTC) traded with high volatility and a corrective bias, briefly dropping toward the critical $60,000 support zone before staging a sharp rebound toward $68,000–$70,000, but failing to sustain above $70K and closing the week slightly negative; the decline was driven by profit booking and long liquidation, leading to a sharp drawdown of nearly 15–20% at one stage, indicating leveraged positions being flushed out. Key developments included cooling momentum in spot Bitcoin ETF inflows, signaling reduced institutional buying, along with macro uncertainty around US inflation and interest rate expectations, which pressured risk assets, while capital rotation toward safe havens like gold further impacted sentiment. Additionally, declining trading volumes and increased hedging activity reflected cautious participation and lack of strong bullish conviction.
Structurally, BTC remains in a range between $60K–$70K, with lower highs indicating supply on rallies. For the coming week, two key scenarios emerge: bullish case – a sustained move above $70K–$72K can trigger short covering and push BTC toward $75K+; bearish case – failure to reclaim $70K may lead to a retest of $60K support, and a breakdown below this level could accelerate downside toward $55K–$58K. Overall, BTC remains range-bound with downside risk, and the next move will largely depend on macro data, ETF flows, and overall risk sentiment.
Critical Points
1. Price is ranging between ~$60K-~$70K.
2. Pressure is clear downside and we can expect some moves between the identified range.
3. We should expect any big movement out of this range only.
4. Price may approach POI identified in last week once lower zone is broken with volume and sustained below it.
5. Price may consolidate at this level and form MSS at this POI and possibly reverse for further highs.
6. Most probably price will take liquidity of FVG/RDRB level and create MSS/CISD/TS/iFVG in LTF.
7. Price should show rejection/reversal in respective LTF (4H/1H) at Key Level/FVG zone.
8. Take the trade only once clear entry model i.e. turtle soup. iFVG break, CDS or MSS happens on LTF
All these combinations are signalling a high probability and high reward trade scenario.
Note – if you liked this analysis, please boost the idea so that other can also get benefit of it.
Also follow me for notification for incoming ideas.
Also Feel free to comment if you have any input to share.
Disclaimer: This analysis is for educational purposes only and does not constitute investment advice. Please do your own research (DYOR) and check with your financial advisor before making any trading decisions.

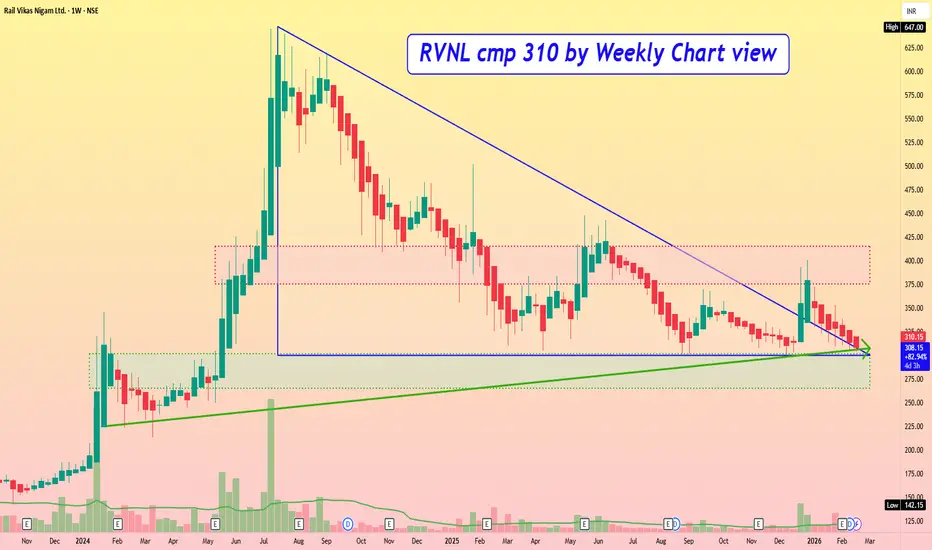
RVNL cmp 310 by Weekly Chart viewRVNL cmp 310 by Weekly Chart view
- Support Zone 265 to 302 Price Band
- Resistance Zone 375 to 415 Price Band
- Rising Support Trendline providing a stable shoulder
- Descending Triangle formed at Support Zone anticipating upside breakout
- Volumes seen by Selling pressure but demand based buying cushioning it out
- Support Zone forming strong base ground and holding price and volumes front
Ceat cmp 3965.30 by Daily Chart viewCeat cmp 3965.30 by Daily Chart view
- Support Zone 3600 to 3850 Price Band
- Resistance Zone 4125 to ATH 4438 Price Band
- Volumes in good sync with average traded quantity
- Support Zone forming a good base for probable uptrend

Bank Nifty spot 60186.65 by Daily Chart view - Weekly UpdateBank Nifty spot 60186.65 by Daily Chart view - Weekly Update
- Support Zone 59500 to 60200 for Bank Nifty
- Resistance Zone 60425 to 60875 then ATH 61764.85.35 for Bank Nifty
- Gap Up Opening of 1106 pts of 03-Feb-2026 would need be filled, sooner or later

Nifty spot 25471.10 by Daily Chart view - Weekly UpdateNifty spot 25471.10 by Daily Chart view - Weekly Update
- Support Zone 25325 to 25625 holding ground for Nifty Index
- Resistance Zone 25850 to 26105 then upwards at ATH 26373.20 for Nifty Index
- Nifty Gap Up Opening of 533 pts on 03-Feb-2026 would need be filled, sooner or later

Axis Bank | Gann Square of 9 Intraday Observation | 20/10/2023Disclaimer:
This analysis is for educational purposes only. I am not a SEBI-registered advisor. This is not financial advice.
Symbol: AXISBANK (NSE)
Date Observed: 20 October 2023
Time Frame: 15-Minute Chart
Method: Gann Square of 9 (Normal Price Capacity Study)
This idea highlights a historical intraday observation where Axis Bank’s price behavior aligned with a normal Square of 9 downside capacity level, followed by a temporary reaction once price and time came into alignment.
📊 Market Structure & Reference Selection
During the session, Axis Bank showed downward movement after the reference point was identified.
In declining conditions, the high of the reference candle (~993) was treated as the 0-degree level, following commonly used Gann principles.
This reference served as the base for evaluating the stock’s expected intraday price expansion.
The focus remains on structure and measurement rather than prediction.
🔢 Square of 9 Level Mapping
Using the selected reference:
0 Degree: ~993
45 Degree (Observed Normal Downside Capacity): ~977
The 45-degree level is often studied as a zone where normal intraday movement may complete, especially if reached early in the session.
⏱️ Observed Price–Time Behavior
Price declined steadily from the reference level.
The 45-degree zone was approached well before the latter part of the trading day.
Around mid-session, price made a low close to the calculated level, with a small variation.
Minor deviations around derived levels are commonly observed in live markets.
After interacting with this zone, price showed temporary buying interest and moved higher.
Historically, such behavior reflects how early completion of normal price capacity can coincide with short-term reactions.
📘 Educational Takeaways
Importance of selecting the correct 0-degree reference
Measuring normal intraday movement using Square of 9
Studying time alignment alongside price levels
Allowing reasonable price tolerance in real-market data
Observing reactions rather than anticipating outcomes
This example demonstrates how a rule-based framework can help interpret intraday market behavior objectively.
📌 Shared strictly for educational and historical chart-study purposes.
#AxisBank #GannSquareOf9 #WDGann #IntradayAnalysis #MarketEducation #PriceTime #TechnicalAnalysis

#NIFTY Intraday Support and Resistance Levels - 13/02/2026Nifty is expected to open with a gap down today around the 25780–25800 zone, indicating early weakness compared to yesterday’s close. Price is currently hovering just above the immediate support near 25750, which makes this level very crucial for the opening session. The first 15–30 minutes will decide whether we see continuation selling or a quick recovery move.
On the upside, 25750–25800 is acting as a short-term pivot zone. If price sustains above 25750 and shows strength with strong bullish candles, a long position can be considered above 25750 with targets around 25850, 25900, and 25950+. A proper breakout and hold above 25950 can further extend the rally toward 26000 levels.
On the downside, if price breaks and sustains below 25700, selling pressure may increase sharply. In that case, short positions can be planned below 25700 with targets near 25600, 25550, and 25500. A strong breakdown below 25500 would confirm deeper intraday weakness.
Overall, with a gap down opening near support, avoid aggressive trades in the middle range. Either wait for a confirmed bounce above 25750 or a clear breakdown below 25700. Maintain strict stop loss and trail profits as per momentum.

#BANKNIFTY PE & CE Levels(13/02/2026)Bank Nifty is expected to open with a slight gap down today around the 60700–60750 zone, indicating mild early weakness compared to yesterday’s close. Price is currently trading near an important intraday support area around 60550. The overall structure suggests that the market is opening near a decision zone, where either a bounce or further downside continuation can develop depending on the first 15–30 minutes’ price action.
On the upside, 61050 remains a strong resistance level. A sustained move and 15-minute candle close above 61050 can trigger bullish momentum, where CE options may perform well with targets around 61250, 61350, and 61450+. However, considering the gap down opening, traders should wait for confirmation instead of immediately chasing longs near resistance.
On the downside, if price breaks below 60550 and sustains, selling pressure can intensify. In that case, PE positions can be considered around 60450–60400 with targets near 60250, 60150, and 60050. A clean breakdown below 60050 would further weaken the intraday trend and may open the door for extended downside.
Overall, with a gap down opening near support, the first hour will be crucial. Either we may see a quick recovery toward 60950–61050 (gap filling attempt) or continuation selling below 60550. Avoid trading in the middle zone and focus only on breakout or breakdown levels with proper stop loss and trailing management.

#BANKNIFTY PE & CE Levels(12/02/2026)Bank Nifty is expected to open flat today, with no major changes compared to yesterday’s closing levels. The overall structure remains range-bound, and price is still trading between clearly defined support and resistance zones. Since there is no significant gap up or gap down, the market is likely to respect the same key levels during the initial session, and traders should focus on reaction around these zones rather than expecting immediate breakout momentum.
On the upside, the immediate resistance zone remains around 60950–61050. A strong move and sustained trading above 61050 can trigger fresh bullish momentum. In that case, CE buying can be considered with upside targets around 61250, 61350, and 61450+. However, confirmation is important. A simple spike above resistance without follow-through should be avoided, and traders should wait for a 15-minute candle close above the breakout level before entering aggressive long positions.
In the middle range, 60550–60600 continues to act as an important intraday pivot zone. As long as price sustains above this level, the bias remains slightly positive and dips may get bought. CE buying near this zone can offer targets towards 60750, 60850, and 60950+. This area is likely to act as decision-making support during the first half of the session.
On the downside, if Bank Nifty fails to hold 60550 and breaks below 60450–60400 with strong selling pressure, PE buying can be considered for targets around 60250, 60150, and 60050. A clean breakdown below 60050 would further weaken the structure and may lead to extended downside movement.
Overall, with a flat opening and no major structural change, the market is expected to remain level-based and reactive. Traders should avoid overtrading in the opening minutes and wait for confirmation near key support and resistance. Proper risk management and trailing stop loss will be important, especially if the index continues to consolidate within the current range before giving a decisive move.

Bank of Maharashtra cmp 66.24 by Weekly Chart viewBank of Maharashtra cmp 66.24 by Weekly Chart view
- Support Zone 57.75 to 61.25 Price Band
- Resistance Zone 67.75 to ATH 73.50 Price Band
- Volumes in good sync with average traded quantity
- Rising Support Trendline seems to be holding very well
- Bullish Cup & Handle formed inclusive of Head & Shoulders
- Breakout from Resistance Zone would clear pathway for New ATH

Sagility cmp 50.07 by Weekly Chart view since listedSagility cmp 50.07 by Weekly Chart view since listed
- Support Zone 43.50 to 47.50 Price Band
- Resistance Zone 53.75 to ATH 57.89 Price Band
- Darvas Box Chart Setup : Price traversing between 47 to ATH 53.25 range since Nov 2025
- Volumes facing selling pressure at each uptrend at Resistance Zone lower side price level
- Bullish Rounding Bottoms have been made between the Support Zone and Resistance Zone
- Resistance Zone Breakout trigger may happen but is subject to Volumes increase exponentially
