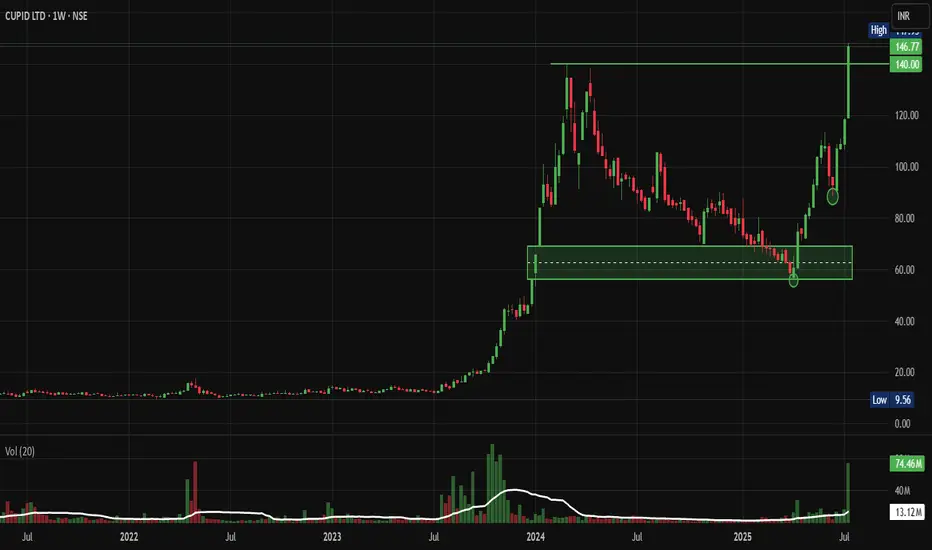
Cupid: Past Multibagger Forming Rounding Bottom BreakoutFrom ₹10 to ₹150: How CUPID Stock Became a Multibagger Dream and What's Next. Let's analyse and Deep Dive into my Chart of the Week Idea.
Price Action Analysis:
Long-term Trend Analysis:
- Primary Trend: Strongly bullish multi-year uptrend since 2023
- Trend Structure: Classic accumulation-markup-distribution pattern visible
- Price Progression: Massive rally from ₹10 levels in 2023 to ₹145+ levels
- Current Phase: Potential early stage of renewed markup phase after consolidation
Volume Spread Analysis:
Volume Profile Assessment:
- Accumulation Phases: High volume during the 2023-2024 markup phase
- Distribution Evidence: Volume spike during 2024 highs suggesting profit-taking
- Current Volume: Recent volume expansion (74.46M) confirming breakout momentum
- Volume Trend: Healthy volume participation during the current breakout phase
Volume-Price Relationship:
- Positive Correlation: Rising prices accompanied by expanding volume
- Breakout Validation: Current breakout supported by above-average volume
- Distribution Concerns: Previous high volume at peaks indicated selling pressure
Key Price Levels:
Support Levels:
- Immediate Support: ₹95-100 (recent consolidation base)
- Critical Support: ₹80-85 (previous resistance turned support)
- Major Support: ₹65-70 (rectangle pattern lower boundary)
- Ultimate Support: ₹50-55 (long-term trend line support)
Resistance Levels:
- Key Resistance: ₹145-150 (previous highs)
- Major Resistance: ₹150-155
- Target Extension: ₹170-180 (measured move projection)
Technical Indicators Assessment:
Trend Indicators:
- Moving Averages: Price clearly above major moving averages, indicatinga bullish bias
- Trend Strength: Strong upward trajectory since the consolidation base
- Momentum: Building positive momentum after prolonged consolidation
Trade Setup & Strategy:
Primary Long Setup:
- Entry Strategy: Buy on dips to ₹115-120 support zone
- Confirmation: Entry above ₹145 for momentum traders
Alternative Strategies:
Conservative Approach:
- Entry: Wait for pullback to ₹100-105 levels
- Timeframe: Medium to long-term holding period (Weekly Charts)
- Risk Profile: Lower risk, moderate reward
Aggressive Approach:
- Entry: Immediate entry at current levels (₹145)
- Timeframe: Short to medium-term momentum play (Daily Charts)
- Risk Profile: Higher risk, higher reward potential
Entry and Exit Levels:
Entry Zones:
- Zone 1: ₹115-120 (Primary entry for dip buyers)
- Zone 2: ₹145-150 (Momentum breakout entry)
- Zone 3: ₹100-105 (Deep pullback opportunity)
Target Levels:
- Target 1: ₹150-155 (Short-term objective)
- Target 2: ₹160-165 (Medium-term target based on pattern)
- Target 3: ₹180-190 (Long-term extension target)
- Ultimate Target: ₹200+ (Bull market extension)
Exit Strategy:
- Profit Booking: Book 30% at Target 1, 40% at Target 2, and the remaining at Target 3
- Trailing Stop: Implement trailing stop-loss above ₹140
- Time Stop: Review position if targets are not achieved in 8-12 months
Stop-Loss Strategy:
Stop-Loss Levels:
- Aggressive Stop: ₹110 (for entries around ₹120)
- Moderate Stop: ₹100 (for swing traders)
- Conservative Stop: ₹85 (for long-term investors)
Stop-Loss Management:
- Initial Risk: Limit to 8-10% of the entry price
- Trailing Mechanism: Move stop-loss to breakeven after 15% gains
- Pattern Stop: Below ₹95 invalidates the breakout setup
- Time-based Stop: Exit if below ₹110 for more than 2 weeks
Position Sizing & Risk Management:
Position Sizing Guidelines:
- Conservative Investors: 2-3% of portfolio
- Moderate Risk Takers: 4-5% of portfolio
- Aggressive Traders: 6-8% of portfolio (maximum)
- Sectoral Exposure: Limit total pharma/healthcare exposure to 15-20%
Risk Management Framework:
- Maximum Loss: Limit loss to 2% of total portfolio per trade
- Diversification: Don't concentrate more than 10% in a single stock
- Sector Allocation: Balance with other defensive sectors
- Time Diversification: Stagger entries over 2-3 weeks
Portfolio Integration:
- Correlation Check: Monitor correlation with other pharma stocks
- Sector Rotation: Consider the pharma sector cycle and rotation
- Market Cap Allocation: Balance small-cap exposure with large-caps
- Liquidity Consideration: Account for small-cap liquidity constraints
Risk Assessment:
Technical Risks:
- Failed Breakout: Risk of false breakout below ₹115
- Distribution Pattern: High volume at peaks may indicate selling
- Overbought Conditions: Rapid rise may lead to consolidation
- Support Breakdown: Break below ₹95 would be technically negative
Fundamental Risks:
- Valuation Concerns: High PE ratio of 96+ indicates premium valuation
- Sales Decline: The Recent 7% sales decline raises growth concerns
- Sector Competition: Increasing competition in the contraceptive market
- Regulatory Changes: Healthcare sector regulatory modifications
Market Risks:
- Small-Cap Volatility: Higher volatility compared to large-caps
- Liquidity Risk: Potential liquidity issues during market stress
- Sentiment Risk: Healthcare sector sentiment shifts
- Global Economic: Impact of global economic conditions on exports
Company Overview & Fundamental Backdrop:
Business Profile:
- NSE:CUPID is India's premier manufacturer of male and female condoms, personal lubricant, and IVD kits, established in 1993
- The company manufactures and exports contraceptives, including male and female condoms, and medical devices, with a focus on sexual health and reproductive safety, serving both domestic and international markets, supplying high-quality products to governments and NGOs
- Market capitalization: ₹3,940 crores as of July 2025, classified as a Small Cap company
Financial Performance:
- Current valuation metrics: PE ratio of 96.3 and PB ratio of 11.5
- Recent performance: Sales declined by 7.24% to Rs 61 crore in Q4 FY25 versus Rs 66 crore in Q4 FY24; however, net profit rose 2.71% to Rs 41 crore for FY25
- Long-term returns: The stock has delivered 133% returns in the last 3 years
Sectoral Growth Outlook:
- The Indian contraceptive devices market is expected to grow at a CAGR of 6.2-6.3% from 2025 to 2030
- Market size estimated at USD 264.01 million in 2025, expected to reach USD 377.61 million by 2030, at a CAGR of 7.42%
- India's pharmaceutical sector aims to grow from the current US$50 billion to US$450 billion by 2047, with India being the 3rd largest producer of drugs globally
Monitoring Parameters:
What to Look Closely at Technically?
- Weekly Close: Monitor weekly closes above ₹115 for trend continuation
- Volume Trends: Watch for volume expansion on up-moves
- Relative Strength: Compare performance with the Nifty Healthcare Index
What to Look Closely at Fundamentally?
- Quarterly Results: Track revenue growth and margin expansion
- Order Book: Monitor new contract wins and export orders
- Sector Trends: Keep track of contraceptive market growth
- Management Commentary: Follow management guidance and outlook
Now, when to exit?
- Technical Breakdown: Close below ₹95 for two consecutive days
- Volume Reversal: High volume selling at resistance levels
- Fundamental Deterioration: Significant decline in business metrics
- Sector Weakness: Broad-based healthcare sector underperformance
So, My Take:
NSE:CUPID presents a compelling technical setup with a confirmed breakout from a year-long consolidation pattern. The stock has transformed from a ₹10 stock to a multibagger, and current technical indicators suggest potential for further upside. However, premium valuation and recent sales decline warrant careful risk management. The trade offers an attractive risk-reward profile for investors willing to accept small-cap volatility in exchange for participation in a growing healthcare subsector.
Keep in the Watchlist and DOYR.
NO RECO. For Buy/Sell.
📌Thank you for exploring my idea! I hope you found it valuable.
🙏FOLLOW for more
👍BOOST if you found it useful.
✍️COMMENT below with your views.
Meanwhile, check out my other stock ideas on the right side until this trade is activated. I would love your feedback.
Disclaimer: "I am not a SEBI REGISTERED RESEARCH ANALYST AND INVESTMENT ADVISER."
This analysis is intended solely for informational and educational purposes and should not be interpreted as financial advice. It is advisable to consult a qualified financial advisor or conduct thorough research before making investment decisions.
Priceactionanalysis
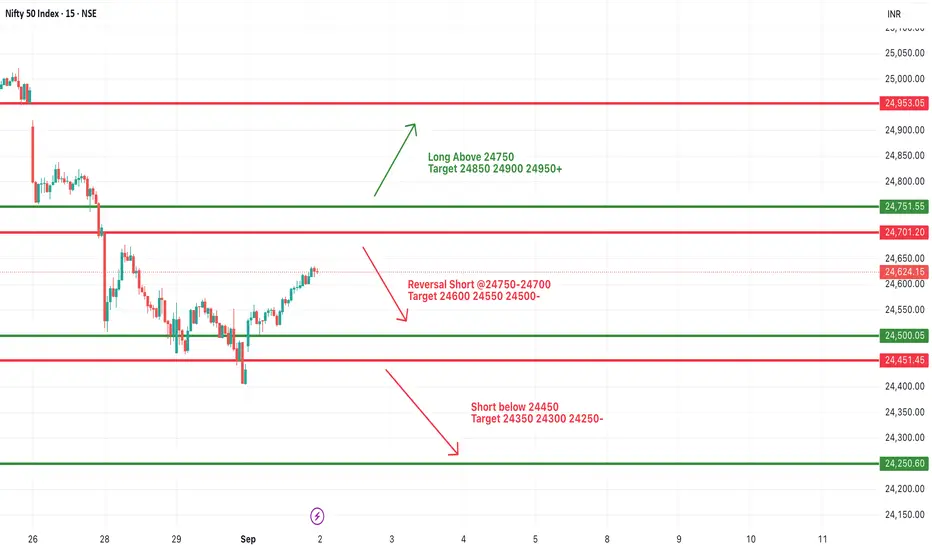
#NIFTY Intraday Support and Resistance Levels - 02/09/2025Nifty is expected to open with a gap up today, likely testing levels above 24,700. This zone will play a crucial role in deciding the intraday direction, as price action near this level may trigger either continuation or reversal moves.
On the upside, if Nifty sustains above the 24,750 mark, a fresh rally can be seen with targets at 24,850, 24,900, and 24,950+. A breakout above 24,950 could further fuel momentum, paving the way for an extended move toward 25,100 levels.
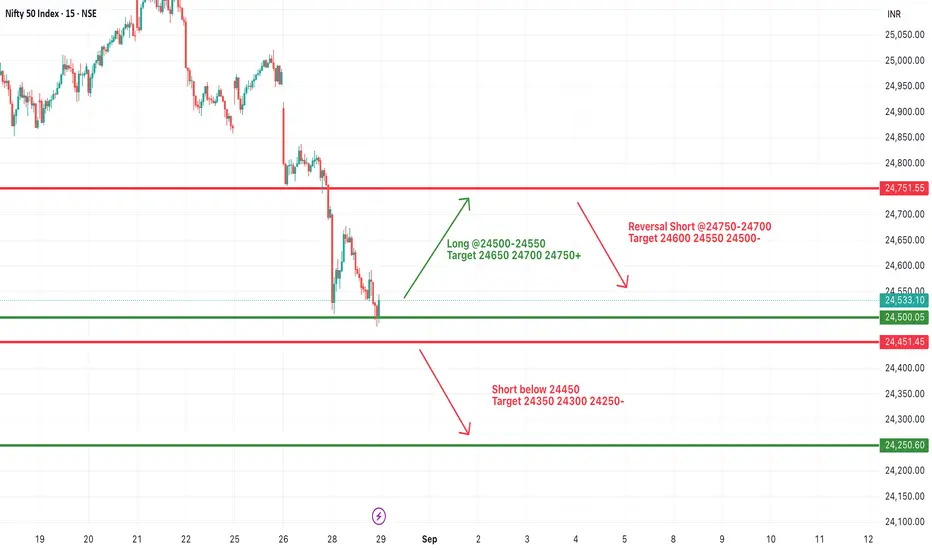
However, if Nifty faces resistance near 24,750–24,700 and fails to hold, a reversal short opportunity may open up. In that case, downside targets would be 24,600, 24,550, and 24,500. A decisive break below 24,450 would further weaken sentiment, dragging the index toward 24,350, 24,300, and 24,250.
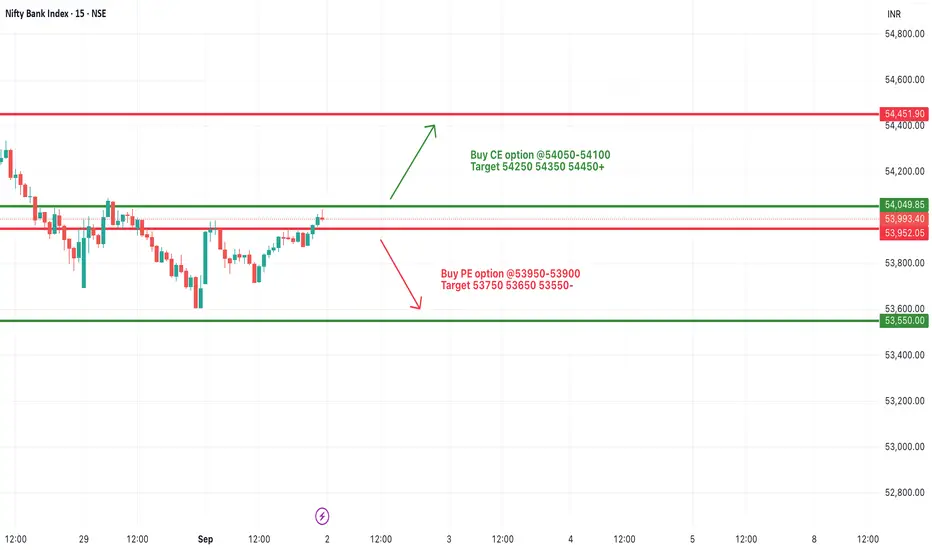
[INTRADAY] #BANKNIFTY PE & CE Levels(02/09/2025)Bank Nifty is likely to witness a slightly gap-up opening today, with price action consolidating near the 54,000 zone. This level remains a key pivot for intraday direction, and traders should watch closely for confirmation on either side.
On the upside, if Bank Nifty sustains above the 54,050–54,100 range, a positive move could unfold with targets placed at 54,250, 54,350, and 54,450+. Sustained buying momentum above 54,450 could further strengthen bullish sentiment and extend the rally.
On the downside, if the index fails to hold and slips below 53,950–53,900, fresh selling pressure may drag Bank Nifty lower toward 53,750, 53,650, and 53,550. A breakdown below 53,550 would open the door for deeper declines, turning market sentiment more negative.
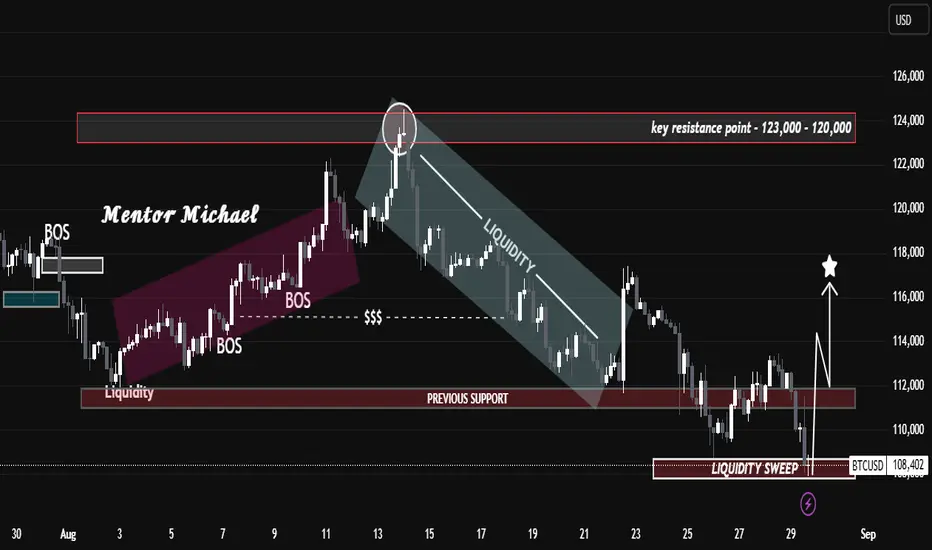
Liquidity Grab Completed – Bulls Back in Control?Liquidity Grab Completed – Bulls Back in Control?
Key Technical Insights:
Resistance Rejection: Price sharply rejected the 120K – 123K resistance zone, confirming this area as a key supply level.
Bearish Liquidity Flow: After rejection, BTC flowed within a descending liquidity channel, continuously taking out internal supports before finding a base.
Previous Support → Liquidity Sweep: Around 108K, price executed a strong liquidity sweep, triggering stop hunts below prior support, then showing a bullish reaction.
Market Structure Shift Incoming: The sweep suggests a potential accumulation phase, where institutions collect orders before pushing price higher.
Upside Targets: If price holds above the reclaimed support at 112K, bullish momentum could aim for 116K – 118K in the near term ⭐.
⚠️ Risk Consideration: A failure to sustain above 108K would invalidate the bullish outlook, opening room for deeper downside.
📌 Summary:
BTCUSD is transitioning from a liquidity-driven decline into a possible reversal phase. The liquidity sweep at 108K could mark the start of a bullish leg if structure confirms with higher highs. Traders should monitor 112K as the short-term pivot point.
“The Art of Traps: Understanding Fake Breakouts in XAUUSD”“The Art of Traps: Understanding Fake Breakouts in XAUUSD”
This chart illustrates how gold (XAUUSD) is currently navigating a critical battle between resistance and support.
At the top, the resistance zone (3440–3460) has already shown signs of rejection, hinting at a possible fake breakout scenario. Such traps are common in financial markets—they draw traders into buying late, only for price to reverse and capture liquidity.
On the downside, the chart highlights two important stages:
The first target lies around 3400, where short-term buyers may start taking profits.
The final target sits at the key support zone (3330–3320), which has acted as a structural backbone in past moves. If this level holds, we can expect another bullish leg; if broken, deeper downside pressure could unfold.
The sequence of higher lows in recent weeks demonstrates strength in the broader trend, but it also warns that markets are building energy before a larger move. Liquidity sweeps (marked in the chart) serve as reminders that price does not move randomly—it often seeks zones where orders are concentrated.
🔑 Educational Takeaway:
Trading is not just about spotting breakouts; it’s about understanding whether those moves are genuine or deceptive. By studying price behavior at resistance and support, traders can avoid falling into liquidity traps and position themselves with the “smart money.”

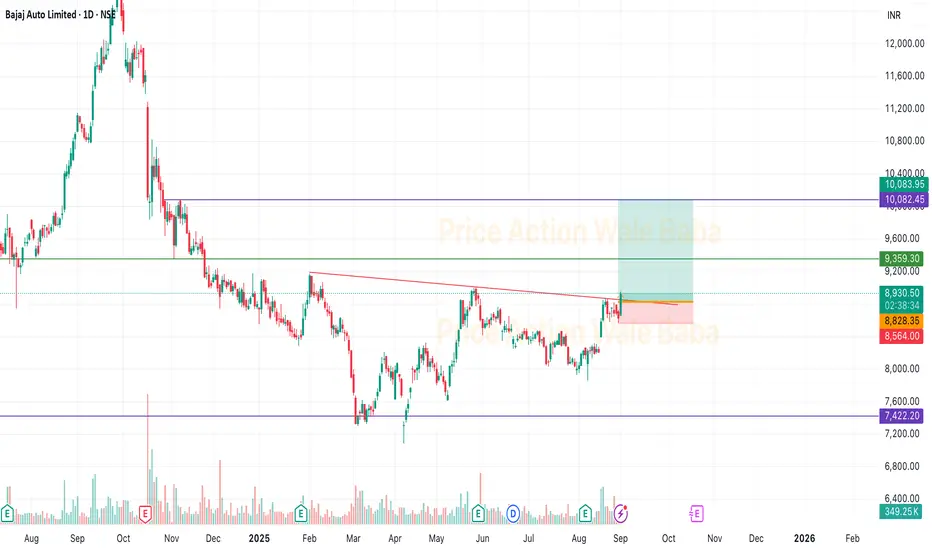
Bajaj Auto - BreakoutBajaj Auto has a trendline breakout and give good upside movement.
Good to buy now at cmp 8900 with the SL of 8560.
Strong upside move possible till 10080.
Above 10100, possible 10800-11500.
[INTRADAY] #BANKNIFTY PE & CE Levels(01/09/2025)Bank Nifty is likely to open with a slight gap-up today, showing signs of stabilisation after recent weakness. The immediate levels to watch will be 53,550 on the downside and 53,950 on the upside, as they are expected to act as crucial intraday pivot zones.
On the upside, if Bank Nifty sustains above 53,950–54,100, a recovery rally may emerge, taking the index higher towards 54,250, 54,350, and 54,450+. A breakout above 54,450 can provide stronger momentum for extended gains. Additionally, a reversal buying opportunity could also be considered around the 53,550–53,600 zone, with targets placed at 53,750, 53,850, and 53,950+.
On the downside, if Bank Nifty slips below 53,900, selling pressure may resume with targets at 53,750, 53,650, and 53,550. A further breakdown below 53,450 could drag the index lower towards 53,250, 53,150, and even 53,050 levels.
Overall, the index remains in a cautious zone with limited directional clarity. Traders should keep an eye on the price action around key support and resistance zones, as the first hour of trade will likely define the day’s momentum.

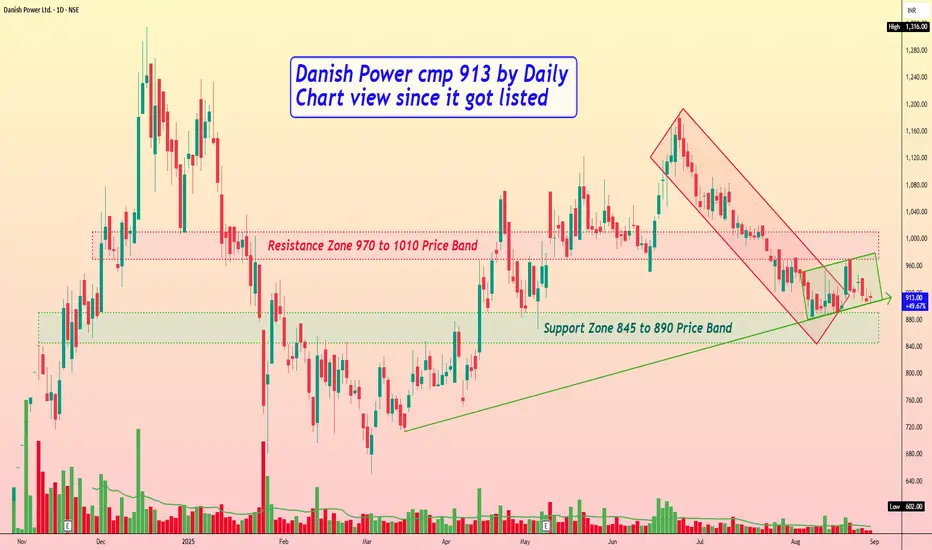
Danish Power cmp 913 by Daily Chart view since listedDanish Power cmp 913 by Daily Chart view since listed
- Support Zone 845 to 890 Price Band
- Resistance Zone 970 to 1010 Price Band
- Breakout from Falling Resistance Price Channel sustained
- Rising Support Price Channel trending post Support Zone test and retest
- Demand based Buying Volumes needed to counter profit booking selling pressure
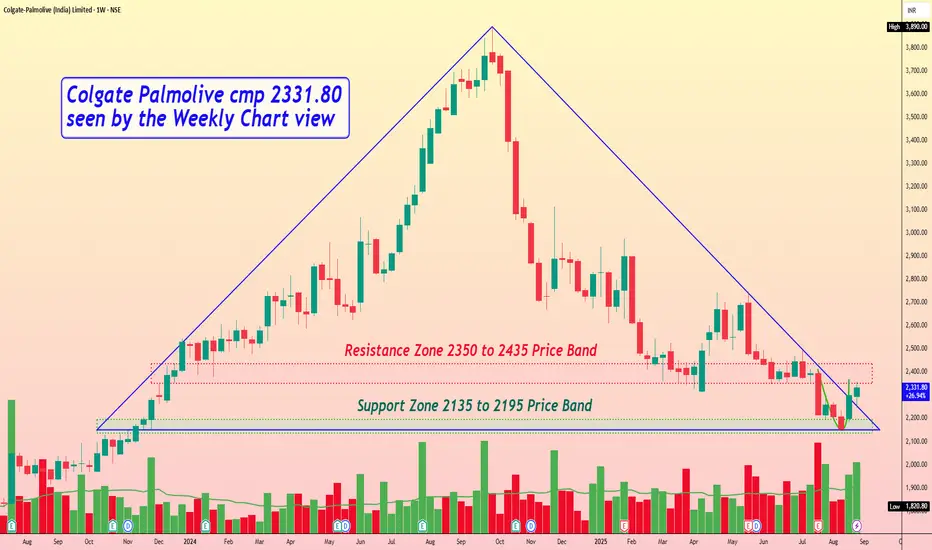
Colgate Palmolive cmp 2331.80 by Weekly Chart viewColgate Palmolive cmp 2331.80 by Weekly Chart view
- Support Zone 2135 to 2195 Price Band
- Resistance Zone 2350 to 2435 Price Band
- Triangle Breakout attempted by current stock chart technical setup
- Support Zone has been under testing retesting phase for the Support Zone
- Bullish Rounding Bottom on Weekly Chart and close Cup & Handle on Daily Chart
- Volumes are seen well in sync with the average quantity traded over the past few weeks
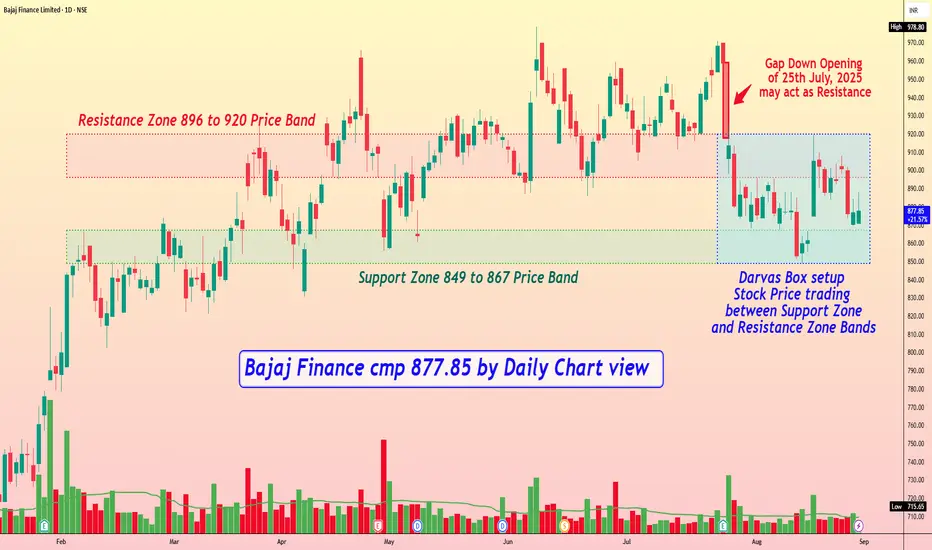
Bajaj Finance cmp 877.85 by Daily Chart viewBajaj Finance cmp 877.85 by Daily Chart view
- Support Zone 849 to 867 Price Band
- Resistance Zone 896 to 920 Price Band
- Gap Down Opening of 25th July, 2025 may act as Resistance
- Volumes in close sync with the average traded quantity over the past few days
- Darvas Box setup : Stock Price trading between Support Zone and Resistance Zone Bands
- Most of the Technical Indicators BB, EMA, MACD, RSI seem getting in the positive momentum
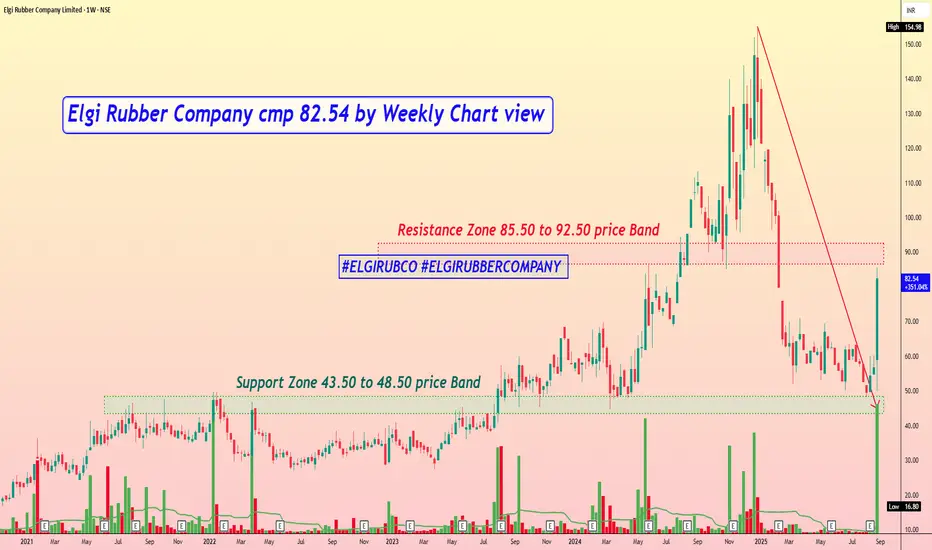
Elgi Rubber Company cmp 82.54 by Weekly Chart viewElgi Rubber Company cmp 82.54 by Weekly Chart view
- Support Zone 43.50 to 48.50 price Band
- Resistance Zone 85.50 to 92.50 price Band
- Price actively reversed from 4 years long past old Support Zone
- Heavy Volumes surged over the last week by demand based buying
- Falling Resistance Trendline Breakout sustained by bullish momentum
- Common Technical Indicators BB, EMA, MACD, RSI are trending positively
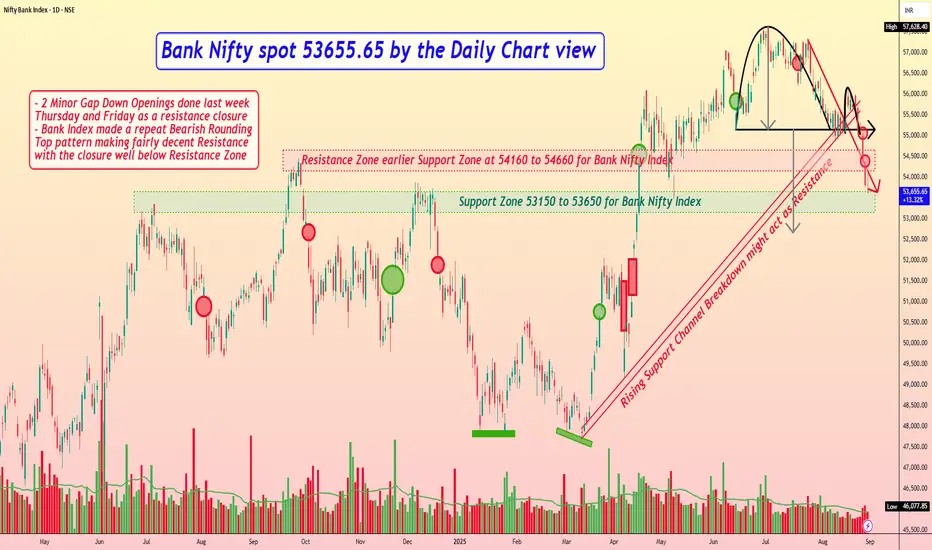
Bank Nifty spot 53655.65 by the Daily Chart view - Weekly updateBank Nifty spot 53655.65 by the Daily Chart view - Weekly update
- Support Zone 53150 to 53650 for Bank Nifty Index
- Rising Support Channel Breakdown might act as Resistance
- Resistance Zone earlier Support Zone at 54160 to 54660 for Bank Nifty Index
- Falling Resistance Trendline sustained by current Weekly closure below trendline
- 2 Minor Gap Down Openings done last week Thursday and Friday as a resistance closure
- Bank Index made a repeat Bearish Rounding Top pattern making fairly decent Resistance with the closure well below Resistance Zone
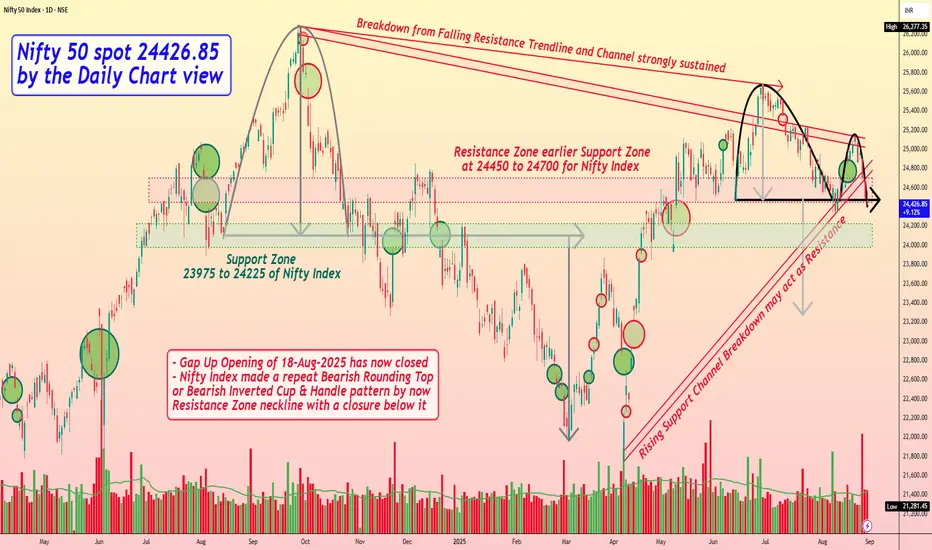
Nifty 50 spot 24426.85 by the Daily Chart view - Weekly updateNifty 50 spot 24426.85 by the Daily Chart view - Weekly update
- Support Zone 23975 to 24225 of Nifty Index
- Gap Up Opening of 18-Aug-2025 has now closed
- Resistance Zone earlier Support Zone at 24450 to 24700 for Nifty Index
- Rising Support Channel Breakdown may act as Resistance for upside move
- Breakdown from Falling Resistance Trendline and Channel has strongly sustained
- Nifty Index made a repeat Bearish Rounding Top or Bearish Inverted Cup & Handle pattern by now Resistance Zone neckline with a closure below it
EURUSD – Wave 5 Long SetupIdea: EURUSD has completed a clean Elliott Wave (1-2-3-4) structure on the 1H chart and is now setting up for the final Wave (5) push to the upside. Price has broken above short-term resistance and is aiming for the next liquidity zone.
🔹 Entry: 1.16609
🔹 Target: 1.17015 🎯
🔹 Stop Loss: 1.16271 ❌
✅ Reasons for Long Bias:
Clear Elliott Wave progression with Wave 5 in play.
Strong recovery from Wave 4 support zone.
Next resistance aligns with Wave 5 target around 1.1700 psychological level.
Favorable R:R ratio, keeping risk well defined.
⚠️ Risk Management: Always trade with position sizing that suits your account. Stop loss is placed below Wave 4 to protect from invalidation.
📌 Disclaimer
This is purely for educational purposes and not financial advice. Please do your own research before entering any trades.

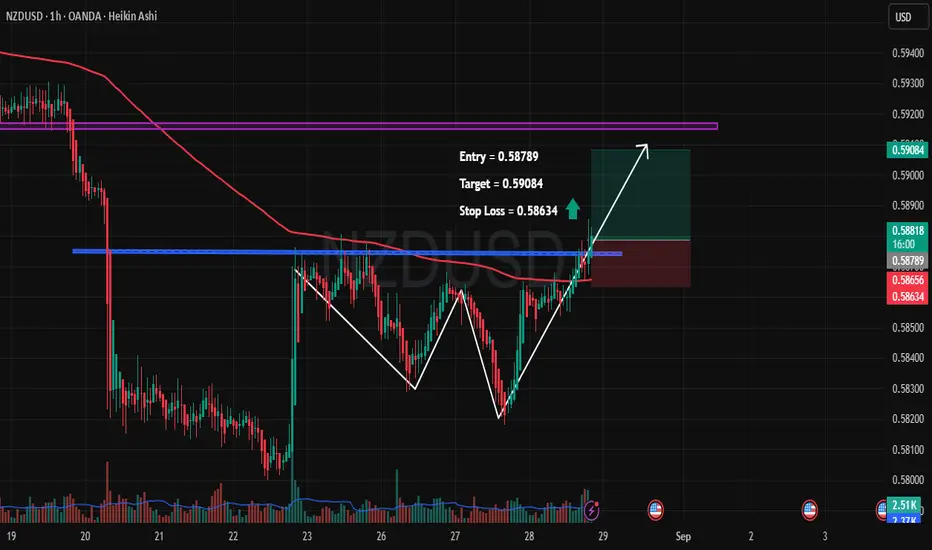
NZDUSD – Breakout Confirmation with Upside Potential🔹 Pair: NZDUSD (1H, Heikin Ashi)
🔹 Entry: 0.58789
🔹 Target: 0.59084 🎯
🔹 Stop Loss: 0.58634 🛑
🔑 Trade Rationale:
✅ Double Bottom Formation – Price respected key support twice, signaling potential reversal.
✅ Breakout Above Resistance – Clean breakout above horizontal resistance (blue line).
✅ 200 EMA Retest – Price is now pushing above the EMA, adding strength to the bullish case.
✅ Volume Spike – Recent surge in buying volume supports the upside move.
📊 Trade Plan:
I’m going long from 0.58789, looking for a quick move toward 0.59084. Risk is limited with a tight SL at 0.58634.
This setup offers a favorable R:R with a technical confluence of breakout + pattern confirmation.
⚠️ Disclaimer: This is not financial advice. Trade at your own risk. Always use proper risk management.
#NIFTY Intraday Support and Resistance Levels - 29/08/2025Nifty is expected to open with a slight gap-up today, providing some relief to traders after yesterday’s weak close. The index is currently trading around the 24,500 zone, which will act as a crucial pivot level for the day. If Nifty sustains above 24,500–24,550, a recovery move may unfold with upside targets at 24,650, 24,700, and 24,750+. A sustained breakout above 24,750 will open the door for further bullish momentum and could extend the rally.
On the downside, if Nifty fails to hold the 24,500 mark and slips below 24,450, selling pressure may intensify. A breakdown here can push the index lower toward 24,350, 24,300, and 24,250 levels. Traders should closely watch intraday price action as volatility is likely to remain high, especially near these support and resistance zones.
Overall, Nifty’s trend remains slightly positive at open, but sustainability above 24,550 is the key for any meaningful upside. Traders should manage risk with strict stop losses and look for confirmation before entering trades.
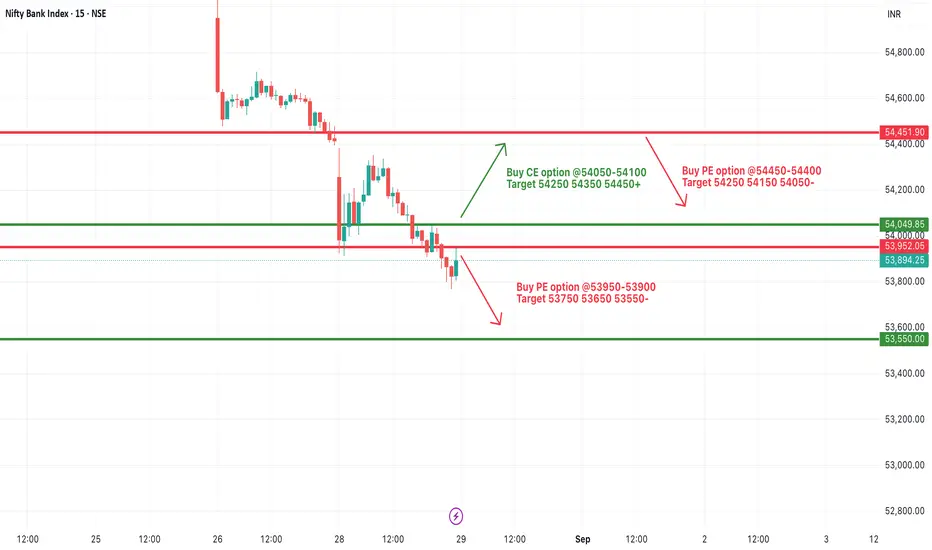
[INTRADAY] #BANKNIFTY PE & CE Levels(29/08/2025)Bank Nifty is likely to witness a slightly gap-up opening today after a weak closing in the previous session. The index is currently hovering near the 53,900 zone, which is a key support area for intraday sentiment. If Bank Nifty sustains above 54,050, it may trigger a short-term correction rally, paving the way for an upside move toward 54,250, 54,350, and 54,450+. This zone will act as a crucial resistance, and only a strong breakout above it can confirm further recovery.
On the downside, failure to hold 54,000–53,950 levels may keep the pressure intact. A breakdown below 53,950 could extend the fall toward 53,750, 53,650, and 53,550. Traders should remain cautious as volatility is expected, and intraday price action near these levels will decide the direction for the day.
Overall, Bank Nifty remains in a weak-to-neutral zone, but a sustained close above 54,050 may provide relief for bulls. Traders are advised to maintain strict stop losses and look for opportunities in line with intraday momentum.
Diffusion Engineers cmp 357.70 by Daily Chart view since listedDiffusion Engineers cmp 357.70 by Daily Chart view since listed
- Support Zone 325 to 345 Price Band
- Resistance Zone 365 to 385 Price Band
- Volumes are seen spiking above the average traded quantity
- Price trending and respecting the rising Rising Support Trendline
- Dotted Falling Resistance Trendline Breakout seems been attempted
- Multiple Bullish Rounding Bottoms rejected at Resistance Zone neckline
- Price reversed multiple times and backed out by strong Resistance Zone since listed
- Breakout above Falling Resistance Trendline from ATH level seems well sustained for now
- Price Breakout only possible by continued Volumes increase and few days closure above Resistance Zone

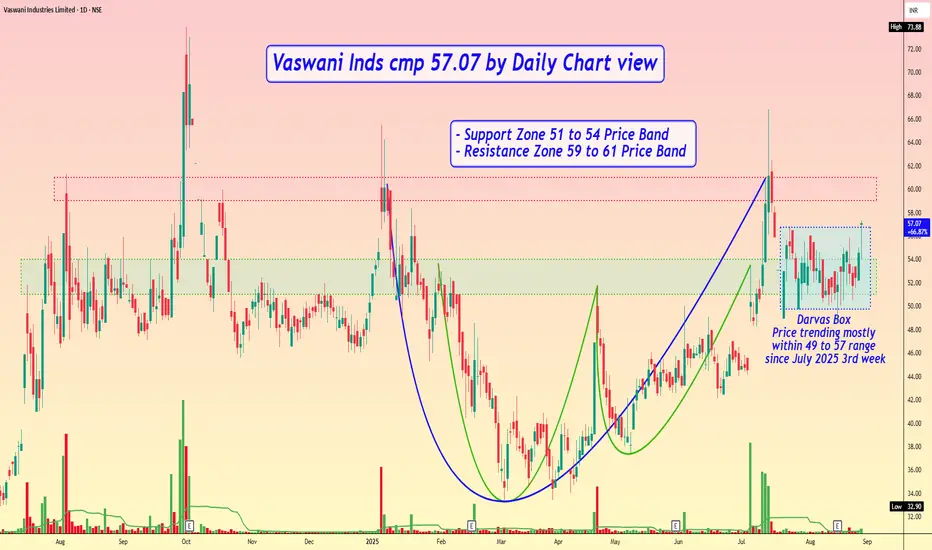
Vaswani Inds cmp 57.07 by Daily Chart viewVaswani Inds cmp 57.07 by Daily Chart view
- Support Zone 51 to 54 Price Band
- Resistance Zone 59 to 61 Price Band
- Volumes are in good sync with average traded quantity
- Bullish Rounding Bottoms made by Support Zone neckline
- Another Large Bullish Rounding Bottom made by Resistance Zone neckline
- Darvas Box - Price trending mostly within 49 to 57 range since July 2025 3rd week
#NIFTY Intraday Support and Resistance Levels - 28/08/2025Nifty is expected to open with a gap-down today, indicating weak sentiment after a sharp decline in the previous session. The index is currently trading near the 24,700 zone, which will act as a critical intraday pivot level. Sustained movement below 24,700 may invite further selling pressure, with immediate downside targets placed at 24,600, 24,550, and 24,500. A decisive break below 24,500 could intensify bearish momentum, dragging the index towards 24,350–24,250 levels in the short term.
On the upside, recovery signs will only emerge if Nifty manages to hold above 24,750. A strong move above this level may trigger a bounce, with upside targets at 24,850, 24,900, and 24,950+. However, given the broader weakness, such up-moves may face stiff resistance at higher levels.
Overall, the bias remains negative for the day, with traders advised to stay cautious and follow strict risk management. Intraday volatility is likely to remain high, making it important to track price action around the key support and resistance zones.

[INTRADAY] #BANKNIFTY PE & CE Levels(28/08/2025)Bank Nifty is expected to witness a gap-down opening today, reflecting weakness in sentiment as the index continues to face selling pressure. The price action has slipped below the 54,450–54,400 zone, which now acts as a crucial resistance level for the day. Sustained trading below this zone may trigger further downside moves, with immediate support seen at 54,250 and 54,150. A break below these levels could accelerate weakness toward 54,050 and extend further toward 53,750–53,550 zones.
On the upside, recovery attempts will gain strength only if Bank Nifty manages to reclaim 54,550–54,600 levels. In such a case, a pullback rally could push the index towards 54,750, 54,850, and 54,950. However, this zone is likely to act as a strong hurdle unless broader sentiment improves.
Overall, the bias remains negative as long as the index trades below 54,450, with traders advised to maintain a cautious approach. Intraday moves are expected to remain volatile, and strict risk management will be key to navigating today’s session.

Reversal trade in BTCBTC seems taking reversal on 4H chart after creating a W pattern, breaking it, pull back and move in the direction.
it may high RnR trade.
P.S. - this is just a technical analysis not a trade advice.

NIFTY50 - Head & Shoulders Pattern Signals Bearish RiskIn the 30-minute chart of NIFTY 50, a classic Head & Shoulders pattern has clearly emerged, which could act as a potential trend reversal signal. This pattern often appears near the end of a bullish phase and can warn traders of a short-term or medium-term top.
The Left Shoulder formed around 20th August, followed by a sharp rally into the Head near 25,150 levels on 22nd August. The price then retraced to the neckline support zone around 24,850, bounced to create the Right Shoulder, and is now hovering just above this critical support.
Support Zone Becomes a Decider
The support zone between 24,850 and 24,880 has now become the key level to watch. A clean break below this neckline support could activate the pattern, confirming a bearish breakdown with a projected target near 24,600 and possibly extending towards 24,450 if momentum builds.
However, the pattern is not yet confirmed. Price is still within the formation, and a strong bounce from this support level could invalidate the breakdown scenario, potentially triggering a short-covering rally.
What Traders Should Monitor
- Breakdown Confirmation: A 30-min candle closing below 24,850 with increasing volume is necessary to confirm the bearish setup.
- Invalidation Point: If the index breaks above 25,050, the right shoulder fails, and the pattern gets invalidated.
- Target Calculation: The vertical distance from the Head (25,150) to the neckline (24,850) is approx. 300 points, which gives a downside target near 24,550.
Risk Management
- Aggressive Sellers: Can enter short below 24,850 on confirmation, keeping a tight SL above 25,000.
- Conservative Approach: Wait for retest of broken support or enter only if price starts forming lower highs below the neckline.
- No Entry Yet: The structure is not triggered yet. Premature trades can lead to whipsaws.
Conclusion
This Head & Shoulders setup in NIFTY 50 is worth tracking closely. If confirmed, it can offer a high-probability short trade in the coming sessions. However, until the neckline breaks with conviction, traders must maintain caution and avoid early entries. The market is currently at a make-or-break point, and the next move will likely set the tone for the week ahead.
