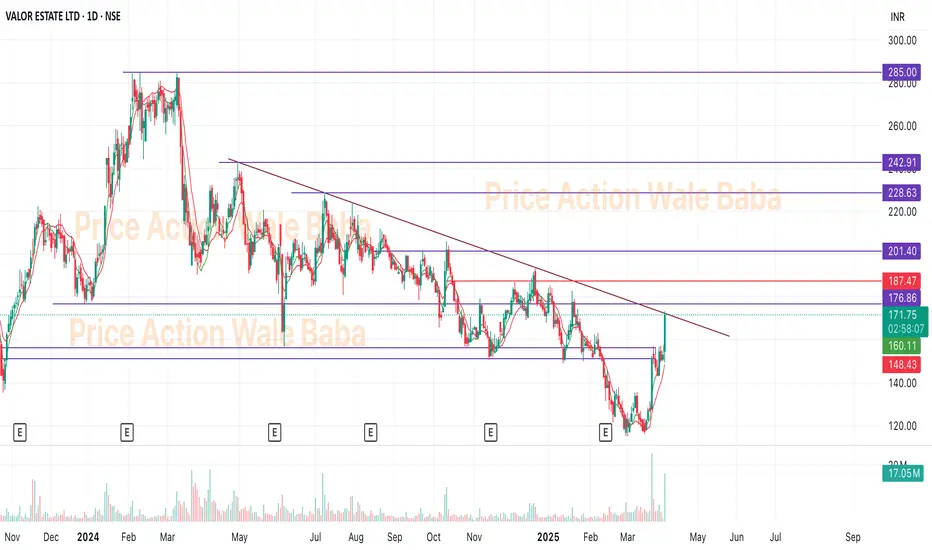
DBReality - Near BreakoutDB Reality near breakout.
After long consolidation, it's ready to give big up move.
It was trading in the channel and consolidation going to end soon.
Hold for the next 1-2 year for the target of 300.
Priceactionanalysis
Max Financial Services Ltd – Trend Reversal in Play?🚀 Technical Analysis Breakdown:
The yellow trendline shows a long-term support, which has held well despite recent corrections.
The red downtrend line indicates a recent bearish phase, which has now been broken with a strong bullish candle.
The stock has bounced from the trendline support, showing signs of strength.
Above all the strong Pinbar candle looks amazing for a candle close .
🔎 Your Take? Do you see further upside or a pullback? Comment below! 👇

Asian Energy Service at Major levelAsian Energy Service at Major level is either get resistance from 276 or give breakout this is the important level I have drawn here, watch it carefully and take a trade.

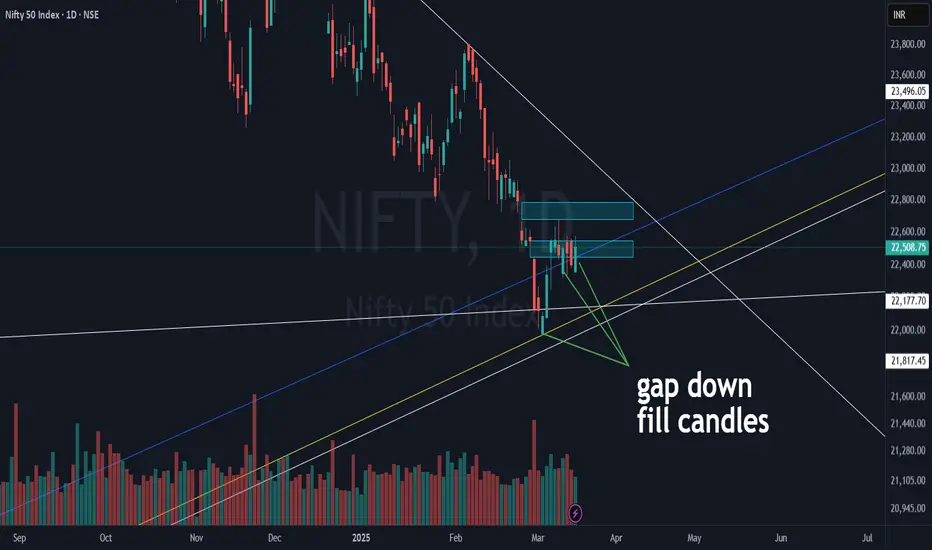
NIFTY 50 | Critical Levels & Gap-Fill Zones in Play!Nifty 50 continues to react strongly to key levels, but the overall structure still remains in correction mode. Let’s break it down:
White Lines (DTF Trendlines) ⚪:
2 key support lines and 1 counter-trendline (CT).
The DTF CT (near-term resistance) is around 500 points away from CMP, making it the next big test for bulls.
Blue & Yellow Trendlines (WTF & MTF Support) 📉:
A cluster of support created a bounce, but not as strong as past recoveries seen in 2023 or early 2024.
Despite FII selloffs & global stress, technical levels are holding up well!
Gap Zones (Blue Boxes) 📦:
The nearest gap got filled, and the next one sits just below our DTF white CT.
This could act as a magnet for price action in the near term.
Gap Down Fill Candles :
A few gaps got filled in a single session, showing bullish pressure at lower levels.
But, without a higher high - higher low structure or a DTF white CT breakout, the index stays in a corrective phase.
Monstrous Volatility following Tariffs and NFP ForecastsHello Traders, It's that time of the month! :D Not what you are thinking.. But It's NFP Week! What an eventful week it's been already for the Euro. 450 Pips and we still have 3 more trading sessions to complete. I looked back two years and still did not find a week of matched volatility. A Major upside push has seen EurUsd tear it's way back from the depths of near Par (1.04) to well back inside the Monthly range between 1.104 and 1.056.
Trump Tarriff speeches, and fueled further by weak U.S. ADP data on Wednesday has given the Euro a monstrous exscuse to gain more value than it's seen in Years aginagst the dollar. Prepare for a wild end of the week with Jobs data forecasted to improve slighlty across the past data point.
What prices do we like moving into NFP day?
-Bullish targets are a tap into 1.08740, Weekly Resistaance Level
-Bearish targets could be 1.074
Otherwise we have some 1hr and 4hr Zones in the middle which could provide good risk/reward trade ideas.
Please leave a Rocket if you enjoyed and Follow for more Analysis.

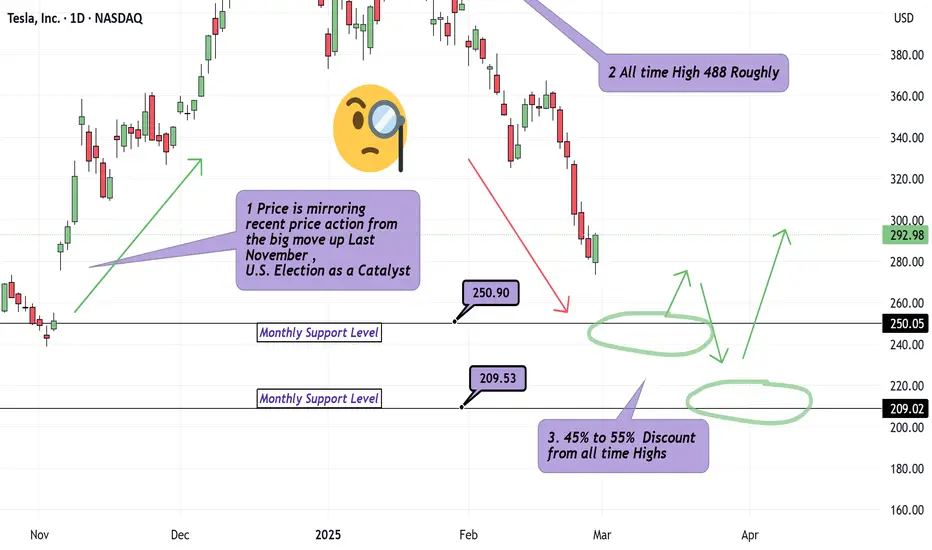
What is an Appropriate Tesla Discount? Multiple Timeframes!Hello Traders.. It's been too long.
We are back with our first analysis in over 4 months. We answer : What is an appropriate price to either jump on the train or scale into original positions on Tesla? Jumping in around 250, probably decent for at least a 4Hr to Daily Chart Swing. Safer Longs appear to be around 209 as I have outlined with green arrows, labeling the multiple pivots in the recent 5 Year range on Tesla. Tesla is coming down alongside the broader Indices which can be expected. Just because Friday Feb 28th showed us a Solid Hammer looking candle suggesting strong buying power, this does not mean much to me for 3 reasons.
1) This price action has developed in the middle of the move up we observed during Election week late last year.
2) The candle closed without a top wick and so the next daily candle , in theory, has no range to fill moving forward.
3) Momentum at the moment is also Bearish.
Discipline Traders! Leave a comment or Boosted rocket if you'd like to see similar analysis.
Ethereum (ETHUSD) - Zooming out and taking a viewEthereum seems to be moving towards near term support line and a trendline on weekly time frame.
It may take support here and give a bounce.
If the support breaks, then more pain is coming for it.

ONGC I OIL Burning Bright : Inverted H&S Pattern!!Hello Traders,
- ONGC is trading at a place called AOI (Area of Interest) A place from where price usually reverses.
- 218 levels is acting as a strong support pushing prices higher after a intraday low of about 3% making a big pin bar candle on 1D chart
- Inverted head and shoulder on 15m timeframe.
PRO TIP/-
The Entry Line is the Neckline of the inverted Head and shoulder.
Target 1:- 228
Target 2 :-231
Entry Criteria
Strong Close above Entry Line (225) 15mins TF
Stoploss
Entry Candle Low (not more than 0.8%)
Not an Investment Advise

MAHARASTRA SEAML - Aggressive Reversal Bet!Price Analysis & Overview:
1. EMA support taken.
2. Strong Fib support zone.
3. Blast above 900
4. 100%+ Potential
5. Need good volumes
6. Entry above 710 post confirmations
7. Strong buying candle formation is needed.
- Stay tuned for further insights, updates and trade safely!
- These are my personal views.
- If you liked the analysis, don't forget to leave a comment and boost the post. Happy trading!
Disclaimer: This is NOT a buy/sell recommendation. This post is meant for learning purposes only. Please, do your due diligence before investing.
Thanks & Regards,
Anubrata Ray

Inverted Head & Shoulders: 3 Must-Know Variations for Traders!Not all Inverted Head & Shoulder patterns work the same way! Here’s a deep dive into 3 powerful variations that can help traders find strong trend reversals and breakouts in swing & momentum trading

ONGC : Is oil Going to burn?
Technical View
Box trading strategy in which you identify a stock consolidating for couple of days and trade in the direction of the breakout. In case of ONGC the stock was consolidating for about three days before breaking out earlier today.
PRO TIP
Use the High of the candle as your stop loss and trail it to either protect profits or hold your trade for longer duration.
Target 227 Intra-day Target
Fundamentals
Weak Q3FY25 Results:
ONGC's consolidated net profit attributable to owners declined by 19.4% to ₹8,621.69 crore in Q3 FY25, compared to ₹10,703.13 crore in the same period last year. This drop was attributed to lower global crude prices.
The company reported a 6.9% decrease in net profit for the quarter, standing at ₹9,784 crore, down from ₹10,511 crore in the same period last year.
ONGC's gross revenue also showed a slight decline of 0.7%, falling to ₹1.66 trillion in Q3 FY25, compared to ₹1.67 trillion in Q3 FY241. The company's revenue from operations also saw a decline, reaching ₹166,096.68 crore.
Bearish Trend: The stock is trading below its 5-day, 20-day, 50-day, 100-day, and 200-day moving averages, which indicates a bearish trend in its short to long-term performance.
Brokerage Views:
CLSA has cut its FY25 EPS estimate by 5% due to cautious outlooks on the company's production and profitability
Not an investment advice

Motherson Sumi-Can it fly from here?Motherson Sumi is now available at a very beautiful demand zone.
It is retesting previous cup and handle breakout and also is near a trendline support.
Any bounce from this zone will give good returns in stock.
Levels are mentioned on chart. One of the best stock within auto ancillary sector.
If you trust EV theme, this stock should be on radar.

3 Price action pattern for swing trading I daily make educational content videos for swing / positional trading

Amazing swing trading stocks for 29 Jan 2025I daily make educational content videos for swing / positional trading

2 Amazing swing trading ideas for 27 Jan 2025I daily make educational content videos for swing / positional trading

3 Swing Trading ideas that can give you Amazing Returns I daily make educational content videos for swing / positional trading

Swing trading idea Using the concept of Gaps and MtfaI daily make educational content videos for swing / positional trading

2 Amazing swing trading ideas for 17 Jan 2025 I make educational content videos for swing / positional trading

Kaveri Seeds, Strong CloseKaveri Seeds gave Strong weekly Close. I'm aiming for 50% from here.
🚨 DYOR
🚨 SL must it depends on ur risk appetite

GREENPANEL easy 40% GREENPANEL is at a strong support level, aiming for a 30% gain from the current market price. Hold for the medium term.
🚨 DYOR
🚨 SL must it depends on ur risk appetite

EI HotelEI Hotels looks good on dip.
We can accumulate it on every bottom and fine to hold till next the December.
Company has good fundamentals and better work progress.
Above 445, we will see 470-75.
Above 505, target is 625.

4th Breakout in ITINSE:ITI this is my 4th Idea on ITI on the 4th Breakout in the Past Few Days although now I'm not sure why it is behaving like this but like all the previous three trades it might just go on and on as the price and Volume action suggests although it will be risky.
📌Thank you for exploring my idea! I hope you found it valuable.
🙏FLLOW for more
👍BOOST if useful
✍️COMMENT Below your views.
Meanwhile, check out my other stock ideas below until this trade is activated. I would love your feedback.
Disclaimer: This analysis is intended solely for informational and educational purposes and should not be interpreted as financial advice. It is advisable to consult a qualified financial advisor or conduct thorough research before making investment decisions.

Bullish Outlook on #AIIL#AIIL Authum Investment & Infrastructure Ltd. has shown a promising breakout from a prolonged consolidation phase, forming a Cup and Handle pattern on the daily chart. Key
observations:
Volume Confirmation: The breakout is accompanied by a significant rise in volume, confirming strong buying interest .
All-Time High Potential: The price is moving toward uncharted territory, suggesting strong bullish momentum.
Support Zone: The consolidation range now acts as a strong support zone for any pullback.
Relative Strength: The stock is outperforming its peers, showcasing superior relative strength.
Recommendation:
Entry Point: Buy on dips near the breakout level (around ₹1,850–₹1,900) for optimal risk-reward.
Target: ₹2,100 and above, based on pattern projections.
Stop Loss: Place a stop loss below ₹1,750 to manage risk.
Authum appears to be in Stage 2 (Advancing), making it an attractive candidate for positional traders. Fundamentals and further price action will dictate long-term potential.
