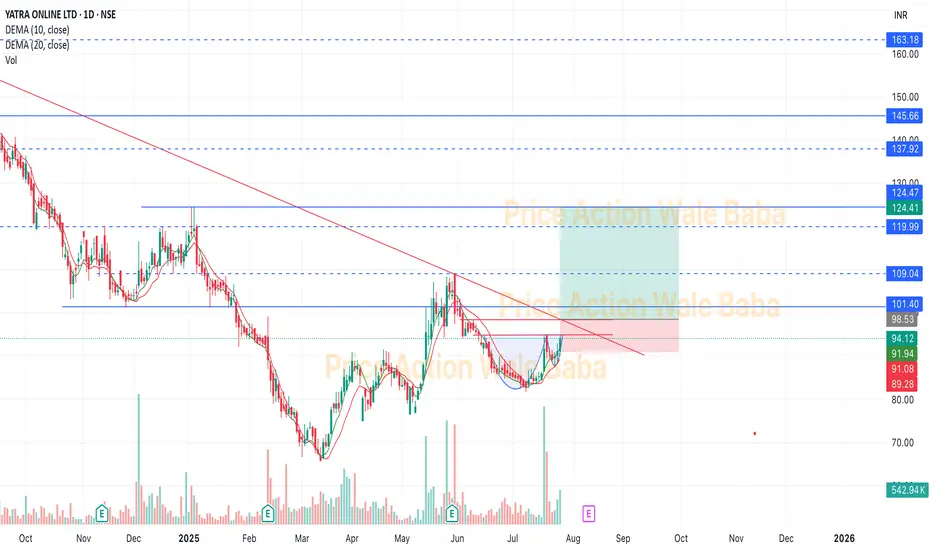
Yatra Online LtdYatra Online Ltd
a) YOL deals in the entire value chain of travel and hospitality, covering B2C and B2B segments.
b) It is the largest Corporate travel services provider, and one of the largest OTAs with ~80,000 domestic hotels and homestays contracted in ~1497 cities.
c) It provides a Real-time and Integrated SaaS Tech Platform which is accessible through the desktop & Mobile apps.
d) The company has a customer base of over 1,300 large corporates with addressable employee base of 9+ million employees.
Service:
The company is one of India’s leading online travel platforms, offering comprehensive corporate travel services to over 850 corporate clients. It facilitates bookings for domestic and international flights, hotels, holiday packages, buses, trains, cabs, homestays, cruises, and local activities. With a network of approximately 108,000 hotels and homestays across 1,500 Indian cities and access to around 2 million hotels globally, it stands as the largest domestic hotel platform in India.
Market Cap: ₹ 1,477 Cr.
Promoter holding: 64.5 %
FII holding: 2.82 %
DII holding: 19.1 %
Public holding: 13.6 %
Debt: ₹ 78.4 Cr.
Debt 3Years back: ₹ 62.8 Cr.
Looks good to buy on every deep, once breakout come it will give good movement.
Priceactionsignals
EURUSD 4H chart - Short Setup🔍 Chart Overview
Pair: EURUSD
Timeframe: 4H
Pattern Identified: Head & Shoulders (bearish reversal pattern)
Trendline: Broken — signals end of previous uptrend
Market Structure: Lower highs forming → beginning of a downtrend
📉 Bearish Trade Setup
1. Entry Zone
Marked just below the broken trendline and neckline of the Head & Shoulders.
Entry: ~1.12450–1.12500
Price has already broken below neckline → confirming the pattern.
2. Stop Loss (SL)
Placed above the right shoulder, around 1.14096.
Smart placement as a break above would invalidate the Head & Shoulders pattern.
It also covers any minor retracement into the supply zone.
3. Take Profits (TP)
1st TP: ~1.09000 zone
🔹 This zone acted as previous structure support
🔹 Good area to book partials or move SL to breakeven
2nd TP: ~1.03258
🔹 Long-term target
🔹 Based on major previous demand zone visible on the left (possibly from daily chart)
🔻 Technical Analysis
✅ Bearish Confirmation
Head and Shoulders formation: Reliable trend reversal signal
Break of Trendline: Confirms the structure has shifted
Break of neckline: Entry confirmation
Retest of neckline/structure: Entry after confirmation makes it safer
🔎 Confluences
Confluence Result
Head & Shoulders ✅ Strong reversal pattern
Break of trendline ✅ Indicates shift in trend
Break + Retest of neckline ✅ Classic confirmation
Entry after confirmation ✅ Higher probability
SL above right shoulder ✅ Strategic placement
TP levels at structure & demand ✅ Logical TP zones
🛡️ Risk to Reward (RRR)
RRR is very favorable, roughly:
1st TP ≈ 1:2
2nd TP ≈ 1:4 or higher
A well-planned swing trade
📌 Final Recommendation
✅ This is a clean swing trade setup based on price action, pattern, and structure shift.
🔄 Consider partial close at 1st TP and trail SL.
🧠 Maintain discipline on SL—if price violates the right shoulder, exit.

Patanjali Food - Near BreakoutPatanjali Food looks like near the breakout. NSE:PATANJALI
We can see sharp up-move when give the ATH breakout and good to hold for the long time.
Market cap also good, also available in F&O.
Fundamentals are strong and we know FMCG sector is going to spike soon.
Ruchi Soya Industries Limited is engaged primarily in the business of processing of oil-seeds and refining of oil for edible use.

REGN SignalReason for this trade
1: Market is taking pullback from trendline
2: market is near high supply area

Will nifty break 200 MA…Will nifty break 200 ma? Still it holds at good support. But considering that events let’s wait and watch the movement.

📈 Pre-open Chart #PriceAction Analysis by #KRMG (11 Nov)👉 Stock 2- #UPL
👉 Sector - COMMODITIES
👨🏻🏫 Analysis Timeframes - Hourly and 15 min (Intra)
🎯 Commentary - Stock is in uptrend in Hourly timeframe and has given an IMPULSIVE UPMOVE then it is able to close near days High & on Yesterday it broken the important resistance of range High 760 Level
15 Min Trend is Bullish and it also is able to close near the Day's High so Buyers are dominant till now and a good breakout above CRITICAL ZONE may lead it to reach till 790 Level
🎯 Coming to sectoral pattern - #NIFTYCommodities after retracement to 5650 Level now may again start Uptrend which may lead it to reach till 6100 Level
#KRMGPriceAction
#LearnWithKRMG

📈 Pre-open Chart #PriceAction Analysis by #KRMG (11 Nov)👉 Stock 1- #PVR
👉 Sector - MEDIA
👨🏻🏫 Analysis Timeframes - Hourly and 15 min (Intra)
🎯 Commentary - It has strongly fallen nearly from 1840 level as per hourly timeframe which is its ALL TIME HIGH Level and now it is trying to reverse or retrace from it
Yesterday on its way to downtrend it got strong rejections from important Level of 1810 and continued the downtrend till day end
It has space till 1740 on downside if it sustains below CZ, and may even reach near 1700 level if convincingly closed below 1765
🎯 Coming to sectoral pattern - #Media is showing Good Uptrend and now accumulating to its ALL TIME HIGH LEVEL 2380
#KRMGPriceAction
#LearnWithKRMG

📈 Pre-open Chart #PriceAction Analysis by #KRMG (9 Nov)👉 Stock 2 - #TECHM
👉 Sector - IT
👨🏻🏫 Analysis Timeframes - Hourly and 15 min (Intra)
🎯 Commentary - It has shown good strength in Upward direction from 1470 Level as per Hourly timeframe and now trading near to its ALL TIME HIGH Level
It has continued good Higher Low pattern as per 15- Min timeframe and also yesterday after neutral opening it continued Upmove and then able to close near the Days High in Second half of Market
Now it has space till 1630 Level which is its ALL TIME HIGH Level and buy Trade can be taken only if breaks CZ with good volume
🎯 Coming to sectoral pattern - #NiftyIT after giving down move from All Time High now taken support from 34300 Level
#KRMGPriceAction
#LearnWithKRMG

📈 Pre-open Chart #PriceAction Analysis by #KRMG (9 Nov)👉 Stock 1- #CHOLAFIN
👉 Sector - FINANCE
👨🏻🏫 Analysis Timeframes - Hourly and 15 min (Intra)
🎯 Commentary - It is in very strong uptrend and on Yesterday it shown strong strength near ALL TIME HIGH and was able to close to the day's High
Watch for Price Action near the CRITICAL ZONE. If breakout is clean then around 660 level is next Target
For our students, watch for any volume spikes around PDH zone , to identify fake breakouts
🎯 Coming to sectoral pattern - #NiftyFIN after giving strong Uptrend it is now trading near to its ALL TIME HIGH Level
#KRMGPriceAction
#LearnWithKRMG

BTC 4HOUR CHART ANALYSISIn this post I give a forget of BTC
This is only educational purpose
Trade is your own risk....

APARINDS WEEKLY BREAKOUTApar Industries weekly TL breakout. Levels with detailed analysis mentioned on the chart. Follow me on Tradingview for more updates.


NIFTY50- Expecting some Correction Again?Last week on Monday, the fall that we saw was on account of a stock exchange glitch. However, in the same week the whole loss was nullified leaving evryone at sea.
But now if I go by what the chart is telling me, it says the chart pattern formed is a Rising Wedge Pattern.
There is also a Bearish Divergence along with the ADX losing steam.
Now , either tomorrow the price breaksout and then starts taking support of the channel border or if it breaks down then I see a correction atleast till the red dashed lines. A fall below those levels could trigger a bigger fall.
Let's be a little cautious before blindly breaking the bank.

SUN PHARMACEUTICAL SUN PHARMACEUTICAL
Sun pharma has been getting rejections from 505-510 level many times
1.if the stock is able to give the closing above this level then it may touch
540-550 easily
2. Look at the volumes it has been rising from last 1 week, again a sign of bullishness
If you want me to do such detailed analysis, please comment on the same and like it
should you need any further information please comment I shall revert back to you soon
Thanks and regards

SUNPHARMA FORMING CUP HANDLE, LOOKING GOOD ABOVE 504SUNPHARMA FORMING CUP HANDLE, LOOKING GOOD ABOVE 504.
Note - These are not buy or sell recommendation. Kindly do your own analysis before investing your money into any kind of financial instrument.

BANDHANBNK looking good above 375BANDHANBNK looking good above 375.
Note - These are not buy or sell recommendation. Kindly do your own analysis before investing your money into any kind of financial instrument.

GBPUSD Daily Trading IdeaThe pair have nice rejection by printing PB signal at expected key level. Expecting some down move.


SBIN good for short term.Today SBI has given an break out with good volume on Daily Time Frame. If it will be closing above 200 in Weekly Time Frame i will take this for short term. Target is mentioned on the chart.
Note - These are not buy or sell recommendation. Kindly do your own analysis before investing your money into any kind of financial instrument.

TATA MOTORS GOOD FOR SHORT TERMTATA MOTORS GOOD FOR SHORT TERM.
Note - These are not buy or sell recommendation. Kindly do your own analysis before investing your money into any kind of financial instrument.

TITAN can be good candidate forming symmetrical triangle.TITAN can be good candidate forming symmetrical triangle.
Note - These are not buy or sell recommendation. Kindly do your own analysis before investing your money into any kind of financial instrument.


Berger Paint Long positional BuyHiii this is trader kanishk
here we saw a prefect breakout of flag pattern of ASCENDING TRIANGLE Pattern
second. there is a retracement on lower time frame which we consider as an opportunity.
i've drawn an trendline . After breakout i am going to buy this.
i am not recommending you, i am just sharing my analysis here.
