Chumtrades XAUUSD H2 | Is the Liquidity Sweep Over?Chumtrades – XAUUSD H2 | Has the Liquidity Sweep Finished, or Is There More Downside Ahead?
On Friday, the market reacted strongly after Trump’s comments regarding Kevin Hassett, when Trump expressed his preference for Hassett to remain in his current role rather than taking a new position.
👉 As a result, gold printed a long wick liquidity sweep back into the prior ATH zone, around 4530–453X, before closing back above 456X.
This brings us to the key question:
Was this sweep enough for the BUY side, or is the market still looking to test lower levels?
Political developments will be a key driver for gold direction in the coming week.
📰 Key Political Factors to Monitor
1. Trump – Greenland
The US has imposed 10% tariffs, with the possibility of increasing them to 25% on countries that do not support the annexation of Greenland
No fixed deadline, tariffs remain until Greenland becomes part of the US
→ This is a supportive factor for gold, especially amid rising geopolitical uncertainty
→ This news may directly impact the market open
→ If price reacts strongly, avoid SELLs near resistance
2. Iran – Protests
Monitor the risk of Trump returning to direct intervention
→ A potential headline-driven volatility trigger
🟢 Key Support Zones to Watch
4530 – 4535
4515 – 4510
4480 – 4482
4462
4410 – 4407
🔴 Key Resistance Zones to Monitor
4618 – 4628
4648 – 4650
4655 – 4660
4698 – 4699
⚠️ Trading Notes
Price levels are zones for observation, not instant entry points
SELL setups around 462X must be evaluated based on news reaction
If momentum accelerates on headlines → stay flat and avoid trading against strength
💬 Question for the New Week
Is the market finishing its liquidity collection on the BUY side,
or was Friday’s sweep the final test before the next leg higher?
📌 Follow Chumtrades for proactive market analysis, structured trade planning, and risk management insights.
Priceactiontrading

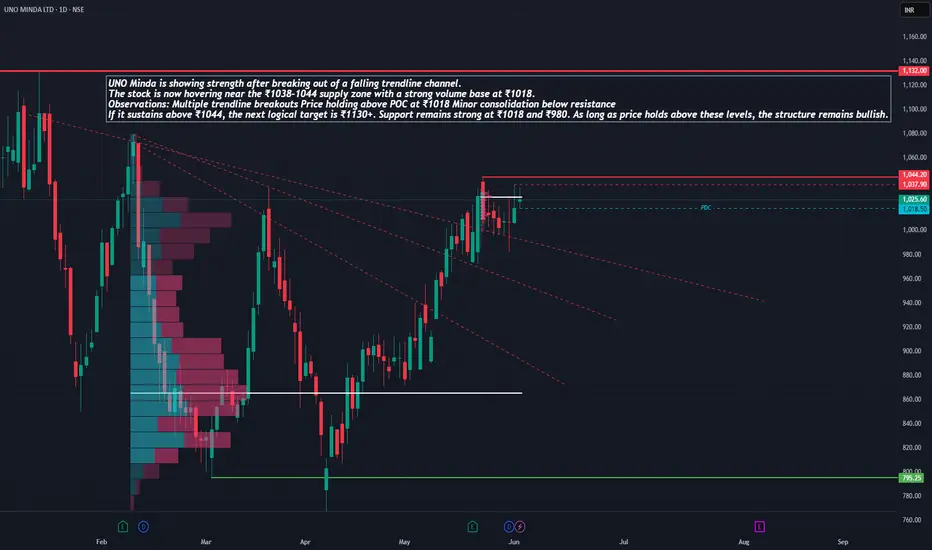
UNO MINDA – Ready to Revisit All-Time Highs?UNO Minda is showing strength after breaking out of a falling trendline channel. The stock is now hovering near the ₹1038–1044 supply zone with a strong volume base at ₹1018.
Observations:
Multiple trendline breakouts
Price holding above POC at ₹1018
Minor consolidation below resistance
If it sustains above ₹1044, the next logical target is ₹1130+. Support remains strong at ₹1018 and ₹980. As long as price holds above these levels, the structure remains bullish.
Like, comment your thoughts, and share this post
Explore more stock ideas on the right hand side your feedback means a lot to me!
Disclaimer: This post is for educational purposes only and should not be considered a buy/sell recommendation.
The Day I Trusted My Setup - And Finally Found Peace in TradingHello Traders!
Every trader remembers the day they finally stopped fighting the market and started trusting their setup.
Not because the setup became perfect, but because the trader stopped panicking, stopped doubting, and stopped reacting emotionally to every candle.
This post is about that mindset shift.
The shift that quietly turns chaos into clarity.
1. The Problem Was Never the Strategy
Most traders have decent setups, but terrible self-control.
They enter early, exit early, or avoid taking the trade completely.
They blame indicators, brokers, markets, everything except their own fear.
The truth is simple:
Your setup doesn’t fail. Your belief in the setup fails first.
2. The Market Became Peaceful the Day My Mind Did
I stopped questioning every candle.
I stopped comparing my trades to others on social media.
I stopped jumping from one strategy to another.
When the mind becomes quiet, the market stops feeling like a threat.
3. One Setup, Repeated Consistently, Is More Powerful Than 10 Indicators
When you trust your setup, you stop looking for confirmation everywhere else.
Your eyes automatically see the same pattern repeat again and again.
You develop confidence, not from winning, but from understanding.
A trader doesn’t need more tools.
A trader needs one tool they fully trust.
4. Peace Comes From Acceptance, Not Prediction
You stop trying to predict the market.
You stop expecting every trade to win.
You start accepting that your job is execution, not perfection.
Peace is not when trades stop losing
Peace is when losses stop scaring you.
5. Trusting the Setup Automatically Improves Discipline
You follow your entry rules without hesitation.
You respect your stop loss without fighting it.
You let profits run because you no longer fear giving them back.
Discipline is the natural outcome of trust.
Rahul’s Tip:
Your setup doesn’t need to be extraordinary, it just needs to match your personality.
Once you stop jumping strategies and commit to one approach fully, trading becomes quieter, calmer, and finally peaceful.
Conclusion:
The day you trust your setup is the day trading stops feeling like a battle.
You stop chasing the market and start flowing with it.
With clarity, discipline, and trust, profitability becomes a byproduct, not a target.
If this post reflects your trading journey, like it, share your experience, and follow for more psychology-based insights!
GNFC - BreakoutGNFC - Looks like bottom at strong support.
Once above the trendline and give breakout, we will see big rally on upside.
Keep buying and hold for the long term.
Targets are 540-600-650-700++++

Garuda Construction – Cup & Handle Breakout | Swing Trade PlanGaruda Construction has given a textbook Cup & Handle breakout backed by strong volume and solid fundamentals.
Technical Analysis
A Cup & Handle pattern has formed with a neckline breakout above ₹200.
Stock closed strongly at ₹216.33 (+9.66%) with massive volume (7.5M vs 3.1M avg) - confirms institutional buying.
Price is trading above 20 EMA (₹200) and 50 EMA (₹188) → strong uptrend.
Weekly timeframe also shows a fresh breakout, adding higher timeframe confluence.
Structure remains bullish as long as it holds above ₹200 demand zone.
Fundamental key area
Construction & Engineering segment seeing strong order inflows, aiding medium-term growth. Strong QoQ Growth: Latest quarter (Jun-25) revenue jumped 55% to ₹125 Cr.
ROE ~29%, OPM ~29% → excellent efficiency.
Balance Sheet: Debt levels appear very low, improving stability.
Valuation: Mid-cap with growth momentum, attractive vs large-cap peers.
Swing Trade Plan
Entry Zone: ₹212–216
Stop Loss: ₹198 (below neckline + demand zone)
Targets:
T1: ₹225 (early booking)
T2: ₹240 (swing continuation)
T3: ₹260 (Cup & Handle measured move)
Risk–Reward: Up to 1:2.4
Note: This is an educational swing trade analysis based on price action + fundamentals. Not financial advice — do your own due diligence before trading.

Yatra Online LtdYatra Online Ltd
a) YOL deals in the entire value chain of travel and hospitality, covering B2C and B2B segments.
b) It is the largest Corporate travel services provider, and one of the largest OTAs with ~80,000 domestic hotels and homestays contracted in ~1497 cities.
c) It provides a Real-time and Integrated SaaS Tech Platform which is accessible through the desktop & Mobile apps.
d) The company has a customer base of over 1,300 large corporates with addressable employee base of 9+ million employees.
Service:
The company is one of India’s leading online travel platforms, offering comprehensive corporate travel services to over 850 corporate clients. It facilitates bookings for domestic and international flights, hotels, holiday packages, buses, trains, cabs, homestays, cruises, and local activities. With a network of approximately 108,000 hotels and homestays across 1,500 Indian cities and access to around 2 million hotels globally, it stands as the largest domestic hotel platform in India.
Market Cap: ₹ 1,477 Cr.
Promoter holding: 64.5 %
FII holding: 2.82 %
DII holding: 19.1 %
Public holding: 13.6 %
Debt: ₹ 78.4 Cr.
Debt 3Years back: ₹ 62.8 Cr.
Looks good to buy on every deep, once breakout come it will give good movement.
Enrin - Breakout.Incorporated in 2024, Siemens Energy India Ltd is a leading energy technology Provider, delivering integrated solutions across power generation and transmission systems.
Company's fundamentals are good and current valuation is also good.
It has a breakout with good volume and poll and flag pattern.

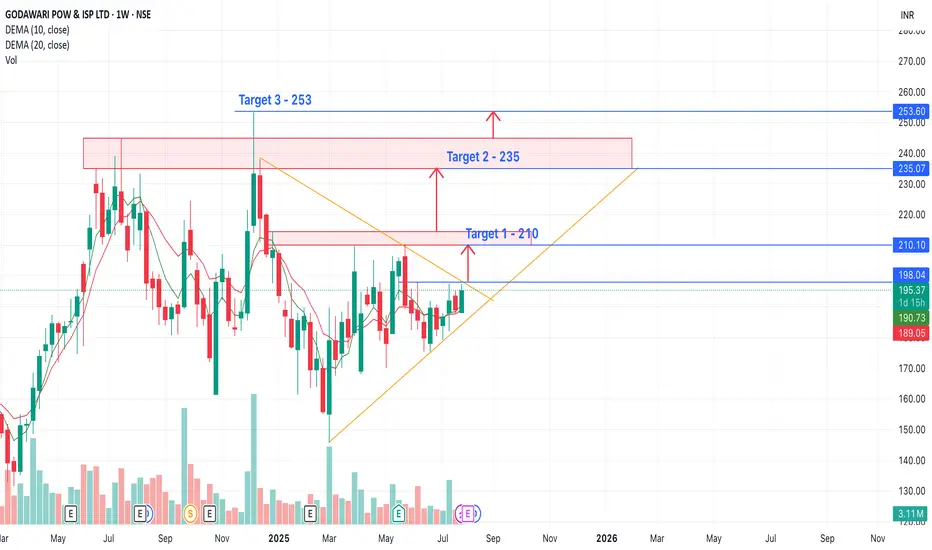
GPIL - Near BreakoutGodawari Power & Ispat is mainly engaged in the business of Mining of Iron Ore and Manufacturing of Iron Ore Pellets, Sponge Iron, Steel Billets, Wire Rods, H.B. Wire and Ferro Alloys with generation of Electricity.
Market Cap: ₹ 13,084 Cr.
Promoter holding: 63.5 %
FII holding: 6.51 %
DII holding: 2.67 %
Public holding: 27.3 %
Debt: ₹ 309 Cr.
Debt 3Years back: ₹ 428 Cr.
Stock near resistance, Above 198 look breakout and good to buy and hold.
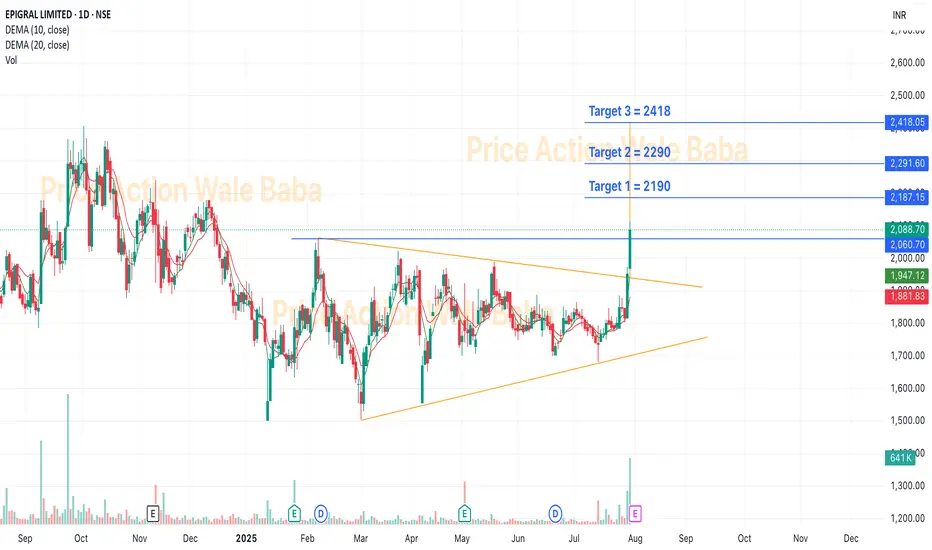
EPIGRAL - BreakoutEpigral Limited, formerly known as Meghmani Finechem Ltd, incorporated in 2007, is a leading integrated manufacturer of chemicals in India. Epigral’s Dahej facility is a backward and forward integrated and automated complex with a well-planned infrastructure.
In India, Epigral is the first to set up an Epichlorohydrin plant and largest capacity plant of CPVC Resin. Epigral is also a leading manufacturer of Caustic Soda, Caustic Potash, Chloromethanes, Hydrogen Peroxide, Chlorine and Hydrogen.
Breakout from the Triangle pattern
Market Cap: ₹ 8,996 Cr.
Promoter holding: 68.8 %
FII holding: 3.06 %
DII holding: 4.78 %
Public holding: 23.3 %
Debt: ₹ 593 Cr.
Debt 3Years back: ₹ 993 Cr.
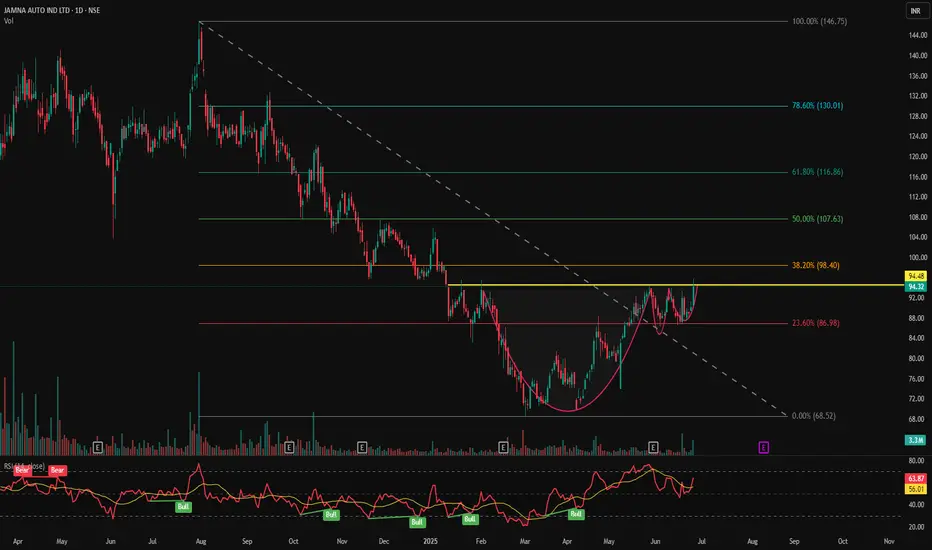
JAMNAAUTO - VCP Pattern Near Breakout📊 JAMNA AUTO (JAMNAAUTO) – VCP Pattern Near Breakout | RSI Momentum | Volume Surge | Daily Chart
📅 Chart Date: June 26, 2025
📈 CMP: ₹94.32 (+4.60%)
📍 Ticker: NSE:JAMNAAUTO
🔍 Technical Analysis Summary
☕ Cup & Handle Formation
The chart shows a well-formed Cup & Handle pattern
Neckline resistance at ₹94.48 – a break above this zone could trigger bullish continuation
Pattern suggests accumulation and breakout setup after prolonged downtrend reversal
📈 Volume
Rising volume on recent candles, supporting strength of potential breakout
Volume above 3.3M confirms strong buying interest
📊 RSI Indicator (14)
RSI currently at 63.87 and rising
Multiple historical RSI Bullish crossovers visible during base and handle formation
RSI > 60 indicates momentum is favoring bulls
📍 Key Price Levels
✅ Breakout Zone (Neckline): ₹94.48
🚀 Upside Targets (Post-breakout estimate):
₹102
₹110
₹120+
🛡️ Support Zones:
₹90 (immediate)
₹85 (handle base)
₹80 (cup base)
📌 Trade Setup Idea
Entry: On breakout above ₹94.50 with volume
SL: Below ₹89
Targets: ₹102 → ₹110 → ₹120+
Risk-Reward: Good, considering rounded base and handle plus RSI confirmation
⚠️ Disclaimer
This chart analysis is for educational purposes only. Always DYOR (Do Your Own Research) and consult a financial advisor before making investment decisions.
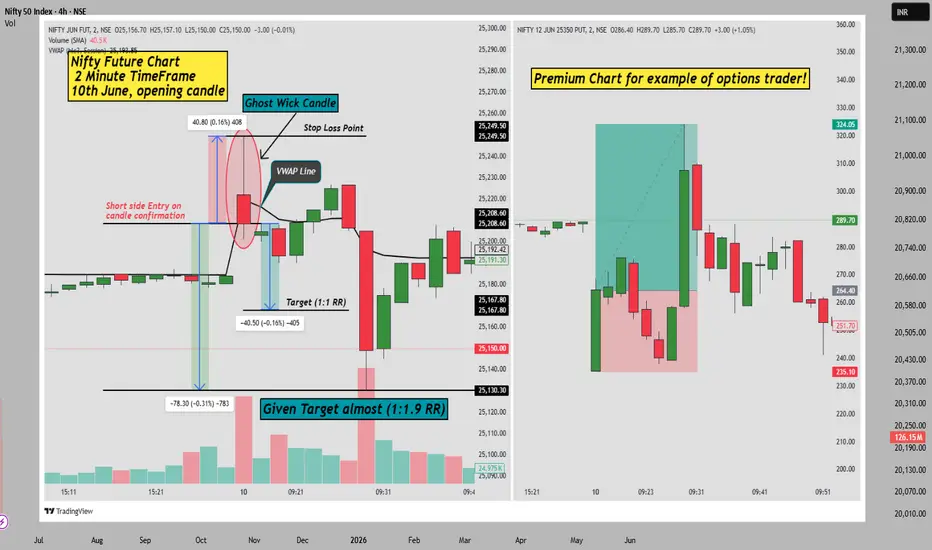
“Ghost Wick” Rejection Setup – Invisible Candle Setup from LTF!Hello Traders!
Today, let’s explore a powerful intraday price action concept that most traders completely miss — the “Ghost Wick” Rejection Setup . These are subtle but strong rejections that only show up on 1-min or 2-min charts , often disappearing or getting absorbed on 5-min or higher timeframes. If you’ve ever felt like your breakout failed but others caught it — this is what they saw!
What is the Ghost Wick Rejection Setup?
Appears Only on Lower Timeframes: You’ll notice sharp rejections with long wicks on 1-min or 2-min charts — but those wicks vanish on higher timeframes.
Happens at Key Levels: These setups often occur around VWAP, supply/demand zones, or previous highs/lows.
Used by Scalpers & Smart Money: Institutions and pro scalpers use these short-term traps to grab liquidity and reverse quickly.
How to Trade the Ghost Wick Setup
Watch Key Zones on 1–2 Min Chart: Look for long rejection wicks forming right at structure (VWAP, previous day’s high, etc.).
Wait for Confirmation Candle: Once the wick forms, wait for a strong opposite candle with higher volume or engulfing structure.
Enter with Tight SL: Enter at close of the confirmation candle. Place SL just above the wick (for shorts) or below (for longs).
Target Logical Zones: Go for quick 1:2 or 1:3 scalps — next support/resistance or VWAP reversion.
Real Example from Nifty Future Chart – 2 Min Timeframe (10th June Opening Candle)
In the chart above, you’ll see how a sharp rejection candle formed exactly at the VWAP line , followed by a breakdown. The “ghost wick” rejection triggered a precise short trade with a clean move downwards. The setup achieved nearly 1:1.9 RR , showing how accurate this rejection can be when spotted early.
Options Premium Chart on right side (Nifty 25350 PE)
To show how it impacts option Traders or scalpers — the 25350 PE premium spiked right after this rejection, hitting an exact 1:2 Risk-Reward target . It’s a perfect demonstration of how this setup works even for options traders, especially those trading momentum scalps.
Why This Setup Works
Retail Traders Miss It: Most people trade 5-min or 15-min charts and never see this trap setting up.
Algos Trigger Liquidity: These rejections are engineered to trap early breakout traders and reverse with force.
Scalping Precision: This setup allows tight stop losses with high R:R in just a few candles.
Rahul’s Tip
Use this only in high-volume environments — like market open or near key news events. Also, confirm with levels marked from higher timeframe. Don’t scalp in the middle of nowhere!
Conclusion
The “Ghost Wick” Rejection Setup is an advanced scalping trick that can massively improve your accuracy. It’s invisible to most — unless you’re watching closely on LTFs. Once you master it, you’ll never see price action the same way again.
Have you noticed ghost wicks before? Drop a 🕯️ in the comments if you’ve traded one!
If you found this post valuable, don't forget to LIKE and FOLLOW!
I regularly share real-world trading setups, actionable strategies, and learning-focused content — all from real trading experience , not theory. Stay connected if you're serious about growing as a trader!
ETH Technicals Hint at Breakout — All Eyes on the 2588 Level📊 Cycle Structure:
HWC (Higher Wave Cycle): Bullish 🔼
MWC (Middle Wave Cycle): Ranging 🔁
LWC (Lower Wave Cycle): Bullish 🔼
The overall market structure leans bullish. With both HWC and LWC pointing upward, the directional pressure favors long setups.
❗️If you're looking for a short position, this analysis isn't for you.
🔍 Price Action Structure & Entry Scenario:
A strong resistance zone at 2588 has already been tested four times.
A fifth touch often increases the probability of a breakout — especially in a bullish-biased environment.
A 1H ascending trendline sits right below the resistance, acting as dynamic support.
📌 My Strategy: Pre-Breakout Entry
My approach focuses on entering before a confirmed breakout — riding the early wave toward resistance.
This includes watching for compression, weak selling volume, and bullish candlestick structures.
⚠️ This method is inherently riskier, and the chance of getting stopped out is higher, so solid risk management is essential.
👥 Based on trading style, here’s how different traders might approach this:
🔁 Reactive traders can wait to see how price reacts at the trendline.
🔓 Breakout traders should wait for a confirmed 15min or 1H close above 2588.
🐳 Those expecting a sharp whale-driven move may consider placing a Buy Stop Order above resistance.
🎯 Entry Levels & Risk Management:
Aggressive Entry: Pre-breakout trigger near 2588 (riskier).
Conservative Entry: Wait for a confirmed breakout candle above 2588.
Stop-loss idea: Below the 1H trendline, acting as a dynamic support.
📉 Invalidation Level:
My bullish outlook holds as long as we’re above 2387.
If price closes below that, I’ll re-evaluate for a possible short — but until then, the focus remains on the long side.
💬 Want me to analyze a specific coin?
Drop it in the comments — I’ll review and pick one for the next post.
⚠️ Without proper risk management, you're just a ticking time bomb.
— PXA 📊

Asian Session High-Low+India Market Opening Reaction–Must Know!
Hello Traders!
Most traders focus only on the Indian market’s open without realizing the hidden power of the Asian session highs and lows . The reaction around these levels during our market opening can provide a fantastic intraday setup! Today, I’ll show you how to use Asian session levels combined with Indian market open to catch clean trades .
Why Asian High-Low Levels Matter
Pre-Defined Support/Resistance:
Asian session high and low create important reference points even before India opens.
Liquidity Pools:
Big players often place orders around these zones — making them natural traps or breakout points.
Clear Bias for the Day:
Price reaction at these levels can hint whether the day will trend or stay sideways.
The Setup – Step-by-Step Guide
Step 1 – Mark Asian Session High & Low
→ Asian session = from 5:00 AM to 9:15 AM IST
→ Plot horizontal lines at the highest and lowest points.
Step 2 – Observe Price Behavior Near These Levels After India Opens
→ Rejection = Reverse (trade against breakout)
→ Break + Retest = Trend Continuation
Step 3 – Entry, Stop Loss & Target
→ Entry: After confirmation candle (like engulfing, pin bar) at Asian High-Low
→ SL: Few points beyond the high/low
→ Target: 1:2 or next major support/resistance zone
When to Avoid This Setup
Major Gap Up or Gap Down Days:
If the market opens far away from Asian levels, ignore.
High Volatility News Days:
Big news flow (RBI policy, US inflation data) can invalidate early session reactions.
Rahul’s Tip
“First 15-30 minutes after open are critical.” Patience is key — let the market show you if Asian High/Low will hold or break!
Conclusion
By combining Asian session highs and lows with opening reactions , you can trade with a plan instead of guessing. This setup works beautifully for Nifty, BankNifty, and major stocks with decent liquidity.
Have you ever tried tracking Asian session levels? Let’s discuss in the comments below!
If you found this post valuable, don't forget to LIKE and FOLLOW !
I regularly share real-world trading setups, actionable strategies, and learning-focused content — all from real trading experience, not theory. Stay connected if you're serious about growing as a trader!

BlackBuck - Zinka LogisticsIncorporated in 2015, Zinka Logistics Solutions Ltd provides a digital trucking platform for payments, telematics, loads marketplace, and vehicle financing services.
Looks good above 460 on the breakout.
Above ATH, we can see the sharp upside rally.
Good to hold and accumulate for the next 6-12 months for big target.

Hindpetro - BreakoutHindpetro has given a breakout and ready to move up.
Good to buy and hold for the target level.
After big consolidation in the broadening wedge pattern, it's ready to give big movement.

My Favorite Reversal Candle Pattern (Works Like Magic!)Hello Traders!
What if I told you that one single candlestick pattern could give you an 80% win rate — when traded with the right context and strategy? That’s right! Today, we’re talking about the powerful Engulfing Candlestick Pattern — backed by data, tested across timeframes, and loved by price action traders.
Let’s break it down properly so you can spot it, trade it, and win with it.
The Candle Setup: Bullish & Bearish Engulfing Patterns
Bullish Engulfing Pattern:
This forms at the end of a downtrend or pullback . A strong green candle completely engulfs the previous red candle’s body, signaling a shift from sellers to buyers.
This setup is most effective at key support zones, trendline bounces, or bullish reversals with volume confirmation .
Bearish Engulfing Pattern:
Seen after an uptrend or rally . A solid red candle engulfs the previous green candle’s body, showing a shift from buyers to sellers.
Best used near resistance levels, psychological zones, or after a parabolic price move .
Check the chart above to understand better!
Note: I’ve used real chart examples from the past to demonstrate Bullish & Bearish Engulfing patterns exactly as they appear in price action textbooks — so you can recognize them with clarity and confidence.
How to Trade the Engulfing Candle Effectively
Entry:
Enter above the bullish engulfing candle’s high (long) or below the bearish engulfing candle’s low (short) after the candle closes.
Stop Loss:
Place SL just below the bullish engulfing candle's low or above the bearish candle’s high.
Target:
Use a 1:2 or 1:3 risk-reward ratio, or set targets based on nearby support/resistance or Fibonacci levels.
When to Use:
Only trade engulfing patterns when they form at a confluence zone — such as support/resistance, trendlines, moving averages, or breakout retests .
Backtesting Insights
When tested across Nifty 50, Bank Nifty, and large-cap stocks on the 15 min, 1H, and Daily charts , the Engulfing pattern — when combined with structure — showed up to 80% success rate with proper risk management and discipline.
Rahul’s Tip
Don’t blindly trade the pattern—trade the location! Context is everything. Always confirm with structure and volume. Engulfing candles are powerful, but only when they appear where it actually matters.
Conclusion
The Engulfing Candle is one of the most reliable patterns if traded with patience and planning. Combine it with key zones and risk control , and it can become a high-probability weapon in your trading arsenal.
Have you used this pattern before? Share your success (or lessons) in the comments — let’s grow together!

SBICARD: Monthly Pennant Breakout - How High Can It Fly?NSE:SBICARD
The stock has given a pennant pattern breakout on monthly chart with good volume along with second month on consecutive buying
This month's closing would be interesting to watch as it'd confirm the follow on move
916.95 / 946 / 1149 will act as strong resistance levels especially 1149 which is around it's ATH level a monthly close above it will fuel the further rally.
Since it's ATH in September 2021 stock has been in a downtrend but seems like things are about to change for good
SBI Cards & Payment Services is India's second-largest credit card issuer and a subsidiary of SBI.
Market Position :
SBI Cards is a leader in the credit card industry, holding an 18.5% market share in card-in-force and a 15.7% share in spending. You'll find them actively expanding into Tier-2 and Tier-3 cities to tap into new markets. Plus, partnerships with brands like Apple and Singapore Airlines help them attract premium customers.
Recent Financials (Q3 FY25):
Revenue: ₹4,767 crore (up 1% YoY).
Net Profit: ₹383 crore (down 30% YoY).
Net Interest Income (NII): ₹3,790 crore (down 3.5% YoY).
Asset Quality: Gross NPA at 3.24%, Net NPA at 1.18%.
9-Month Performance (9MFY25):
Revenue: ₹14,300 crore (up ~2% YoY).
Net Profit: ₹1,200 crore (down ~25% YoY).
Where is SBI Cards Headed?
Management is optimistic, projecting annual revenue growth of 10%-15% over the next two years. The plan involves:
Tapping into smaller cities to bring in new customers.
Boosting the digital experience for seamless customer interactions.
Launching exciting co-branded cards aimed at high-value users.
And don't forget, potential RBI rate cuts in FY26 could lower borrowing costs and boost the bottom line.

JIOFIN 1D TFNSE:JIOFIN , In the previous post discussed the stock broke a demand zone with strong bearish candle, but is now forming a stong bullish candle.This could be possible liquidity grab. This is a risky entry but could be traded for a 1:1.5 R:R.
We have discussed this more on our previous post. You can view the previous post by clicking the attachment below this post.
Disclaimer:- This analysis is only for educational purpose. Please always do your own analysis or consult with your financial advisor before taking any kind of trades

NTPC 1D TFNSE:NTPC has broken a trend line which I have posted in previous post. The stock could be have been traded in two ways.
Trade 1:
Entering the market as soon as the stock broke the trend line.
The stock has reached 1:1.5 and is running in profit.
Trade 2:
Waiting for another bearish candle or a retracement. The stock formed another bearish candle and If I have traded below that the stock is running in profit and I am waiting for the market to achieve a 1.5 reward.
We have discussed this more on our previous post. You can view the previous post by clicking the attachment below this post.
Disclaimer:- This analysis is only for educational purpose. Please always do your own analysis or consult with your financial advisor before taking any kind of trades

JIOFIN 1D TFAs we discussed in the previous posts NSE:JIOFIN has broken down a strong demand zone. A trade can be taken here with good profits.
We have discussed this more on our previous post. You can view the previous post by clicking the attachment below this post.
Disclaimer:- This analysis is only for educational purpose. Please always do your own analysis or consult with your financial advisor before taking any kind of trades

GAIL 1D TFNSE:GAIL has retraced from a demand zone and has gained liquidity and is coming down again. We could take entry with a R;R of 1:1.5. And the possibility of this trade winning is more as there are many confirmations associated with this one.
Disclaimer:- This analysis is only for educational purpose. Please always do your own analysis or consult with your financial advisor before taking any kind of trades

TATASTEEL 1D TFAs discussed in the previous post NSE:TATASTEEL was moving around a trend line which it has broke down now. The stock could be traded with strong confirmations only.
We have discussed this more on our previous post. You can view the previous post by clicking the attachment below this post.
Disclaimer:- This analysis is only for educational purpose. Please always do your own analysis or consult with your financial advisor before taking any kind of trades

PFC 1D TFWe've spoke about NSE:PFC forming a triangular pattern in the previous post. Now the stock is moving up breaking the triangular pattern. But I would wait for a retracement or another strong bullish candle in order to enter this trade.
We have discussed this more on our previous post. You can view the previous post by clicking the attachment below this post.
Disclaimer:- This analysis is only for educational purpose. Please always do your own analysis or consult with your financial advisor before taking any kind of trades
