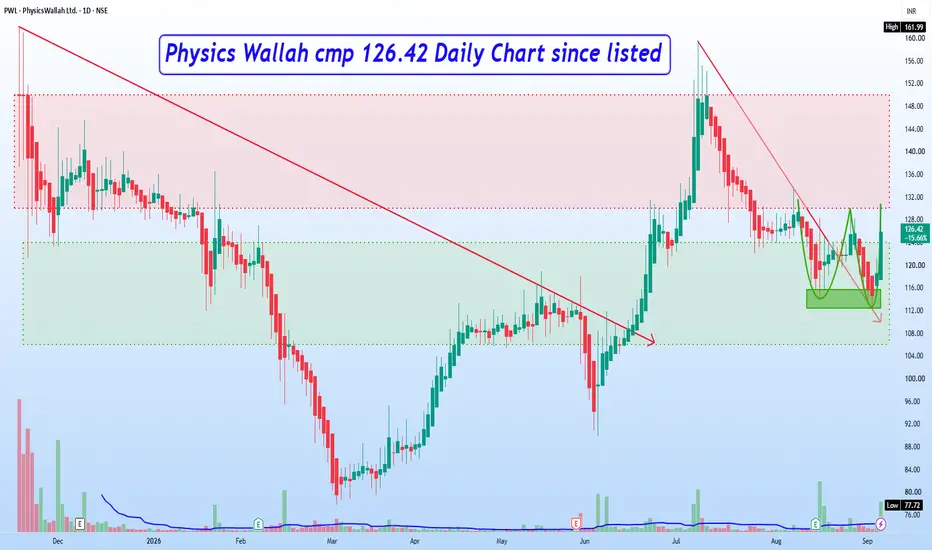
Physics Wallah cmp 126.42 Daily Chart since listedPhysics Wallah cmp 126.42 Daily Chart since listed
- Support Zone 106 to 124 Price Band
- Resistance Zone 130 to 150 »» ATH 161.99
- Falling Resistance Trendline Breakout acting Support
- Volumes spike on Friday, in good sync of avg trade qty
- Rounding Bottoms made by the Resistance Zone neckline
- Good Double Bottom made around 112 to 116 price band
- Breakout & Closure at 140+ level may provide fresh uptrend
Pwl
Price Acceptance & Volume Distribution Study (PWL | 1H)Intraday Market Structure & Volume Profile Study (1H)
This idea presents an intraday market structure study of
PhysicsWallah Ltd. on the 1-hour timeframe, using Volume Profile
to analyze price acceptance and participation.
A Fixed Range Volume Profile has been applied from the onset of the
impulsive decline to the most recent hourly price action, allowing
observation of how value has evolved over time.
Key Observations:
1) A clearly defined value area (VAH–VAL) is visible, indicating
whe