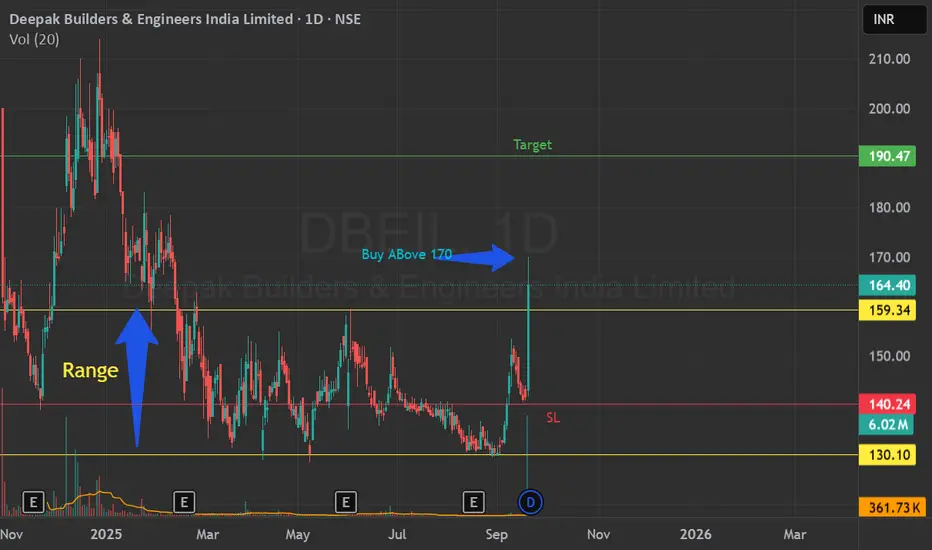
Range breakout with high volumePrice has consolidated for some days
came to top from low levels with high volume
Strong Earnings
follow with strict SL
Rangebreakout

360One WAM breakout pattern IIFL all companies are in trend, 360one in capital market section is also doing wonders. risk reward mentioned on the chart, strong breakout expected. pattern is very good

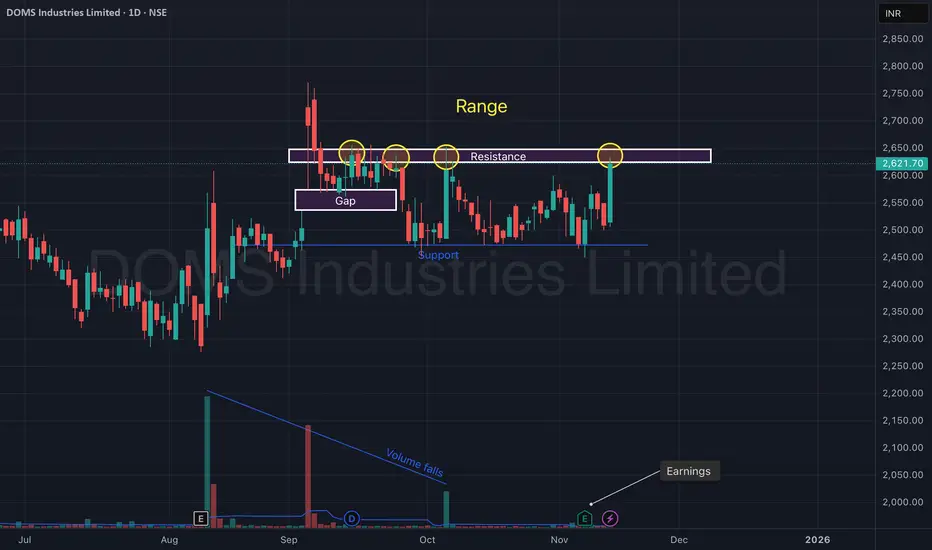
DOMS Industries Ltd – Range Breakout Attempt After Earnings.DOMS Industries continues to trade inside a well-defined range structure, with price repeatedly rejecting the ₹2,630–₹2,660 resistance zone. The recent strong bullish candle toward the upper boundary, combined with improving sentiment after earnings, signals a potential breakout attempt.
A clear gap zone retest around ₹2,520–₹2,550 provided a solid base. Support at ₹2,450 has held cleanly multiple times, validating the lower boundary of the range.
With volume slowly recovering from its multi-week decline and price pressing into resistance again, DOMS is approaching a decisive move.
🎯 Key Technical Levels
CMP: ₹2,621.70 (+4.49%)
Resistance Zone: ₹2,630 – ₹2,660 (Range high)
Gap Support: ₹2,520 – ₹2,550
Major Support: ₹2,450
Breakout Levels to Watch: Close above ₹2,660 with strong volume
📈 Technical View
Price is respecting a horizontal range for several weeks.
Repeated rejections highlighted by circles show strong supply near ₹2,650.
Gap zone acted as demand, helping price bounce back toward resistance.
Volume trend has been falling, suggesting participation has been subdued — a pickup in volume during any breakout would be critical.
Structure stays bullish above ₹2,520; bearish only if price closes below ₹2,450.
📊 Latest Earnings Snapshot
DOMS continues to deliver strong quarterly performance, supporting the technical setup:
Q2 FY26 (Sep 2025):
Net Profit: ~₹55.8 Cr
YoY Profit Growth: ~16%
Q1 FY26:
Revenue: ₹508.7 Cr (↑ ~26% YoY)
PAT: ~₹59.1 Cr (↑ ~8.8% YoY)
Consistent earnings growth strengthens the medium-term outlook and boosts confidence in a potential range breakout.
🧠 View
DOMS is back at its major resistance zone after a clean bounce from the gap support. A strong-volume breakout above ₹2,660 can trigger a momentum extension toward fresh highs, while ₹2,520 and ₹2,450 remain key demand zones to watch.
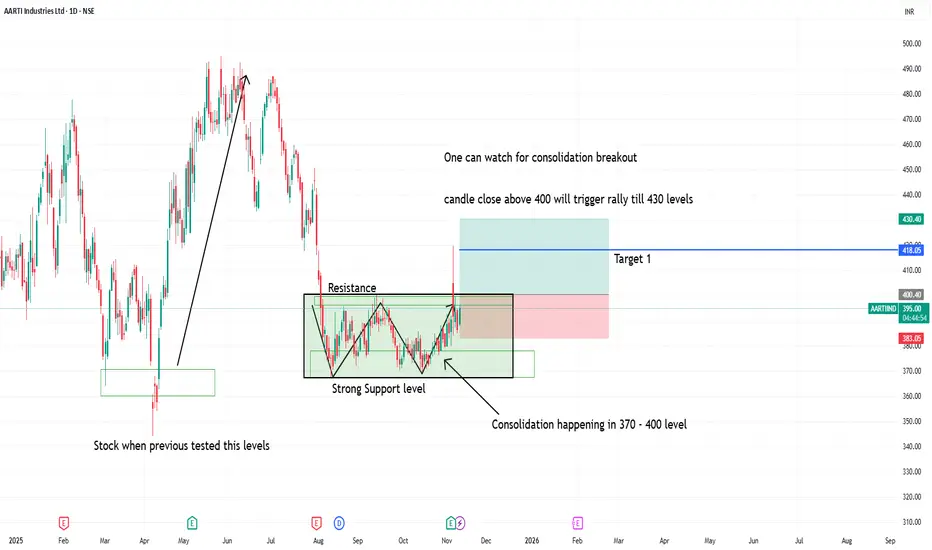
Watch for consolidation breakout in aarti industries1. Above 400 daily candle close will give strength to buyers to reach 430 level targets
2. Stock previously tested support levels gave big upside movement.
3. With good R:R one can watch for upside movement
4. normally the range of consolidation is target after breakout
if 30 points is consolidation range then target will 30 points after the consolidation breakout
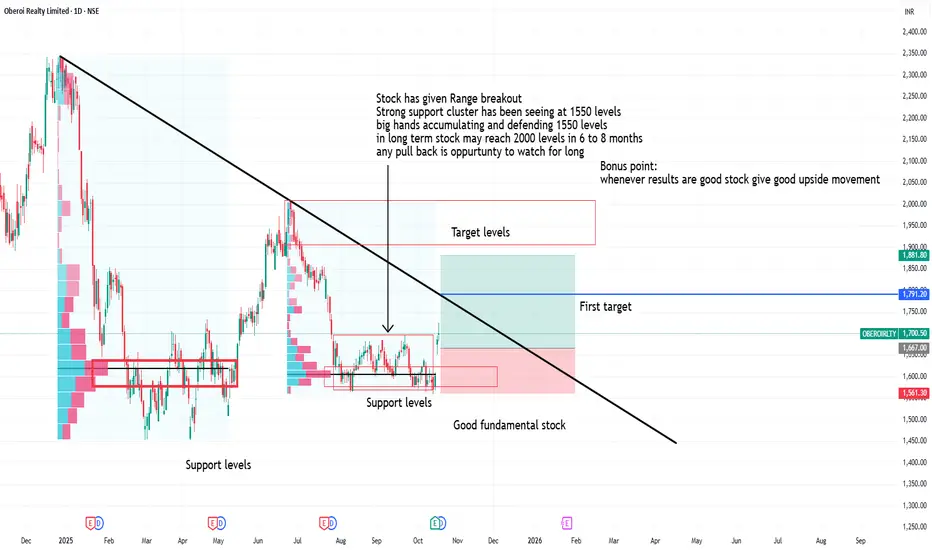
Oberoi reality range breakoutStock has given Range breakout
Strong support cluster has been seeing at 1550 levels
big hands accumulating and defending 1550 levels
in long term stock may reach 2000 levels in 6 to 8 months
any pull back is oppurtunty to watch for long
Range breakout, Partial entry as not a good Risk reward ratioRange breakout
Only partial entry now
Can average if price gets any retracement before reaching the target
The target was as equal as the range movement
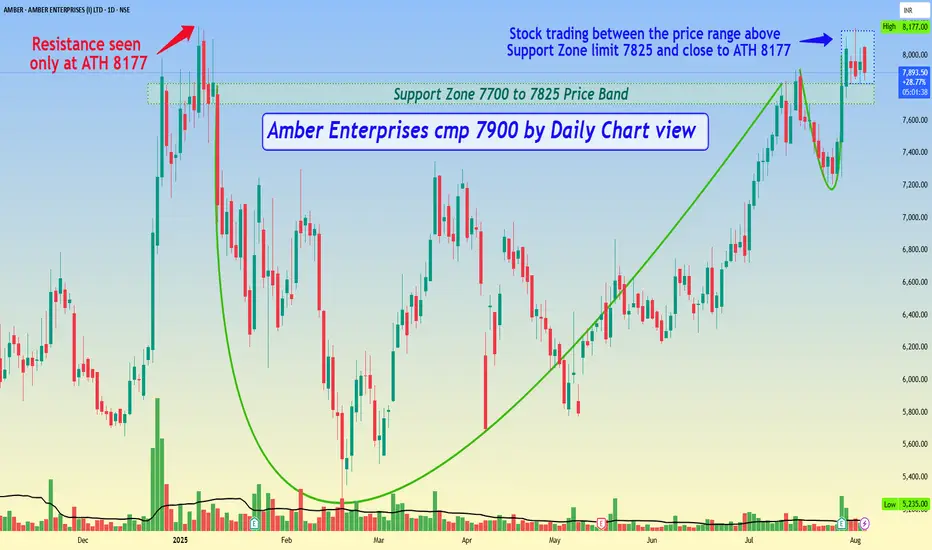
Amber Enterprises cmp 7900 by Daily Chart viewAmber Enterprises cmp 7900 by Daily Chart view
- Support Zone 7700 to 7825 Price Band
- Resistance seen only at the ATH 8177 level
- Volumes syncing closely and at times well above average traded quantity over past few days
- Stock is trading between the price range from above Support Zone limit 7825 and close to ATH 8177
- Bullish Rounding is made over close to 7 mths timeframe, indicative of huge upside breakout probability
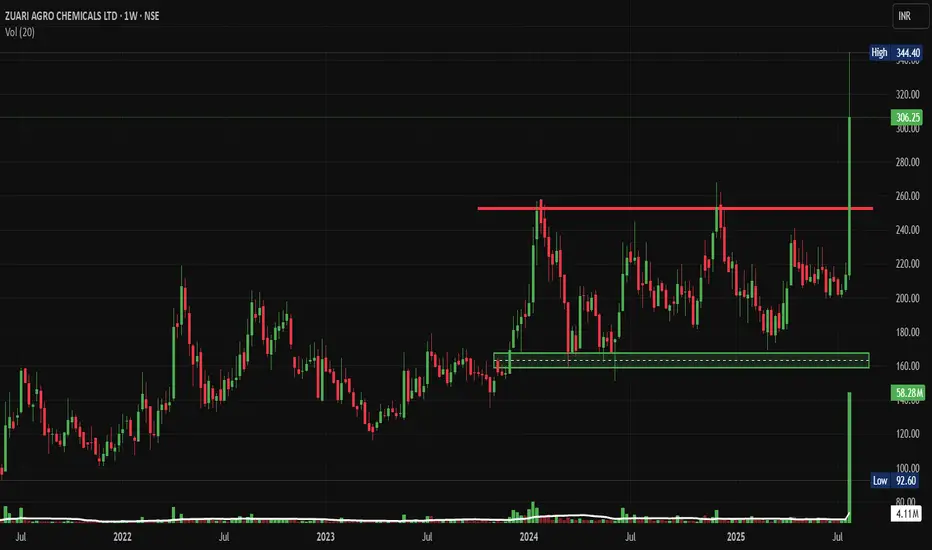
ZUARI: Stunning Breakout: A Deep Technical Analysis in the ChartNSE:ZUARI Stunning Breakout: A Deep Technical Analysis in the Chart of the Week
As per SEBI Mandate, this isn't a Trading/Investment RECOMMENDATION nor for Educational Purposes, it's just for Informational purposes
Disclaimer: "I am not a SEBI REGISTERED RESEARCH ANALYST AND INVESTMENT ADVISER."
This analysis is intended solely for informational purposes and should not be interpreted as financial advice. It is advisable to consult a qualified financial advisor or conduct thorough research before making investment decisions.
Price Action Analysis:
- The stock has shown a remarkable multi-year uptrend spanning from 2021 to 2025
- Price has rallied from lows around ₹90 in 2021 to current levels near ₹306, representing a gain of over 240%
- The stock is currently trading at ₹306.25 with recent highs touching ₹344.40
- Volume surge is evident in recent sessions with 58.28M shares traded, indicating strong institutional participation
Volume Analysis:
- Exceptional volume spike during breakout phases indicates institutional buying
- Volume-price correlation is positive during upward moves
- Recent volume of 58.28M vs average suggests strong momentum continuation
- Distribution patterns absent, indicating healthy accumulation
Chart Patterns and Structure:
Base Formation:
- A strong accumulation base was formed between 2021-2022 in the ₹90-180 range
- This 18-month consolidation phase created a solid foundation for the subsequent bull run
- The base shows characteristics of a cup-and-handle pattern with gradual accumulation
Support and Resistance Levels:
- Major Support Levels: ₹160-170 (dotted green rectangle area), ₹210-220
- Immediate Support: ₹280-290 range
- Key Resistance: ₹344.40 (recent high marked by red horizontal line)
- Next Resistance: ₹360-380 zone if breakout sustains
Technical Patterns:
- Multi-year ascending triangle formation with higher lows and consistent resistance around ₹250-260 levels
- Recent breakout above ₹260 resistance with strong volume confirmation
- Flag and pennant patterns visible during consolidation phases
- Currently in a potential flag formation after the recent surge
Fundamental and Sectoral Backdrop:
Company Overview:
- NSE:ZUARI is an India-based fertilizer manufacturing company engaged in the manufacturing, trading, and marketing of chemical fertilizers and fertilizer products
- The company manufactures and markets Single Super Phosphate (SSP) through its brand Jai Kisaan with a market cap of ₹1,288 Cr
- The company has delivered a poor sales growth of 8% over the past five years, with a low return on equity of 8% over the last 3 years
Sectoral Dynamics:
- India's FY 2025-26 budget allocates ₹1.84 trillion for fertilizer subsidies, with ₹1.19 trillion for urea and ₹0.49 trillion for P&K fertilizers
- The India Fertilizer Market size was valued at $40.5 billion in 2023 and is expected to reach INR 1,401.0 Billion by 2033, exhibiting a growth rate (CAGR) of 4-6.1%
- India's fertilizer sector in 2025 is a blend of strategic imports, domestic policy innovation, and scientific transformation with precision farming initiatives and sustainability experiments
Key Rationale:
- Government support through substantial subsidy allocation provides sector stability
- Growing agricultural focus and food security concerns drive long-term demand
- Technical breakout coincides with favourable sectoral tailwinds
- Undervaluation based on intrinsic value models suggests upside potential
- Strong historical returns demonstrate the company's ability to generate wealth
Risk Factors:
- Poor fundamental metrics with low sales growth and ROE
- High dependence on government policies and subsidy changes
- Commodity price volatility affecting margins
- Environmental regulations pushing toward organic alternatives
- Working capital-intensive business model
My Take:
NSE:ZUARI presents a compelling technical setup with a multi-year breakout backed by strong sector fundamentals. The stock's impressive 240%+ rally from base levels, combined with government support for the fertilizer sector, creates an attractive risk-reward proposition. However, one should be mindful of the company's weak operational metrics and maintain disciplined risk management. The current setup favours trend continuation with measured targets, making it suitable for both swing and positional traders with appropriate position sizing.
Full Coverage on my Newsletter this Week
Keep in the Watchlist and DOYR.
NO RECO. For Buy/Sell.
📌Thank you for exploring my idea! I hope you found it valuable.
🙏FOLLOW for more
👍BOOST if you found it useful.
✍️COMMENT below with your views.
Meanwhile, check out my other stock ideas on the right side until this trade is activated. I would love your feedback.
As per SEBI Mandate, this isn't a Trading/Investment RECOMMENDATION nor for Educational Purposes, it's just for Informational purposes
Disclaimer: "I am not a SEBI REGISTERED RESEARCH ANALYST AND INVESTMENT ADVISER."
This analysis is intended solely for informational purposes and should not be interpreted as financial advice. It is advisable to consult a qualified financial advisor or conduct thorough research before making investment decisions.
TRENT LONGEntry- 5080-5100
Target- 5200, 5300, 5350
SL- 4950
Reason- After a good fall Trent made a base by trading in a range and now it is breaking out of that range. (Range breakout Trade)
Disclaimer- This is just for educational purpose.
Jai Shree Ram.

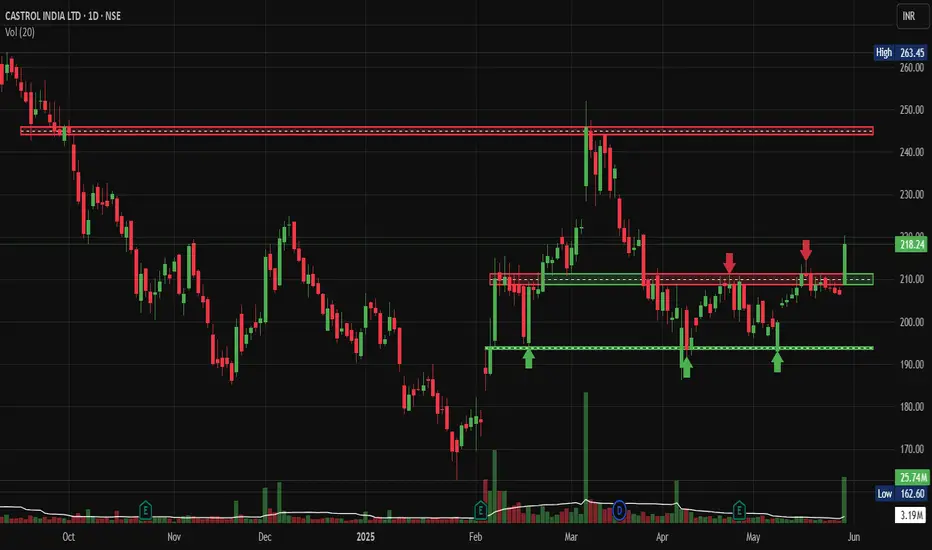
Castrol: Lubricant Oil Giant's Ends Consolidation PhaseNSE:CASTROLIND : Lubricant Oil Giant's Consolidation Phase Offers Strategic Entry Opportunity
Looking at NSE:CASTROLIND chart on the Daily Timeframe, the stock presents a compelling technical setup after months of consolidation following a significant decline from its October 2024 highs.
Price Action Analysis:
NSE:CASTROLIND has been trading in a well-defined range between ₹190-195 support and ₹210-215 resistance since February 2025. The stock peaked around ₹245-250 in October 2024 before experiencing a sharp correction that bottomed out near ₹162 in January. Since then, it has established a solid base above the ₹190 level with multiple successful retests.
The recent price action shows the stock consolidating around ₹208-210, with the current price at ₹208.70 representing a modest gain of 5.66%. This positioning near the upper end of the trading range suggests potential for a breakout attempt.
Volume Analysis:
Volume patterns reveal interesting insights - the chart shows several volume spikes that coincided with key support tests and bounce attempts. The volume of 25.74M against a 20-day average suggests active participation, though not at extreme levels. The volume profile indicates accumulation phases during dips below ₹200, which is constructive for future upward movement.
Key Support and Resistance Levels:
Key support levels are clearly defined at ₹190-195, , which have held multiple times since February. Secondary support exists around ₹180-185. On the upside, immediate resistance sits at ₹210-215 , followed by the more significant ₹230-235 zone . A break above ₹215 would target the previous consolidation high around ₹245.
Technical Pattern:
The stock is forming a classic rectangular consolidation pattern, also known as a trading range. This pattern typically resolves with a breakout in the direction of the prior trend, though given the extended decline from October highs, a base-building scenario appears more likely. The multiple retests of support without breaking down suggest a strong institutional interest at lower levels.
Trade Setup:
Entry Strategy: Consider accumulating on dips toward ₹195-200 or on a confirmed breakout above ₹215 with volume confirmation.
Entry Levels: ₹195-200 (value entry) or ₹216+ (momentum entry)
Target 1: ₹225-230
Target 2: ₹240-245
Target 3: ₹255-260
Stop Loss: Below ₹185 for medium-term positions
Risk-Reward: Approximately 1:2.5 from current levels
Sectoral and Fundamental Backdrop:
The lubricants sector has been facing headwinds from the transition to electric vehicles and longer oil change intervals in modern engines. However, Castrol benefits from its strong brand presence, extensive distribution network, and exposure to industrial lubricants. The company's parent, BP, provides technological advantages and global synergies.
Recent quarterly results have shown resilience despite volume pressures, with the company maintaining healthy margins through premiumization strategies. The automotive sector's recovery post-pandemic and increased industrial activity should support volume growth, though EV adoption remains a long-term concern.
India's infrastructure development and manufacturing push under various government initiatives provide tailwinds for industrial lubricant demand. Currency stability and crude oil price moderation also support margin profiles for lubricant companies.
The stock's valuation appears reasonable after the correction, trading below historical averages, which makes it attractive for patient investors willing to ride through the transition phase in the automotive industry.
Keep in the Watchlist.
NO RECO. For Buy/Sell.
📌Thank you for exploring my idea! I hope you found it valuable.
🙏FOLLOW for more
👍BOOST if you found it useful.
✍️COMMENT below with your views.
Meanwhile, check out my other stock ideas on the right side until this trade is activated. I would love your feedback.
Disclaimer: "I am not SEBI REGISTERED RESEARCH ANALYST AND INVESTMENT ADVISER."
This analysis is intended solely for informational and educational purposes and should not be interpreted as financial advice. It is advisable to consult a qualified financial advisor or conduct thorough research before making investment decisions.
Jayshree Tea: A Worthy Stock Pick!The chart of JAYSHREETEA provides delineates critical price thresholds that signify breakout points, along with specific support levels that serve as indicators of where buying interest may manifest.
Additionally, the chart highlights regions likely to act as ceiling points for future price ascensions, allowing for informed decisions on entry and exit strategies.
Disclaimer: The information contained in this technical analysis report is intended solely for informational and educational purposes. It should not be interpreted as financial advice or a recommendation to buy or sell any security. Investors are strongly encouraged to conduct their own research and consult with a qualified financial advisor before making any investment decisions.

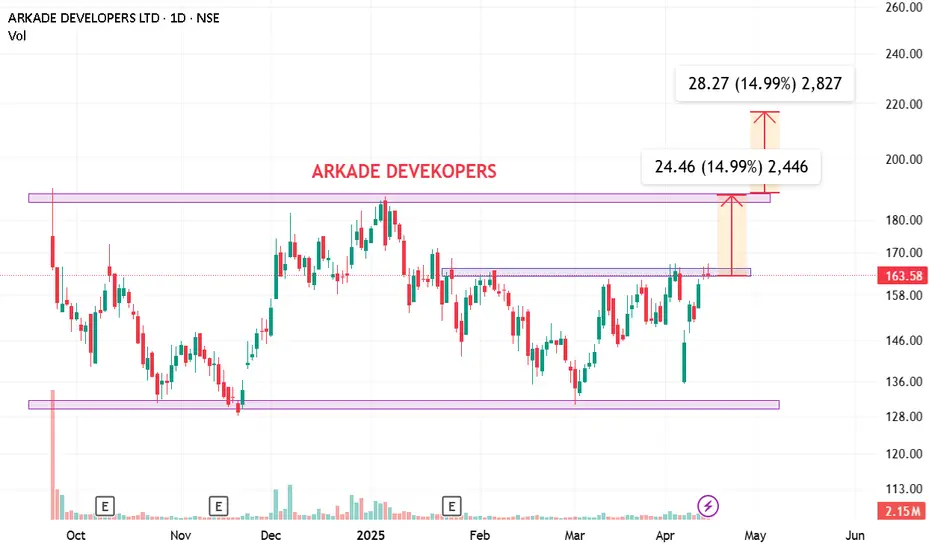
Arkade Developers IPO breakoutAfter ipo promoter promised in concall about 10000cr revenue till 2029 in next 5 years. so aprox considering 27% pat margin they will deliver 2700cr profit. which is current networth of company. very stong fundamental plus technical bet
in this market fall promoter bought very huge quantity of shares, which also shows that they bealive in their commitment and actions forward. track
EPL - Breakout Post Good Q4NSE:EPL Made Beautiful Chart Structure today after posting good Q4 Results with Good Price and Volume action.
Price Action Analysis:
Resistance Breakout:
1. Primary Resistance Break: The stock has successfully broken above the well-defined resistance zone at ₹203-205 (lower red rectangle), which had contained price movements since mid-April.
2. Approaching Major Resistance: With today's 4.57% gain, EPL is now testing a critical longer-term resistance level at ₹210-213 (upper red rectangle), which has capped prices since late February after a sharp decline from the ₹250+ level.
3. Base Formation: After hitting lows around ₹183 in early April, the stock has formed a constructive base pattern with higher lows, suggesting accumulation and buying support at progressively higher levels.
Volume Analysis:
Today's volume characteristics strongly support the bullish case:
- Volume of 3.34M shares is significantly above the 20-day average of 895.96K (nearly 4x normal volume)
- The volume spike coincides perfectly with the upside breakout
- Prior consolidation showed decreasing volume, typically a precursor to a volume-supported breakout
- The recent accumulation phase (late April to early May) displayed positive volume patterns
Key Support and Resistance Levels:
Key Resistance Levels:
1. Immediate Resistance: ₹210-213 (upper red rectangle - critical level being tested now)
2. Intermediate Resistance: ₹225 (reaction high from mid-February)
3. Major Resistance: ₹250-255 (February high)
Key Support Levels:
1. New Support: ₹203-205 (previous resistance now converted to support)
2. Secondary Support: ₹195-198 (consolidation range from late April)
3. Strong Support: ₹183-185 (April lows and beginning of current base)
Technical Patterns:
1. Double Bottom: The March and April lows near ₹183-190 formed a double bottom pattern, typically a reversal signal.
2. Range Breakout: Today's move represents a clear breakout from the April-May trading range.
Volume Confirmation:
The volume trend provides strong confirmation:
- Clear volume divergence during the April bottom (decreasing volume on downmoves)
- Increasing volume during recovery phases
- Today's substantial volume spike on breakout (3.34M shares)
- Volume well above average throughout May, suggesting institutional participation
My Outlook:
The combination of a multi-week base breakout with exceptionally strong volume support signals a potentially significant shift in momentum. The key technical question now is whether EPL can overcome the major resistance at ₹210-213.
If the stock can close convincingly above ₹213 in the coming sessions, it would complete a substantial bottoming pattern with potential upside targets at ₹225 initially and ₹240-250 longer-term. Conversely, failure at this resistance could lead to a retest of the breakout level at ₹203-205, which should now provide support.
Keep in the Watchlist and on your Radar.
NO RECO. For Buy/Sell.
📌Thank you for exploring my idea! I hope you found it valuable.
🙏FLLOW for more
👍BOOST if useful
✍️COMMENT below with your views.
Meanwhile, check out my other stock ideas on the right side until this trade is activated. I would love your feedback.
Disclaimer: "I am not SEBI REGISTERED RESEARCH ANALYST AND INVESTMENT ADVISER."
This analysis is intended solely for informational and educational purposes and should not be interpreted as financial advice. It is advisable to consult a qualified financial advisor or conduct thorough research before making investment decisions.

TTML Smashes Resistance After 3-Month Base MASSIVE 18% SURGE MASSIVE 18% SURGE in NSE:TTML Smashes Resistance After 3-Month Base - The Perfect Breakout Trade Blueprint! Also made a Beautiful Chart Structure of Kinda Triple Bottom Reversal Pattern today after Good Price and Volume action.
Price Action Analysis:
NSE:TTML is currently experiencing a significant bullish move, trading at ₹69.09 with an impressive 18.65% gain (₹10.86). The stock has made a decisive breakout from a well-defined range that had contained prices since March 2025. Today's powerful green candle has cleanly broken above the resistance zone at ₹62-64, showing strong momentum and conviction from buyers.
Volume Analysis:
The volume is exceptionally strong at 105.91M shares versus the average of 7.99M—over 13 times normal volume. This massive spike in participation confirms the legitimacy of the breakout and suggests institutional buying. High volume on breakouts is a classic confirmation signal that increases the probability of continued upward movement.
Support & Resistance Levels:
- Major Resistance (Now Broken): ₹62-64 zone (horizontal red box)
- Next Major Resistance: ₹74-76 area (upper horizontal red line)
- New Support: ₹62-64 (previous resistance now becomes support)
- Strong Base Support: ₹54-56 (multiple green arrows showing successful tests)
Technical Patterns:
1. Triple Bottom: Multiple tests of the ₹54-56 support zone (marked with green arrows) showing strong accumulation
2. Range Breakout: Clear break above the 3-month consolidation range between ₹54 and ₹64
Trade Setup:
- Entry Point: ₹68-70 on any minor pullback today or tomorrow
- Stop Loss: ₹61.50 (just below the broken resistance zone)
- First Target: ₹74-76 (previous resistance level)
- Second Target: ₹84-86 (previous swing high from December)
- Final Target: ₹95 (measured move projection from the range breakout)
Risk Management:
- Position sizing: Maximum 2% of trading capital at risk
- Risk-Reward Ratio: Approximately 1:1.5 based on the entry and the second target.
- Trailing stop: Once price moves above ₹76, move stop loss to breakeven, then trail below each higher low
Additional Insights:
The stock has formed a solid base over three months with multiple tests of support around ₹54-56, allowing for accumulation before this explosive move. The prior downtrend appears to have been arrested, with higher lows forming since March. The breakout comes with exceptional volume confirmation, suggesting this isn't a false move but potentially the beginning of a new uptrend.
The prior resistance at ₹74-76 (horizontal red line at the top) will be critical; clearing this level would confirm a complete trend reversal and potentially lead to a test of the December 2024 highs near ₹84-86.
Traders should be vigilant about potential pullbacks to the breakout zone (₹62-64), which would provide ideal secondary entry opportunities with tighter stop losses. The exceptional volume and percentage gain indicate strong momentum that could carry prices significantly higher in the coming weeks.
Keep in the Watchlist.
NO RECO. For Buy/Sell.
📌Thank you for exploring my idea! I hope you found it valuable.
🙏FOLLOW for more
👍BOOST if you found it useful.
✍️COMMENT below with your views.
Meanwhile, check out my other stock ideas on the right side until this trade is activated. I would love your feedback.
Disclaimer: "I am not a SEBI REGISTERED RESEARCH ANALYST AND INVESTMENT ADVISER."
This analysis is intended solely for informational and educational purposes and should not be interpreted as financial advice. It is advisable to consult a qualified financial advisor or conduct thorough research before making investment decisions.

BDL – Weekly W-Pattern + Sector Strength + Volume Surge 📈 BDL – Weekly W-Pattern + Sector Strength + Volume Surge = High-Potential Positional Setup
BDL is showing textbook technical confluence at the right time:
Sector: Defence index at all-time highs
Stock: BDL forming a clear double bottom (W-pattern) over several months
Weekly breakout underway with strong green candle and volume confirmation
Structure: Rounded base, higher lows, long support holding strong
Price just broke key levels with momentum — setup for multi-leg positional rally
🧠 Technical Highlights
✅ W-pattern (double bottom) over weekly chart confirms accumulation & reversal
✅ Price breakout from neckline zone around ₹1,525+
✅ Clean structure with support zone holding for 8+ months
✅ Volumes rising with the breakout — early signs of trend continuation
✅ Defence sector tailwind active
🧮 Setup Overview
Entry Zone ₹1,530–₹1,540
Stop Loss (SL) ₹1,293.95
ATH Resistance ₹1,799.45
Target (Positional) ₹2,363.55
SL % −15.38%
Target % +54.34%
Risk : Reward 1 : 3.5
📊 Strategy Recommendation
Add 30–40% position now
Add more on clean ATH breakout or base retest with volume
Avoid full position in one shot — shakeouts possible on weekly charts too
Let volume lead the move — don’t pre-empt full size
⚠️ Cautionary Note:
While the setup is structurally strong, remember:
Markets are still volatile
Sudden sector pullbacks or macro headlines may affect entries
Stick to position sizing and respect your stop loss
📌 Summary
BDL is setting up for a high-reward positional breakout fueled by a confirmed W-pattern, sector momentum, and volume surge. Structure is tight, risk is defined, and the upside potential is significant.
📉 Disclaimer:
This is not a buy/sell recommendation. For educational purposes only. Do your own research and manage risk as per your capital and style.

NACL Industries - Range Breakout Trade Setup🔥 NACL Industries - Range Breakout Trade Setup 🚀
📍 Breakout Level: ₹116
📍 Current Market Price (CMP): ₹121
📍 Stop Loss (SL): ₹96.5 (📉 Closing basis)
📍 Target 1 (T1): ₹166 🎯
📍 Target 2 (T2) (Positional): ₹255 🎯🎯
🔍 Why This Trade?
✅ Range Breakout 📈: Stock has broken out of a 3-year-old consolidation range!
✅ Big Money Inflow 💰: Breakout supported by high volume, indicating institutional buying.
✅ Bullish Pattern 📊: Formation of 3 White Soldiers on March 25 in DTF– a strong bullish signal! 🚀
✅ Sector Strength 🌱: Agrochemical sector is gaining momentum, boosting the stock.
✅ Price Action 🏆: Stock consolidated at all-time high levels before breaking out.
✅ Technical Strength 🛠️: Trading above key moving averages – momentum is on our side!
✅ No Overhead Resistance 🚧: No major hurdles ahead, potential smooth uptrend!
📊 Risk-Reward Calculation
🔹 Risk (SL at ₹96.5): ₹121 - ₹96.5 = ₹24.5
🔹 Reward 1 (T1 at ₹166): ₹166 - ₹121 = ₹45 🎯
🔹 Reward 2 (T2 at ₹255): ₹255 - ₹121 = ₹134 🎯🎯
🎯 Target 📏 Risk: Reward Ratio
T1 (₹166) 1:1.8
T2 (₹255) 1:5.4
📌 Trade Plan
👨💻 For Conservative Traders:
🔹 Entry: Small quantity at CMP (₹121) and add on successful retest of ₹116.
🔹 SL: ₹96.5 (Closing basis).
🔹 Target 1: ₹166 (Partial profit booking 📈).
🔹 Target 2: ₹255 (Hold for positional gain 🏆).
⚡ For Aggressive Traders:
🔹 Entry: Full deployment at CMP (₹121) if risk is well managed.
🔹 SL: ₹96.5 (Closing basis).
🔹 Exit Strategy: Trailing SL or partial booking at T1 (₹166), hold for T2 (₹255) 🚀.
⚠️ Key Risks to Consider
🔴 Fundamental Weakness: Poor ROCE (-0.04%) and ROE (-10.8%) → Purely technical trade!
🔴 Market Condition: 📉 Nifty still below 200 DMA, caution required!
🔴 Macroeconomic Factors: 🌍 Global uncertainties (e.g., Trump tariffs) may impact sentiment.
🚨 Final Note
📌 This is a high-risk, high-reward trade. Strict SL adherence is crucial! 🚨
💡 If you’re not comfortable with deep SLs, stay on the sidelines or enter lightly.
📈 Market remains uncertain—trade cautiously & manage risk wisely! 🛑
💬 What’s your take on this trade? Drop your thoughts below! ⬇️
🔹 Disclaimer: This is NOT financial advice. Do your own research before making any trade decisions. 📊

Rainbow : Consolidation Range Breakout#Rainbow #rangebreakout #Trendchange
RAINBOW : Consolidation Breakout
>> Range Breakout
>> Trend Change Visible
>> Low Risk High Reward Trade
>> Good Upside Potential
Swing Traders can lock profit at 10% and keep Trailing
Please Boost, comment and follow us for more Learnings.
Note : Markets are still Tricky and can go either ways so don't be over aggressive while choosing & planning your Trades, Calculate your Position sizing as per the Risk Reward you see and most importantly don't go all in
Disc : Charts shared are for learning purpose only, not a Trade recommendation. Do your own research and consult your financial advisor before taking any position.

#KSCL - VCP BO in DTF📊 Script: KSCL
Key highlights: 💡⚡
📈 VCP in DTF
📈 BO with Volume
📈 MACD gave a Bounce
📈 Price consolidated for 140Days
📈 One can go for Swing Trade
⚠️ Over All Market condition is bad, Practice paper trading
🟢 If you have any questions regarding the setup, please feel free to leave your inquiries in the comments, and I will respond promptly.
BUY ONLY ABOVE 1036 DCB
⏱️ C.M.P 📑💰- 1036
🟢 Target 🎯🏆 – 16%
⚠️ Stoploss ☠️🚫 - 8%
⚠️ Important: Always Exit the trade before any Event.
⚠️ Important: Always maintain your Risk & Reward Ratio.
✅#Boost, #Like & #Follow to never miss a new idea! ✅
Disclaimer: I am not SEBI Registered Advisor. My posts are purely for training and educational purposes.
Eat🍜 Sleep😴 TradingView📈 Repeat 🔁
Happy learning with MMT. Cheers!🥂

What will be the trading range of an instrument? Example Nifty 5Hi, Traders.
In order to know how much an instrument is likely to move in a trading session, if we find out the ranges in which it has generally moved, and in what range set it was seen more number of times, then it becomes easy to estimate its probable move.
As an example, over a period 2297 trading days, Nifty was mostly seen in the -1% to 1% ranges only. So when trading Nifty, go with a probability of -1 to 1 move.
How to draw the upper and lower levels?
Take yesterday's close and multiply with 1.01 for +1% upper range value.
Similarly yesterday's close * 0.99 will give lower range value.
You can then draw Fibonacci from the upper value to lower value or follow your set-up. Whiche er way you follow, this approach should help you set your expectations on any instrument.

#SRF - Potential STAGE 1 Break Out (Multi Year Consolidation)📊 Script: SRF
Key highlights: 💡⚡
📈 STAGE 1 - Accumulation formation in Weekly chart.
📈 Price gave a good up move, then went Side Ways
📈 Multi year Price consolidation
📈 Multiple Inside Bars formed in Daily chart
📈 Enter on BO when spike in Volume is seen
📈 MACD Cross Over
📈 One can go for Swing Trade.
BUY ONLY ABOVE 2700 DCB
⏱️ C.M.P 📑💰- 2583
🟢 Target 🎯🏆 – NA%
⚠️ Stoploss ☠️🚫 – NA%
⚠️ Important: Always Exit the trade before any Event.
⚠️ Important: Always maintain your Risk & Reward Ratio.
✅Boost, Like and follow to never miss a new idea! ✅
Disclaimer: I am not SEBI Registered Advisor. My posts are purely for training and educational purposes.
Eat🍜 Sleep😴 TradingView📈 Repeat 🔁
Happy learning with MMT. Cheers!🥂

Genesys Trying to breakout from ConsolidationStock: Genesys Intl Corp Ltd (GENESYS)
Entry: ₹1,055.35 (after a closing above this level for confirmation)
Stop Loss: ₹919.70 (on a closing basis)
Target: ₹1,230.85
Setup Overview:
Pattern: Trying to Breakout from a consolidation zone.
Volume: Moderate, confirming a breakout attempt, but needs more conviction.
Key Levels:
Entry after a confirmed close above ₹1,055.35 for safe traders.
Target: ₹1,230.85
Risk Considerations:
Trading against the broader trend; breakout setups in such cases have a higher failure probability.
Manage risk with appropriate position sizing.
Trade light to mitigate potential losses.

SRF LTD - Long Range Breakout ?Simple Chart - Long Consolidation ( Flag Pattern ). Targets could be higher as well but taking it one by one due to overall market volatility.
Fundamentally :
The company has declared Negative results for the last 7 consecutive quarters
PAT(9M) At Rs 724.72 cr has Grown at -20.67 %
INTEREST(9M) At Rs 286.57 cr has Grown at 21.09 %
ROCE(HY) Lowest at 10.25
However looking at the chart, something has changed fundamentally which is why there is demand coming in from big players.
Specialty Chemical Outlook:-
Anticipate good Agro Demand in Q4 with significant improvement over Q3
Fluorochem Outlook:-
Q4 to perform significantly better ; Supported by higher HFC Volumes.
Packaging Film Outlook:-
Demand -Supply imbalance to continue but will soften.

INDGN - 1 Month Consolidation / DowntrendIndegene Ltd
1) Time Frame - Daily.
2) The Stock has been in a Consolidation since (December, 2024) and in a downtrend since (November, 2024). Now, It has given a Consolidation/Downtrend breakout & Closed strong in Daily Time Frame.
3) The stock may find it's next set of resistance around the price (636 and 660) in short term.
4) Recommendation - Strong Buy.
