LINDEINDIA - Darvas Box Breakout - Swing TradeThe analysis is done on daily TF hence price may take few days to few weeks in order to reach the targets.
Trade setup is explained in image itself.
Linde India was analysed previously on 05th Jan as well. Checkout the linked idea to understand better
The above analysis is purely for educational purpose. Traders must do their own study & follow risk management before entering into any trade
Checkout my other ideas to understand how one can earn from stock markets with simple trade setups. Feel Free to comment below this or connect with me for any query or suggestion regarding this stock or Price Action Analysis.
Rangebreakout

Range Breakout in SRHHYPOLTD !!!!Typical range breakout in SREE RAYALASEEMA H with rising volume and MACD crossover could soon see levels
of 500-565.

VTL is ready for new highs !!!!Vardhman Textiles is taking support on its previous upper band, which shows strength in the falling market.
VTL is ready for new highs.

SEAMECeducational idea seamec we expect the stock May go for given target levels to inspire us,Please like the idea If you agree with the analysis

Balajitele - Range Bound - Range BreakoutNSE:BALAJITELE
BalajiTele
View : Bullish Shortterm - Medium Term - Long term
Structure : Range Bround
Range Breakout: Traders can enter in the direction of a breakout from a trading range.
To confirm the move is valid, Traders can use other indicators as per thier own wish.
Observation:
1. Range Breakout @ 75.00
2. Double / Multiple Bottom
3. Multiple support between 57 -58 indicates Balajitele can break the Upper range.
4. Range broken at 75.00 CMP 77.00 (7th February 12.40)
View:
Buy between 75 - 78
Stop Loss: 69.75 for long term
Target 83 - 89 - 92 - 96 - 95 - 100 + + + +

Accumulation with narrow rangeStock moving in narrow range.
Volumes have increase in last few sessions.
There is also pause in momentum.
(Check attached link for similar idea)
This shows we may see a good upside soon, breakout from narrow range.
Stock is holding at good supports, taking a breather after previous rally.
Check the location of narrow range
On monthly it has made new high.
support turned resistance.
Check image below
Keep a Stop loss at 107 on daily close basis.
MLong

PRAJ INDUSTRIESeducational idea-
Praj industry we expect the stock May go for given target levels to inspire us,Please like the idea If you agree with the analysis.

SRF - Range Breakout - Swing TradeThe analysis is done on daily TF hence price may take few days to few weeks in order to reach the targets.
Trade setup is explained in image itself.
The above analysis is purely for educational purpose. Traders must do their own study & follow risk management before entering into any trade
Checkout my other ideas to understand how one can earn from stock markets with simple trade setups. Feel Free to comment below this or connect with me for any query or suggestion regarding this stock or Price Action Analysis.

avanti feeds ltdshare name : Avanti feeds ltd
call type : positional
- After giving a good move 412-675 share is consolidating on retracement of .618
- share is consolidating in a range (525-591)
- 591 - acting as a huge resistance
- if a breakout comes, we can accumulate this
share above 591 for the target of 675 .770 with sl of 550
Thanks
ALong

GMM Pfaudler Ready for BreakoutGMM Pfaudler Ready for Breakout
Levels are explained in charts with Entry, Target & Stop Loss.
Disclaimer: This study is for educational purpose only & is not buying or selling recommendations. I am not SEBI registered. Please consult your financial advisor before taking any trade.

Greaves cotton Ready for multi year breakoutSimple consolidation of 7 years
Increased volume activity, after failed range break in March 2020
As stock is back in the range after failed breakdown & increased volume thereafter shows we might see a range break soon.
SL will be wide at 125-130 as monthly charts
Tip: Many times you will see stocks give breakout/breakdown then consolidate a bit forming tight range. them price will move with volumes in opposite side of the breakout/Breakdown

ASIAN PAINTeducational idea
Asian Paints has given the breakout and we expect the stock May go for given target levels . to inspire us,Please like the idea If you agree with the analysis.

hindustan oil explorationshare name : hindustan oil exploration
call type : poistional
-I am posting this chart on monthly time frame because of I have to show support and resistance of this share. How beautifully everything is working
- After forming a high of 400 in 2009 share is in a good downtrend
- From 2012 and 2020 share is forming a range means it is in a consolidation phase 30-150 for a trend change
- Share is also a forming pole and flag pattern to with a good retracement of 0.58 on fiboo
- we can see targets of 285 in upcoming days
- we can accumulate at this current level with sl of 145
- approachable targets 225,250, 285++
thanks

Newgen Range Breakout Works very Well.Newgen
Range Breakout Works very Well.
On Positive Breakout We can see Good Move Up to Resistance
after Resistance Breakout we can see more up move
Always Usestoploss

nbcc india ltdshare name : nbcc india ltd
call type : poistional
- share is forming a descending triangle
- a good consolidation can bee seen between 50
and 40
- 50.50 is acting as a good resistance, if 50.50 is
taken out we can see the targets of 60 and 69
- we can accumulate this share above 50.50
with sl of 46
thanks

MINDA CORP Bollinger Band Blast & BreakoutBollinger Band Blast in daily time frame with volume
RSI Above 60 - Bullish
MACD Crossover

CCL Products Indiashare name : CCL Products India
call type : Poistional - Swing Trade
- Share is consolidating in a good range from a
long time in between price of 421 and 360
- We can see a good breakout in this share
- we can accumulate this share above 421
- Approachable targets :
first target 490
second 575
third 625
Stop loss 355, Risk reward 1:3
Thanks

Range Breakout in HOMEFIRSTIf you look at chart at around 623-618 zone, we saw price rejection/resistance from this level. today in 1D timeframe the candle has given strong closing above the resistance zone with unusual volume which sounds good for this trade And same zone 623-618 will act as a support zone. Can make fresh position at CMP OR if you see any pullback/retest/backtest from these levels can also a good candidate to go long. it'll be better if we get this trade at around 650-640 level. would suggest to go long for the given targets of 713.50 & 794.50 with strict stop loss of 610 (only on candle closing below basis)
ENTRY :- CMP OR AROUND 640-650 RS
TARGET :- T1 713.50 & T2 794.50 (TARGET IS DETERMINED BY PREVIOUS SWINGS FROM THE RESISTANCE LEVELS)
STOPLOSS :- 610 (ONLY ON CANDLE CLOSING BELOW BASIS)
THIS VIEW OF MINE IS PURELY BASED ON TECHNIAL CHART AND FOR EDUCATIONAL PURPOSE ONLY, BEWARE OF NEWS AND OTHER FACTORS WHICH CAN AFFECT THE MARKET SENTIMENT OR ANY PARTICULAR STOCK/SECURITY.

ADANI GREEN ENERGY range breakoutHey Friends,
NSE:ADANIGREEN It was consolidating from 65 days. A nice swing can be initiated from these levels and tgt ATH.. It might form new all time high as nifty next 50 index is going great.
Thanks!

Bharat Bijle Price & Volume contracting.Stock has narrowing down candle by candle.
There is price as well as volume contraction.
This price movement precedes a big move.
Stock is consolidating since 2009. Stock is on the verge of multiyear breakout. Stock is being accumulated as evident by volumes. check image below
Simple wedge pattern on daily time frame
For attempting a breakout trade place SL at 1175

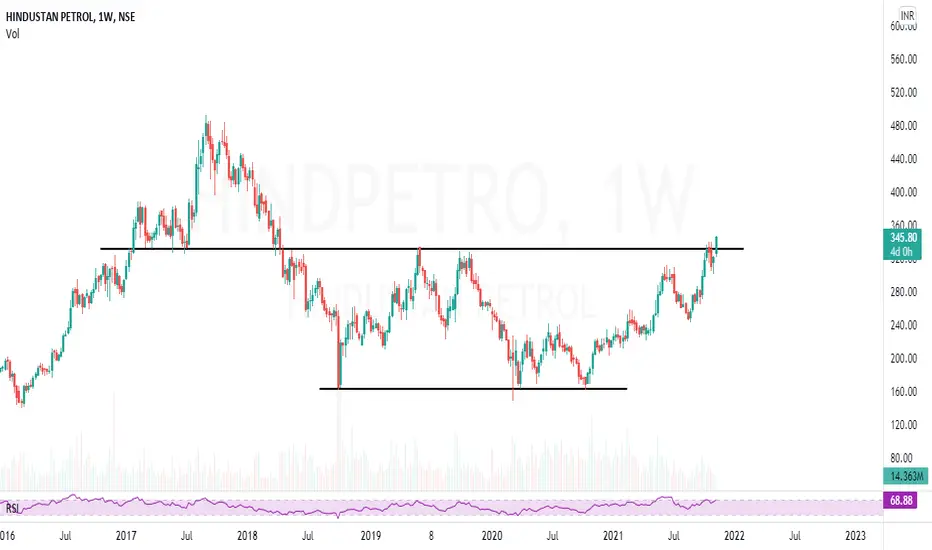
HINDPETRO | Getting ready for another 40-45% moveHINDPETRO | Getting ready for another 40-45% move
CMP : 345 (Dip : 330)
SL : 290
Target : 445, 490
Almost 1:4 risk reward setup for 1st target.
Take a look at our previous trades in HINDPETRO (Link attached in related idea's)
DEEPAK Fertilizer Range BreakouDeepakFERT breakout from a box pattern. swing traders can plan this trade with SL below the range.

JUSTDIAL narrow range breakout.JUSTDIAL is stuck in a very narrow range, between 983 and 945. Generally when price moves out of the range, on which ever side it does, it travels further in that direction for about the width of the range. One can go long or short keeping the following levels in mind:
LONG ABOVE: 983
STOP LOSS: 945
TARGET: 1021
SHORT BELOW: 945
STOP LOSS: 983
TARGET: 907
_______________________________________________________________________________________________________________________________________________________
Manage your risk and trade your plan. :)
