PAYTM KARO ONE97 COMMUNICATIONS NSE:PAYTM
Paytm karo varna stock ko niche karo 😅😅
Paytm take strong resistance from his major resistance and also do classical pattern consolidation after breaking down that is double confirmation for trend direction.
now, 1000 is major support
this is not a any types of advice.
this is just chart analysis
do your own research
Rectangle

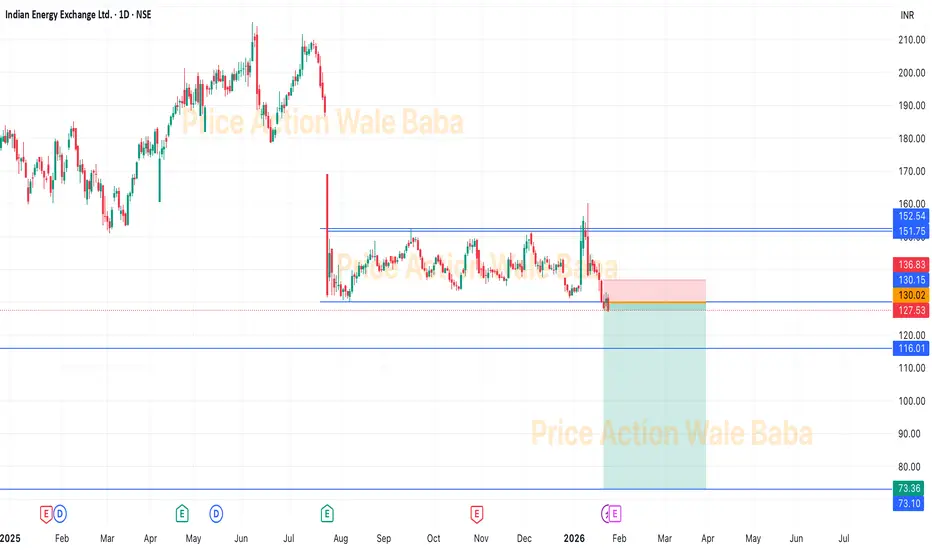
IEX - Box BreakoutIEX was consolidating in the box from the long time and now it's out of the box.
It is good to short IEX and hold for the target of 115-110
Although, you can keep in the hold for the target of 80-75 as we know government policy are comes against IEX's monopoly.
SobhaSobha has box breakout and it's ready to go more down.
Cmp is 1380 which is good to sell, below 1320 we can see 1200 and 1100 as target.
Keep sell on rise will give good return.
SL could be 1480.

Jindal Steel (W): Cautiously Bullish (Breakout Rejection)(Timeframe: Weekly | Scale: Logarithmic)
The stock attempted a major breakout from its 2-year consolidation but faced a classic "Shooting Star" / Rejection at the All-Time High. While the trend is up, the inability to close above ₹1,085 signals that the "Smart Money" is booking profits ahead of the Jan 30 earnings.
🚀 1. The Fundamental Catalyst (The "Why")
The price action is dominated by the upcoming event:
> Q3 Earnings (Jan 30): With results just a week away, investors are risk-averse. The stock needs a "Earnings Beat" to justify a price above ₹1,100.
> Sector Strength: The Nifty Metal Index is strong (up ~7% this month), which is why the stock is hugging the resistance rather than crashing.
📈 2. The Chart Structure (The Trap)
> The Box: ₹750 – ₹1,085 consolidation range. This "Time Correction" has been healthy.
> The Fakeout (This Week):
- The Move: The stock spiked to ₹1,104 (New High) but was hammered down to close below ₹1,085 .
- Interpretation: This leaves a long "Upper Wick" on the weekly candle, indicating that bears are still defending this fortress. A "Look Above and Fail" often leads to a short-term pullback.
📊 3. Volume & Indicators
> Volume: The "Above Average" volume on a rejection candle is a warning. It implies that while buyers tried to push up, sellers unloaded heavy quantities (Churning).
> RSI: Rising but showing a potential Negative Divergence on daily frames if price makes a high but RSI doesn't.
🎯 4. Future Scenarios & Key Levels
The trade is now an "Event Play."
🐂 Bullish Breakout (Post-Earnings):
- Trigger: A decisive Weekly Close above ₹1,105 (clearing the new wick).
- Target 1: ₹1,235.
- Target 2: ₹1,350.
🛡️ Support (The "Buy Zone"):
- Immediate Support: ₹980 – ₹1,000 .
- Strategy: If the stock dips to ₹980 before Jan 30, it is a low-risk entry.
- Stop Loss: A close below ₹950 invalidates the bullish structure.
Conclusion
This is a "Wait for Confirmation" Setup .
> Refinement: Do not buy the "intraday breakout." Wait for a Closing Basis breakout above ₹1,105.
> Action: Keep it on the watchlist. The real move will likely happen after Jan 30 results.

FedFina (D): Aggressive Bullish (Blue Sky Breakout)(Timeframe: Daily | Scale: Linear)
The stock has confirmed a major "Rectangle Breakout" from a 5-month consolidation base. By clearing ₹166.80, it has entered "Price Discovery" territory (New ATH), powered by pre-earnings institutional buying.
🚀 1. The Fundamental Catalyst (The "Why")
The breakout is timed perfectly with corporate events:
> Earnings Anticipation: The Q3 FY26 results are scheduled for Jan 16, 2026 . The massive volume suggests that "informed investors" expect robust AUM growth and stable asset quality.
> Sector Re-rating: Small/Mid-cap NBFCs are currently outperforming larger peers due to faster growth rates, attracting capital flows.
📈 2. The Chart Structure (The Base)
> The Pattern: Sideways trend (₹133 – ₹166). This 5-month pause allowed the stock to digest its gains from the Apr 2025 lows (₹80).
> The Breakout: Yesterday's close at ₹176.40 was decisive.
- Significance: A breakout to a new ATH usually signals the start of a new, durable trend rather than a quick pop.
📊 3. Volume & Indicators
> Volume Ignition: The 6.89 Million volume is an "Ignition Bar." It confirms that the breakout is real and not a "retail trap."
> Indicators:
- RSI: Rising into the "Overbought" zone (>70) is actually positive here. In strong momentum stocks (like NBFCs in a bull run), RSI can stay overbought for weeks.
- EMAs: The stock is trading well above all short-term averages, confirming the markup phase.
🎯 4. Future Scenarios & Key Levels
The stock is now in unchartered territory.
🐂 Bullish Target (Blue Sky):
- Target 1: ₹200 .
- Target 2: ₹215 .
🛡️ Support (The "Must Hold"):
- Immediate Support: ₹166 – ₹168 . The previous resistance ("The Ceiling") must now act as a rigid floor ("The Floor").
- Risk: Be careful of "Sell the News" volatility after the Q3 results are announced. If the stock falls back below ₹160 , the breakout could fail.
Conclusion
This is a Grade A Setup .
> Strategy: The breakout is valid. If you are holding, trail your stop loss. If looking to enter, wait for the Q3 results (Jan 16) to settle.

IIFL Capital (W): Aggressive Bullish (Re-rating Breakout)Timeframe: Weekly | Scale: Logarithmic
The stock has confirmed a major breakout from an 8-month consolidation pattern. This move is not just a technical fluctuation; it represents a structural "Re-rating" of the business following its pivot from pure broking to broader capital services.
🚀 1. The Fundamental Catalyst (The "Why")
The surge is driven by a convergence of business transformation and sector strength:
> Strategic Rebranding: The name change to "Capital Services" signals a shift towards high-margin Wealth Management and Distribution. The market is finally pricing in this higher valuation multiple, which explains the sudden volume spike.
> Sector Tailwind: The entire capital market ecosystem (BSE, CDSL, Angel One) has been rallying in Dec 2025/Jan 2026 due to renewed retail participation, providing a "Sectoral Lift" to the stock.
📈 2. The Chart Structure (The Box Breakout)
> The Setup: A Rectangular Pattern (Sideways Trend) that trapped the stock between May 2025 and last week.
> Resistance: The confluence of the Angular Resistance (from the Oct 2024 ATH) and the Horizontal Box Top was a formidable barrier.
> The Breakout: This week’s surge of 16.17% is a decisive "Marubozu-style" candle . It smashed through both resistance layers in a single move, confirming that the correction from Apr 2025 is officially over.
📊 3. Volume & Indicators
> Volume Ignition: The 9.61 Million weekly volume is an "Institutional Stamp." Such high volume after a quiet consolidation indicates that large funds are entering to ride the new leg up.
> Momentum:
- RSI: Rising in Monthly & Weekly timeframes confirms that momentum is synchronized with price.
- EMAs: The Positive Crossover confirms the trend has shifted from "Sideways" to "Markup."
🎯 4. Future Scenarios & Key Levels
The stock is now in a "Markup Phase" heading toward its previous peaks.
> 🐂 Bullish Targets (The Recovery):
- Target 1: 425. This is a major structural hurdle.
- Target 2: 449 (ATH) . Once 425 is cleared, the path to the All-Time High of 448.95 (Oct 2024) is technically open.
> 🛡️ Support (The "Must Hold"):
- Immediate Support: 352 . This is the breakout zone. The "Polarity Principle" dictates that this previous ceiling must now act as a floor.
- Stop Loss: A weekly close below 340 would imply the breakout was a "Bull Trap" and invalidation of the setup.
Conclusion
This is a Grade A Setup .
> Confirmation: The combination of High Volume + Pattern Breakout + Fundamental Rebranding makes this a high-probability trade.
> Strategy: Use dips to the 352-360 zone to enter/add, targeting 425 and eventually the ATH of 449 .

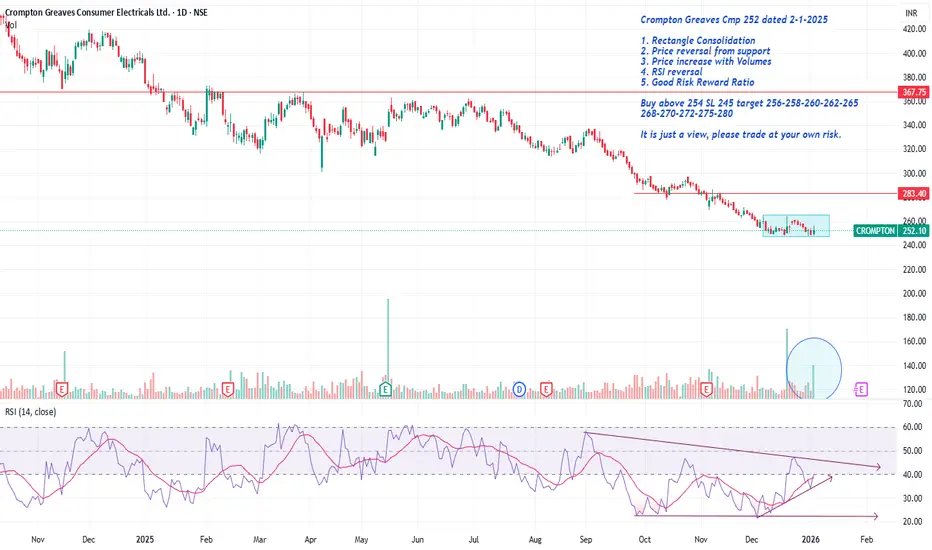
Crompton Greaves Cmp 252 Reversed from supportCrompton Greaves Cmp 252 dated 2-1-2025
1. Rectangle Consolidation
2. Price reversal from support
3. Price increase with Volumes
4. RSI reversal
5. Good Risk Reward Ratio
Buy above 254 SL 245 target 256-258-260-262-265
268-270-272-275-280
It is just a view, please trade at your own risk.
Senores pharma breakout possibleUS fda approved facility which prevents them from any risk of tariff, very good guidance and growth projections. breakout possible very soon

360One WAM breakout pattern IIFL all companies are in trend, 360one in capital market section is also doing wonders. risk reward mentioned on the chart, strong breakout expected. pattern is very good

Jindal Stainless (D): Strongly Bullish - Sector-Backed BreakoutTimeframe: Daily | Scale: Linear
The stock has confirmed a major "Blue Sky" breakout, clearing a confluence of resistance levels (Angular + Horizontal) to hit a new All-Time High. This move is powered by a sector-wide rally and strong institutional volume.
🚀 1. The Fundamental Catalyst (The "Why")
The breakout is fueled by a convergence of positive factors:
> Sector Rally: The Nifty Metal index is surging, lifting all ferrous metal stocks. When a stock breaks out with its sector, the probability of success increases significantly.
> Strong Earnings Support: The company’s Q2 FY26 results provided the fundamental floor, and the market is now pricing in future growth from its capacity expansion plans (targeting 4.2 MTPA).
📈 2. The Chart Structure (The "Coil" bursts)
> The Squeeze: The tight sideways trend below the angular resistance. This "Coiling" action (low volatility + drying volume) indicated that sellers were exhausted.
> The Breakout: Today's surge of 5.14% smashed through the ₹825–₹830 supply zone.
- Significance: By closing at a new ATH ( ₹848.05 ), the stock has no overhead supply (resistance) left. It is now in "Price Discovery" mode.
> Volume: The 2.77 Million volume is an "Ignition Bar." It confirms that "Smart Money" has initiated a new markup phase.
📊 3. Technical Indicators
> EMAs: The Positive Crossover (PCO) on Short-term EMAs confirms the immediate trend is vertical.
> RSI: Rising RSI across all timeframes (Monthly/Weekly/Daily) signals synchronized momentum. An RSI above 60 in a breakout is a sign of strength, not an overbought signal.
🎯 4. Future Scenarios & Key Levels
The stock is primed for a "Blue Sky" run.
> 🐂 Bullish Target (Blue Sky):
- Target 1: ₹960 .
- Strategy: Since the stock is at an ATH, use a Trailing Stop Loss (e.g., 20-day EMA) to ride the trend as far as it goes.
> 🛡️ Support (The "Must Hold"):
- Immediate Support: ₹790 – ₹800 . The previous resistance zone should now act as a rock-solid floor (Polarity Principle).
- Stop Loss: A close below ₹776 would act as a structural failure, invalidating the breakout.
Conclusion
This is a Grade A Setup .
> Refinement: The "Low Volume" during the sideways phase followed by "High Volume" on the breakout is the perfect recipe for a sustainable move.
> Action: The breakout is confirmed. The dip to ₹820-830 (if it happens) is a buying opportunity.

BANKNIFTYBANKNIFTY appears to be forming a descending triangle on the 1-hour chart. It will be interesting to see how price behaves in the next few days.

Asian Granito (D): Strongly Bullish - Turnaround BreakoutTimeframe: Daily | Scale: Linear
The stock has confirmed a major structural breakout from a multi-year base (₹34 – ₹75 range). This technical move is backed by a financial turnaround and "Ignition Volume," suggesting the start of a new uptrend.
🚀 1. The Fundamental Catalyst (The "Why")
The explosion in volume is driven by a clear shift in business fundamentals:
> Financial Turnaround: In the recent Q2 FY26 results, the company reported a Consolidated Net Profit of ₹16.72 Crore , a massive jump from just ₹1.2 Crore in the same quarter last year.
> Turnaround Validation: The market is re-rating the stock because it has moved from "survival mode" back to "growth mode," justifying higher valuations.
📈 2. The Chart Structure (The "Lid" is Blown)
> The Base: The ₹34 – ₹75 range has acted as a massive accumulation zone for nearly 3 years.
> The Breakout: The surge past ₹75 clears the "line in the sand."
- Significance: Breaking a 3-year accumulation zone often leads to extended trends, not just short pops.
> Volume: The 13 Million volume day is an "Institutional Stamp." Retail traders don't generate that kind of liquidity; big players are entering.
📊 3. Technical Indicators
> EMAs: The Positive Crossover on Short-term EMAs confirms the trend is accelerating.
> RSI: Rising in all timeframes. Note that RSI may stay "overbought" (>70) for a while during such strong breakouts; this is a sign of strength, not a sell signal.
🎯 4. Future Scenarios & Key Levels
The stock has entered "markup" mode.
> 🐂 Bullish Targets (The Follow-through):
- Target 1: ₹81 .
- Target 2: ₹90 .
> 🛡️ Support (The "Must Hold"):
- Immediate Support: ₹73 – ₹75 . The breakout level ("Polarity Principle").
- Stop Loss: A daily close below ₹68 would indicate the breakout was a "Bull Trap" and invalidate the setup.
Conclusion
This is a Grade A Turnaround Setup . The combination of a 3-year base breakout + Profit Jump + Massive Volume makes this high conviction.
> Strategy: Buying dips near ₹75 is the optimal entry. Watch for the stock to hold above this level to confirm the new leg up.

Manappuram Fin (W): Bullish - Coiling at ResistanceTimeframe: Weekly | Scale: Logarithmic
The stock is challenging the upper end of its 3-month consolidation zone. The setup is a classic "Volatility Contraction" right below the All-Time High, supported by recent institutional accumulation and sector-wide tailwinds.
🚀 1. The Fundamental Catalyst (The "Why")
The stock is pushing resistance due to two key drivers:
> Liquidity Boost (Dec 15): The company successfully raised ₹500 Crore via Non-Convertible Debentures (NCDs), ensuring strong capital adequacy for growth.
> Sector Spillover: The massive deal in peer Shriram Finance (MUFG stake buy) has triggered a re-rating of the entire NBFC sector, lifting sentiment for gold loan players like Manappuram.
📈 2. The Chart Structure (Rectangular Base)
> The Box: The ₹262 – ₹295 trading range.
- Significance: The stock has spent 3 months absorbing supply in this zone.
> The "Knock" at the Door: The stock closed the week at ₹292.65 , just ~1.8% away from the ATH of ₹298 .
- Price Action: Closures near the high of the week indicate that buyers are willing to hold positions over the weekend, a bullish sign.
📊 3. Volume & Indicators
> Volume Analysis (Correction): While the breakout volume hasn't happened yet, the internal volume shows accumulation. High-volume spikes on Dec 12 (21M) and Dec 16 (12M) suggest institutions bought the dip, while the pullback days had lower volume. This confirms a healthy accumulation pattern .
> EMAs & RSI: Rising RSI and Positive Crossover on EMAs confirm the momentum is aligned to the upside.
🎯 4. Future Scenarios & Key Levels
The stock is primed for a "Blue Sky" breakout.
> 🐂 Bullish Breakout (The Trigger):
- Condition: A decisive Daily Close above ₹298 .
- Target 1: ₹325 .
- Target 2: ₹340 .
> 🛡️ Support (The Safety Net):
- Immediate Support: ₹275 – ₹280 . If the breakout fails, the stock will likely drift back to the middle of the box.
- Stop Loss: A close below ₹262 would invalidate the bullish thesis.
Conclusion
This is a High-Probability Setup . The "Accumulation Spikes" inside the range suggest the breakout is legitimate.
> Strategy: Watch for a high-volume move past ₹298 . The sector tailwinds make this a strong candidate for a new leg up.

Maruti (D): Cautiously Bullish - Low-Volume BreakoutTimeframe: Daily | Scale: Linear
The stock has confirmed a technical breakout from a 3-month rectangular consolidation. While the price action is positive, the low volume suggests a lack of aggressive institutional buying yet. The move is likely driven by year-end seasonality rather than raw momentum.
📈 1. The Chart Structure (Box Breakout)
> The "Box": Rectangle Pattern (or Box Consolidation).
> Resistance (Ceiling): 16,375 . This level capped upside in Oct and early Dec.
> Support (Floor): 15,249.
> The Breakout: Today's close above 16,375 is technically a breakout. It signals that buyers have finally absorbed the supply at this level.
> The ATH Hurdle: It is important to note that the All-Time High (ATH) of 16,600 is just ~1.4% away. A true "Blue Sky" run only starts above 16,600.
⚠️ 2. The Volume Warning (The Risk)
> The Divergence: "volume has been drying up," and today's volume ( 257K ) is relatively minor for a breakout candle.
- Rule of Thumb: A genuine breakout usually requires volume to be 1.5x to 2x the average.
- Risk: Low-volume breakouts often retrace (pull back) to test the breakout level. Do not be surprised if it dips back to 16,375 tomorrow.
🚀 3. The Fundamental Catalyst (The "Why")
The price is likely drifting up due to Seasonality :
> January Price Hikes: Automakers, including Maruti, typically announce price hikes in late December (effective Jan 1st). The market often "front-runs" this news.
> Year-End Discounts: Aggressive Dec sales pushes often boost Q3 numbers, keeping sentiment positive despite low holiday volume.
📊 4. Technical Indicators
> RSI: Rising in all timeframes confirms the trend is healthy.
> EMA: The Positive Crossover on EMAs aligns with the breakout, validating the trend direction even if volume is lagging.
🎯 5. Future Scenarios & Key Levels
The low volume dictates a "buy on confirmation" strategy.
> 🐂 Bullish Target:
- Confirmation Trigger: A daily close above 16,600 (ATH) would confirm volume is returning.
- Target: 17,505 .
> 🛡️ Support (The "Must Hold"):
- Immediate Support: 16,375 . The breakout level must hold on a closing basis.
- Stop Loss: A close below 16,193 (recent consolidation high) would confirm a "fakeout" and likely send the stock back to 15,250.
Conclusion
Technically, the box breakout is valid , but the volume is weak . The safest play is to wait for a close above 16,600 to confirm strength.

Silver on a lifescale time frameOverall, I see that a rise in Silver prices is possible
The extent and speed of rise is getting higher
I feel a big rally is due in 2024 and after!

Can Fin Homes (W): Bullish - Pre-Event BreakoutTimeframe: Weekly | Scale: Logarithmic
The stock is staging a recovery from a steep correction and is currently attacking a key resistance zone. The breakout is supported by a structural "Higher Low" pattern and an upcoming corporate event.
🚀 1. The Fundamental Catalyst (The "Why")
The recent buying interest is likely pricing in a key event:
- Board Meeting (Dec 15, 2025): The company has scheduled a board meeting for Monday, Dec 15 , to consider an Interim Dividend .
- Impact: Dividend announcements often attract short-term buying, which explains the "pick up" in volume and the attempt to clear resistance this week.
📈 2. The Long-Term Structure (Recovery)
> The Cycle: :
- Peak: ATH of ₹951.75 in Sep 2024.
- Correction: A sharp ~41% fall to ₹558.50 (Feb 2025).
- Recovery: Since Feb 2025, the stock has been forming Higher Lows , indicating steady accumulation.
> The Resistance Box: The stock is currently battling the ₹909 – ₹923 zone.
- The Breakout: This week, the stock pierced this zone (High: ₹932) and closed at ₹915.40 .
- Nuance: While it closed above the start of the resistance (₹909), it is still inside the supply zone. A close above ₹923 is needed to confirm the "All Clear."
📊 3. Volume & Indicators
- Volume: The weekly volume of 1.6 Million is healthy. Notably, a significant chunk of this volume came earlier in the week (Dec 8), showing early positioning for the dividend news.
- EMAs: The PCO (Positive Crossover) state across Monthly, Weekly, and Daily timeframes confirms the trend is synchronized to the upside.
- RSI: Rising across all timeframes, confirming that momentum is expanding.
🎯 4. Future Scenarios & Key Levels
The dividend news on Monday will likely decide the next move.
> 🐂 Bullish Target (Breakout):
- Trigger: A decisive Daily Close above ₹923 .
- Target 1: ₹952 (Retest of ATH).
- Target 2: ₹1,177 (Fibonacci Extension).
> 🛡️ Support (The Pullback):
- Immediate Support: ₹909 . This level should now act as a short-term floor.
- Critical Support: ₹880 . If the "sell on news" (post-dividend) occurs, the stock must hold ₹880 to keep the Higher Low structure intact.
Conclusion
The setup is bullish, driven by the Dividend Board Meeting . The stock has effectively "opened the door" by closing above ₹909. Watch for a break of ₹923 next week to confirm the run to the ATH.

PolicyBazaar (D): Strongly Bullish - Stake-Sale Driven BreakoutTimeframe: Daily | Scale: Linear
The stock has confirmed a decisive breakout from a 7-month consolidation phase. This move is supported by rising volume, bullish indicators, and a major strategic investment news flow.
🚀 1. The Fundamental Catalyst (The "Why")
The breakout is driven by a massive vote of confidence from institutional investors:
- Stake Acquisition: Reports confirm that MacRitchie Investments (a Singapore-based entity) has acquired a 6.47% stake in PB Fintech.
- Impact: When a large foreign investor acquires a significant stake, it often creates a new "valuation floor" for the stock. This news is the primary trigger for the volume surge and breakout.
- Strong Earnings: This follows a robust Q2 performance where Net Profit surged, validating the company's profitability trajectory.
📈 2. The Technical Structure (The "Box" Breakout)
> The Consolidation: Since May 2025 , the stock has been trapped in a wide rectangular channel:
- Resistance (The Ceiling): ₹1,945 – ₹1,955 . This level rejected rallies in June and early September.
- Support (The Floor): ₹1,625 – ₹1,645 . This zone acted as a strong demand area during corrections.
> The Breakout: Today (Dec 9), the stock decisively broke and closed above the ₹1,955 resistance.
> Volume: The move was backed by 2.32 Million in volume. This expansion confirms that the "supply" at ₹1,955 has been fully absorbed by buyers.
📊 3. Technical Indicators
Indicator analysis confirms the momentum shift:
- EMA: Short-term EMAs are in a Positive Crossover state across Monthly, Weekly, and Daily timeframes, confirming a synchronized bullish trend.
- RSI: Rising across all timeframes. A rising RSI alongside a price breakout is a classic sign of sustainable momentum.
🎯 4. Future Scenarios & Key Levels
With the "lid" at ₹1,955 removed, the stock is primed to retest its highs.
> 🐂 Bullish Target:
- Target 1: ₹2,246 (The ATH). This is the immediate structural target.
- Blue Sky: A sustained move above ₹2,246 puts the stock in price discovery mode.
> 🛡️ Support (The "Must Hold"):
- Immediate Support: ₹1,945 – ₹1,955 . The breakout zone has now flipped to support. Any pullback to this level is a high-probability "buy the dip" zone.
- Stop Loss: A close below ₹1,868 would imply a "fakeout" and invalidate the bullish thesis.
Conclusion
This is a High-Quality Setup . The combination of a technical breakout and a strategic stake buy makes this a high-probability trade. Watch for the stock to hold above ₹1,945 .

NALCO (W) - Strongly Bullish - Fundamentally-Driven BreakoutTimeframe: Weekly | Scale: Linear
The stock has confirmed a major structural breakout, shattering a 2-year consolidation ceiling. This move is supported by a "trifecta" of bullish factors: a technical breakout to new ATHs, rising volume, and stellar quarterly earnings.
🚀 1. The Fundamental Catalyst (The "Why")
The breakout is fueled by strong business performance, which gives the technical move high conviction:
- Stellar Earnings: The company recently reported a ~35% surge in Net Profit (YoY) for Q2 FY26, driven by higher aluminum prices and operational efficiency.
- Dividend Yield: The announcement of a ₹4/share interim dividend has attracted yield-seeking investors.
- Expansion: A massive ₹30,000 Crore investment plan for smelter expansion and lithium acquisition is driving long-term re-rating.
📈 2. The Long-Term Structure
> The "Box" Breakout:
- Range: Between ₹137 (Support) and ₹263 (Resistance) .
- Consolidation: The stock spent 4 weeks coiling just below ₹263. This "buildup" right under resistance is a classic bullish sign—it shows buyers were absorbing all supply before the breakout.
> The Breakout: This week’s 5.07% surge with 54.78 Million volume is the "Ignition." By closing at a new ATH, the stock has entered "price discovery" mode.
⚠️ 3. Technical Correction: The "Double Top" Myth
- Current Status: Since the stock has broken and closed above the previous high (₹263), the Double Top pattern is invalidated (or "busted"). A busted bearish pattern is actually a powerful bullish signal, as it forces short-sellers to cover their positions, adding fuel to the rally.
📊 4. Technical Indicators
- EMAs: The PCO (Positive Crossover) state across Monthly, Weekly, and Daily timeframes confirms the trend is synchronized.
- RSI: Rising across all timeframes. Importantly, in a strong uptrend, an RSI above 60 is a sign of strength, not necessarily "overbought."
🎯 5. Future Scenarios & Key Levels
The stock is now in Blue Sky territory.
> 🐂 Bullish Case (Continuation):
- Trigger: Sustained trading above ₹263 .
- Target: ₹330 . This aligns with the technical extension of the consolidation range height added to the breakout point.
> 🛡️ Support (The Re-test):
- Immediate Support: ₹263. The previous "ceiling" is now the "floor." Any pullback to ₹263-265 is a high-probability buying opportunity.
- Stop Loss: A close below ₹240 would imply the breakout was a "fakeout" (Bull Trap) and invalidate the thesis.
Conclusion
This is a Grade A Setup . The "Double Top" fear is gone; the resistance is broken. Backed by record profits and heavy volume, the path of least resistance is toward ₹330 . Watch for the stock to hold the ₹263 level on any dips.

Apollo Tyres (D): Bullish, Momentum Building at ResistanceTimeframe: Daily | Scale: Linear
The stock is staging a strong recovery from the lower end of its consolidation range. It is now challenging the critical supply zone, backed by rising volume and positive fundamental developments (pledge release).
🚀 1. The Fundamental Catalyst (The "Why")
The renewed buying interest is driven by two key factors:
- Pledge Release: On Nov 17, 2025 , Catalyst Trusteeship released a massive pledge on 63 Million shares (approx. 9.9% stake). The removal of this overhang is a major confidence booster for investors.
- Softening Input Costs: Recent reports suggest a bearish outlook for Crude Oil (a key raw material for synthetic rubber), which directly improves margin outlooks for tyre companies.
📈 2. The Technical Structure (The "Box")
> The Range: The stock has been trapped in a wide "Box" pattern:
- Floor (Support): ₹364 – ₹370 . This level has held firm since May 2023, acting as a strong accumulation zone.
- Ceiling (Resistance): ₹545 – ₹550 . This zone (active since Jan 2024) has rejected multiple rally attempts, including the failed breakout to the ATH of ₹585 in Sep 2024.
> Current Action: The stock is currently consolidating just below this resistance.
- The Surge: Today's move (closing ~3% up) with 1.52 Million volume indicates that bulls are gathering strength to attack the resistance again.
📊 3. Technical Indicators
Indicator analysis shows a synchronized bullish trend:
- EMAs: The PCO (Positive Crossover) state across Monthly, Weekly, and Daily timeframes confirms that the trend is aligning upwards across all horizons.
- RSI: Rising across all timeframes, showing that momentum is expanding into the breakout attempt.
🎯 4. Future Scenarios & Key Levels
The stock is at a decision point. We need a confirmed breakout to avoid another rejection.
- 🐂 Bullish Breakout (The Trigger):
- Condition: A decisive Daily Close above ₹550 .
- Target 1: ₹585 (The ATH). This is the immediate magnet.
- Target 2: ₹630 . If the stock enters "blue sky" discovery, this is the technical extension target.
- 🐻 Bearish Rejection (The Range Play):
- Condition: If the stock faces heavy selling at ₹545-550 again.
- Support: The stock would likely drift back to the mid-range support at ₹512 or the 20-day EMA.
Conclusion
The setup is promising. The Pledge Release removes a major structural risk, and the technicals are aligned. However, do not anticipate the breakout. Wait for a close above ₹550 to confirm that the "ceiling" has finally been shattered.

IIFL Finance LimitedPrice is breaking out above a long consolidation range, but the move is short term overextended, so both upside continuation and a pullback retest are likely scenarios rather than a one way move. This is educational analysis, not personalized financial advice; position sizing and risk must match your own plan.
Trend and structure
• The chart shows IIFL Finance Limited breaking out above a broad sideways range, with current price near the upper boundary of that rectangle zone around the 570–580 area.
Moving averages
• The shorter moving averages (such as 20 and 50 day) are now sloping upward and positioned above the longer averages, which is typically a sign of emerging bullish momentum after a prior base.
RSI and momentum
• The daily RSI on the chart is in the higher band, showing strong positive momentum but also edging toward overbought territory where pullbacks or sideways pauses are common.

Kirloskar Oil Engines - Swing TradeKirloskar Oil Engines Limited - Technical Analysis Report
Current Market Price: 1,005.70
MARKET BIAS: BULLISH RECOVERY IN PROGRESS
Kirloskar Oil Engines is currently trading at 1,005.70, showing signs of bottoming out after a significant correction from its all-time highs of ₹1,450+. The stock is now forming a potential reversal pattern.
KEY TECHNICAL OBSERVATIONS:
1. Major Support Zone - HOLDING STRONG ✅
The stock has found solid support in the 900-950 zone, which coincides with:
- Multiple moving average convergence (EMA 20/50/100/200)
- Previous resistance-turned-support from mid-2025
- Psychological round number support at 900
The price has bounced decisively from this zone, suggesting accumulation by institutional investors.
2. Consolidation Rectangle Pattern (Daily/Weekly)
A clear *rectangular consolidation box* :
- Upper Range: 1,016 - 1,050
- Lower Range: 900 - 950
This sideways movement indicates Distribution completion and potential energy buildup for the next directional move.
All major EMAs are converging in the 890-910 zone, creating a strong support cluster.
TARGET ANALYSIS:
Immediate Resistance Targets:
Target 1: 1,180 - 1,200 (First Major Resistance)
- Previous consolidation high from December 2025
- 61.8% Fibonacci retracement of the recent decline
Target 2: 1,334 (Secondary Target)
- Major swing high marked on weekly chart
- Psychological resistance zone
Target 3: 1,450 (Extended Target)
- Previous all-time high zone
- Final resistance before new highs
Critical Support Levels:
- 1,000: Immediate psychological support
- 900-920: MAJOR SUPPORT (EMA cluster + pattern base)
BULLISH BREAKOUT (Higher Probability - 65%)**
CONCLUSION:
Kirloskar Oil Engines is at a Critical juncture with strong technical setup favoring a Bullish breakout. The stock has:
- ✅ Successfully held major support zones
- ✅ Maintained position above all key moving averages
- ✅ Formed higher lows indicating accumulation
- ✅ Built a strong base for the next upward move
Disclaimer: This analysis is for educational purposes only. Please consult with your financial advisor before making investment decisions. Past performance does not guarantee future results.

Indonesia flag n pole ready for breakoutIDX:IDX30
everybody knows what to do now.
start your money-making machine with full throttle
please do your own research before taking any trade.
i am not financial advisor
risk is real stay practical
please feel free to ask any questions

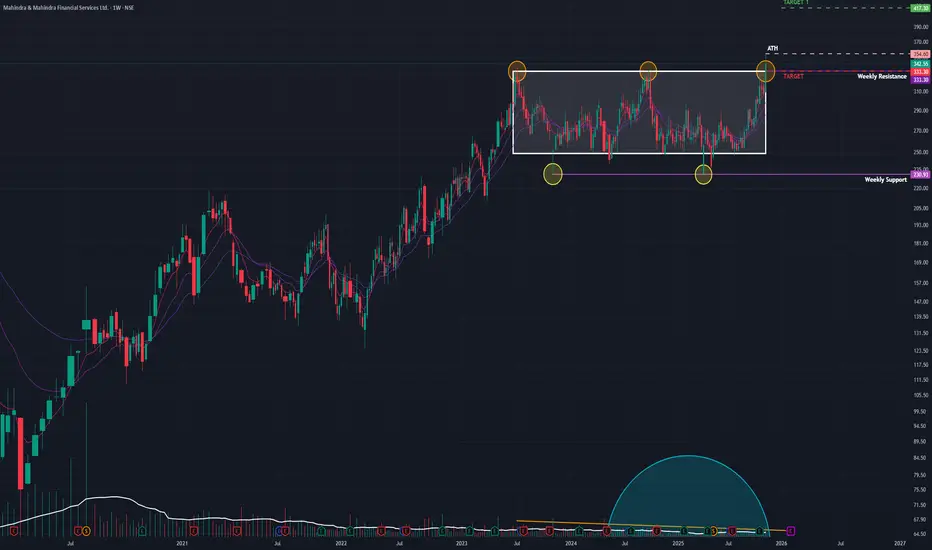
M&M Fin (W): Bullish, Breakout with Short-Term Rejection(Timeframe: Weekly | Scale: Logarithmic)
The stock has confirmed a major multi-year breakout, moving into "Blue Sky" territory. However, the daily price action suggests a temporary pullback (re-test) is imminent before the uptrend resumes.
📈 1. The Breakout Structure (The "Big Picture")
- The Setup: The stock has been trapped in a consolidation phase since its July 2023 peak. The ₹330–₹335 zone acted as a rigid "ceiling" for over two years.
- The Breakout: The week of Nov 17 was decisive. The stock surged 10.98% , closing above this multi-year resistance for the first time.
- Volume: The move was backed by 29.74 Million in volume —a significant expansion compared to the "dry" consolidation phase, confirming institutional participation.
🕯️ 2. The "Shooting Star" Warning (Daily Chart)
- The Pattern: The last daily candle (Friday) formed a Shooting Star . It opened high, rallied to a new peak (~₹354), but faced heavy selling pressure to close near the lows (~₹342).
- Implication: This "long upper wick" shows that sellers are aggressively defending the ₹350+ level. It strongly suggests that the breakout is "tired" and a re-test of the breakout zone is likely next week.
🚀 3. The Fundamental Catalyst (The "Why")
This technical move is supported by strong fundamentals, which adds confidence to the long-term bullish view:
- Earnings: The breakout is a delayed reaction to strong Q2 FY26 results, where Net Profit surged ~54% YoY and asset quality improved.
- Outlook: This fundamental strength suggests that any dip (re-test) will likely be bought by smart money.
📊 4. Indicators & Trend
- RSI & EMAs: RSI is rising (bullish momentum) and EMAs are in PCO state (trend alignment) across Monthly and Weekly charts. This confirms the primary trend is UP.
🎯 5. Future Scenarios & Key Levels
The "Shooting Star" dictates the immediate game plan: Wait for the Re-test.
🐂 The Bullish Case (Buy the Dip)
- The Strategy: Watch for the stock to pull back to the ₹333 – ₹335 zone (the resistance-turned-support).
- Confirmation: If the price stabilizes or forms a bullish candle (like a Hammer) at this level, it is a high-probability entry.
- Target 1: ₹417
- Target 2: ₹475
🐻 The Failure Case (Fakeout)
- Trigger: If the selling pressure from the Shooting Star intensifies and the stock closes back below ₹333.
- Consequence: This would confirm a "fakeout" (bull trap), and the stock could slide back toward the consolidation midpoint around ₹300.
Conclusion
The breakout is genuine, but the Shooting Star signals a short-term pause. The ideal approach is to wait for the re-test at ₹335 to confirm that the "ceiling" has truly become a "floor."