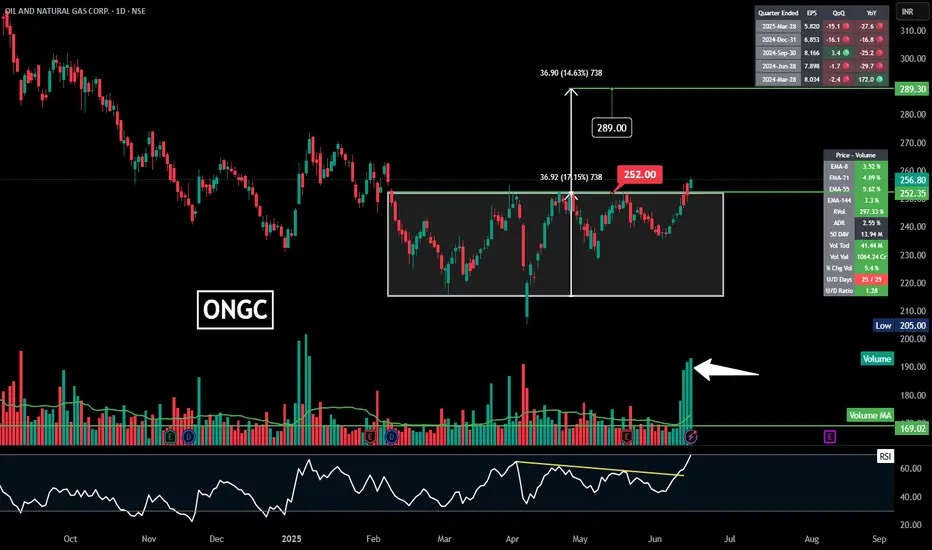
ONGC | Rectangle Range Breakout | Daily🔥 Another strong breakout — this time from **ONGC** — confirming a **Rectangle Range Breakout** pattern.
---
## 🛢️ **ONGC – Rectangle Range Breakout**
### 📍 **Pattern**:
* Consolidation in a **horizontal range** (Rectangle)
* Strong breakout above ₹252 with **massive volume spike**
* Target projected:
₹252 + ₹36.90 = **₹289**
---
### 📈 **Technical Highlights**
* ✅ Price broke out with highest volume spike in months
* ✅ RSI breakout above descending trendline
* ✅ EMA 8/21/55/144 all in bullish alignment
* ✅ Price surged >2% on breakout day with U/D days turning positive (25/25)
---
### 📊 **Volume & RSI Confirmation**
* RSI breaking the bearish trendline = momentum returning
* Volume bar way above average — **high conviction breakout**
* Clean breakout after multiple rejections around ₹252 = **strong resistance flip**
---
### 🚀 **Trade Setup**
* **Entry**: ₹252–₹258 zone
* **Target**: ₹289
* **Stoploss**: ₹238 (or below range bottom for safe positioning)
---
Rectangle
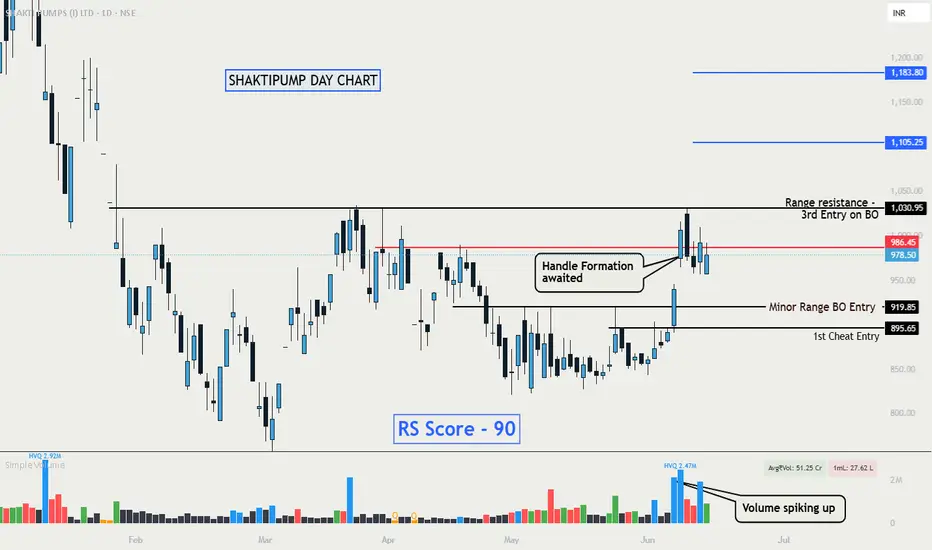
Breakout in SHAKTIPUMP - Spotted Smart money activityNSE:SHAKTIPUMP moved to priority list, Handle formation awaited as it has positioned well with a horizontal resistance of a larger range.
It will be a 3rd Entry Trigger - On breakout of 1030
Fundamentals Looks great - Strong EPS and Sales.
FPI - Increased stake by 3% in last quarter - making it 5.16% Total.
Volume Showing smart money jumping in.
Keep On Radar- 📈
Keep Learning, Happy Trading.
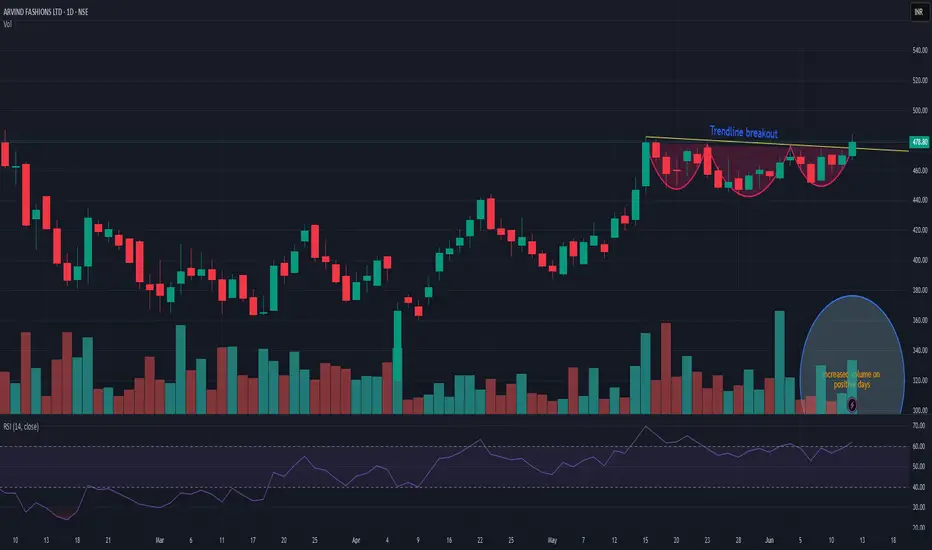
ARVINDFASNARVINDFASN showing very good strength on this negative days as well and currently trying to coming out of consolidation. As long as it is closing above 440 then dips are good to accumulate. Positive momentum may fetch the stock up to 600 in near term. And next trigger level can b above 485. Wait for the perfect entry point.
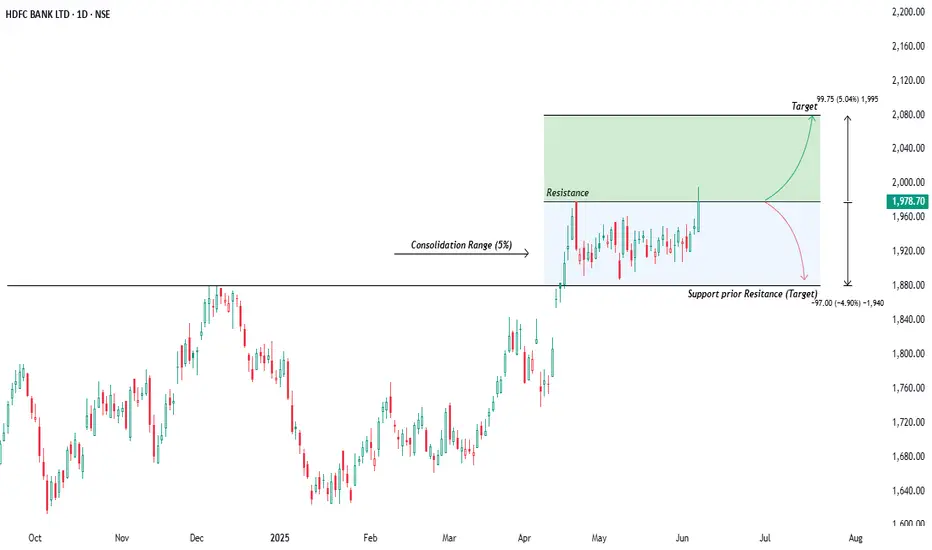
Hdfc Bank: Swing Trade IdeaHello Traders, Hope you're catching the right trends! so today we will discuss Hdfc bank on Daily chart as we can see that price formed a consolidation pattern following it's sharp uptrend in April. After a sustained rally, the share price paused and entered a sideways phase within a narrow 5% range, indicating temporary equilibrium between demand and supply. What makes this setup noteworthy is the position of the consolidation right above the prior resistance zone near 1880, which has now been tested as support. This behavior reflects classic price action dynamics, where old resistance turns into new supporta key trait of strength in trending markets.
Over the past weeks, the stock has been coiling within this tight rangeand creating a well defined rectangle pattern. The upper resistance of the range is marked around 1980. On the latest daily candle, the price has started to show intent to break out of this zone with momentum. If the breakout sustains with volume confirmation, it opens up the potential for a bullish continuation toward the projected target of 2080, a measured move equal to the height of the consolidation zone.
However it's important to remain objective if the price fails to sustain above the 1980 resistance and instead shows signs of rejection or downward traction, the breakout attempt may be considered a false move. In such a case, a reversal toward the lower end of the consolidation becomes likely. This opens up a short opportunity, targeting the support below which prior was resistance and marked on chart too. A breakdown from this range would further confirm bearish sentiment in the near term.
Risk management-: Invalidation is defined by a daily close in the opposite direction of the trade.
This publication is meant for only learnig purpose and not contains any kind of trading advice.
Good trades ahead, Amit.
Nifty | Expiry 12 -06-2025 | Technical Analysis
Consolidation Box: ₹25,077 – ₹25,222
Breakout above ₹25,222.40 can lead to continuation toward ₹25,275+ or even new highs.
Breakdown below ₹25,077 can lead to a correction toward:
Minor support: ₹24,958
Strong support: ₹24,887 (prior breakout level)

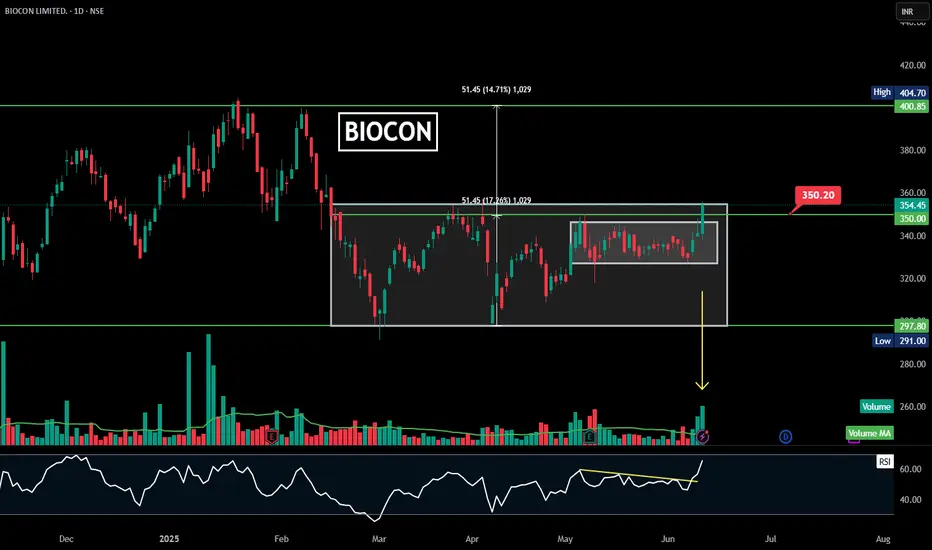
BIOCON |Rectangle | Consolidation Breakout | Daily
### 🏺 **Pattern Overview:**
✅ **Horizontal Rectangle / Consolidation Breakout:**
* **Range:** ₹297.80 (support) to ₹350.20 (resistance).
* **Breakout Price:** ₹350.20 confirmed (recent candle closed above it).
* **Current Price:** ₹354.45, showing a breakout and potential further upside.
---
### 🎯 **Measured Move Target:**
* **Measured height of the rectangle:** \~₹51.45.
* **Target price zone:** ₹400–₹405 in the medium-term.
* **Resistance levels:** ₹400.85–₹404.70 (previous swing highs).
---
### 📊 **Volume & RSI Insights:**
* **Volume:** Surge in breakout session – confirms buyers’ strength.
* **RSI:** Clear breakout of a downward-sloping RSI trendline (marked in yellow).
* **Volume MA:** Above average, which adds to breakout reliability.
---
### 💡 **Key Takeaway:**
Biocon has **broken out of a consolidation range** at ₹350.20 with healthy volume and RSI confirmation. A potential **upside target is ₹400–₹405** in the coming weeks if the breakout sustains.
---
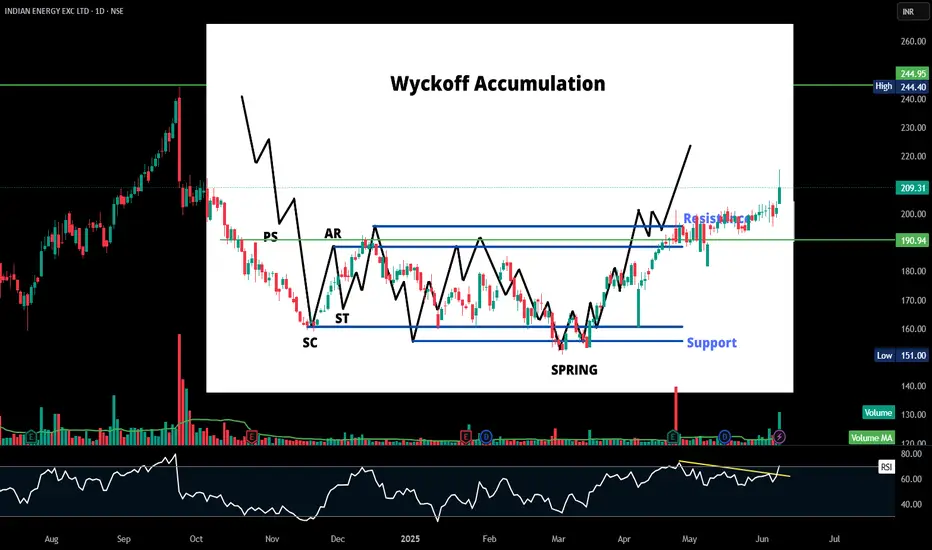
IEX | Consolidation BreakOut | DailyHere’s a **condensed Wyckoff Accumulation Analysis** based on your most recent chart for **Indian Energy Exchange Ltd. (IEX)**:
---
🔍 **Key Wyckoff Phases & Levels:**
* **PS (Preliminary Support):** Initial slowing of the downtrend.
* **SC (Selling Climax):** Sharp selloff forming the bottom.
* **AR (Automatic Rally):** First bounce confirming initial demand.
* **ST (Secondary Test):** Testing previous lows around SC.
* **Spring:** Fakeout below support, creating panic-selling before reversal.
* **Markup Phase:** Breakout above resistance, transitioning to uptrend.
---
📈 **Critical Price Zones:**
* **Support:** \~₹203 and 190
* **Resistance:** \~255
---
⚡ **Technical Indicators:**
* **RSI:** Above 60 with breakout, suggesting strong momentum.
* **Volume:** Increased volume on breakout candles signals institutional accumulation.
---
💡 **Conclusion:**
IEX has confirmed the Wyckoff accumulation pattern and is now in the **markup phase**, targeting ₹245 to 255 if it sustains above ₹203 and 190.
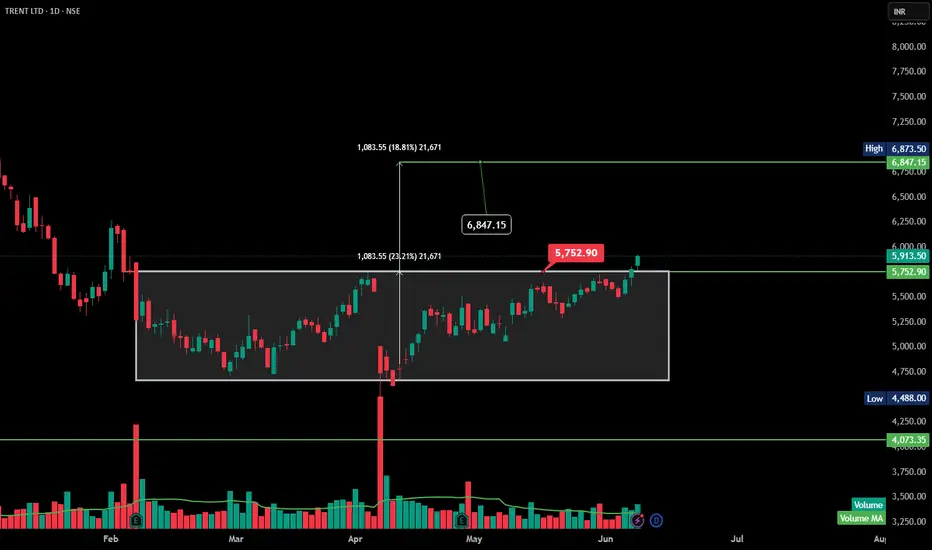
TRENT | rectangle range breakout |DailyHere’s a **technical analysis summary** for TRENT Ltd (NSE: TRENT) based on the chart you provided:
---
🔍 **Pattern Observed:**
The chart highlights a **rectangle range breakout** or a **horizontal consolidation breakout**. Price was consolidating between \~₹4,670 and ₹5,750 levels for several weeks and has now broken out above ₹5,750, confirming the breakout.
---
🔹 **Key Levels:**
* **Breakout zone:** ₹5,750
* **Current price:** \~₹5,913.50
* **Next resistance/target:** Measured move target around ₹6,847–₹6,900 based on the height of the rectangle (₹1,083.55 added to the breakout point).
* **Support:** ₹5,750–₹5,600 zone.
---
🔹 **Volume is missing during breakout.
BANKNIFTY | Consolidation breakout | DailyHere’s a technical summary for the BANKNIFTY Index based on the chart:
✅ Pattern: Consolidation breakout is visible.
✅ Breakout Zone: Price has successfully broken out of the consolidation range near 53,949–56,192 levels.
✅ Target Projection: The measured move suggests a potential upside target at 58,391.
✅ Volume & RSI: Volume is confirming the breakout. RSI (14) is at 67.45, indicating strong momentum with a potential for slight overbought caution.
⚠️ Key Levels to Watch:
Support: 56,192 (breakout zone) and 53,949
Resistance: Next potential resistance at 58,391
RSI Divergence: Consolidation breakout.
Outlook: The index looks strongly bullish with a clear target of 58,391. However, if there’s a failed follow-up to this breakout, the 56,190 range level will act as immediate support for any pullback.

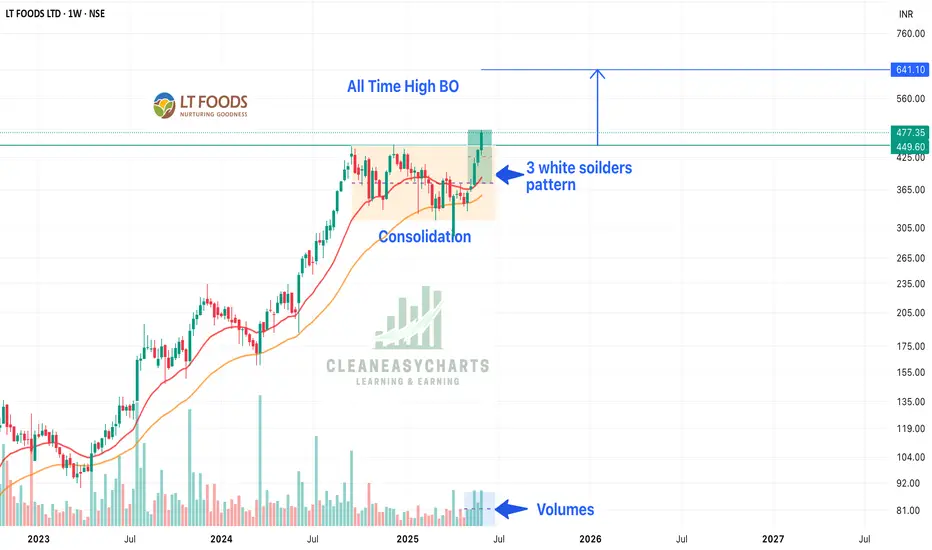
LT Foods - All Time High Break OutLT Foods has given a all time high BO and is looking great. Factors which make this stock promising:
1. On weekly time frame made 3 White Shoulder Pattern - which is a bullish pattern
2. Breakout after a long consolidation - consolidating from 11 odd months
3. Volume is increasing / steady
4. A rectangular pattern BO as well
5. Fundamentally, LT Foods has lots of opportunities as they have gone beyond India
6. LT Food has ventured in organic food as well with recent 17% acquisition of Nature Bio-India
Above factors make this stock a great pick and hold it for super gains.
Keep following @Cleaneasycharts as we provide Right Stock at Right Time at Right Price.
Cheers!!!
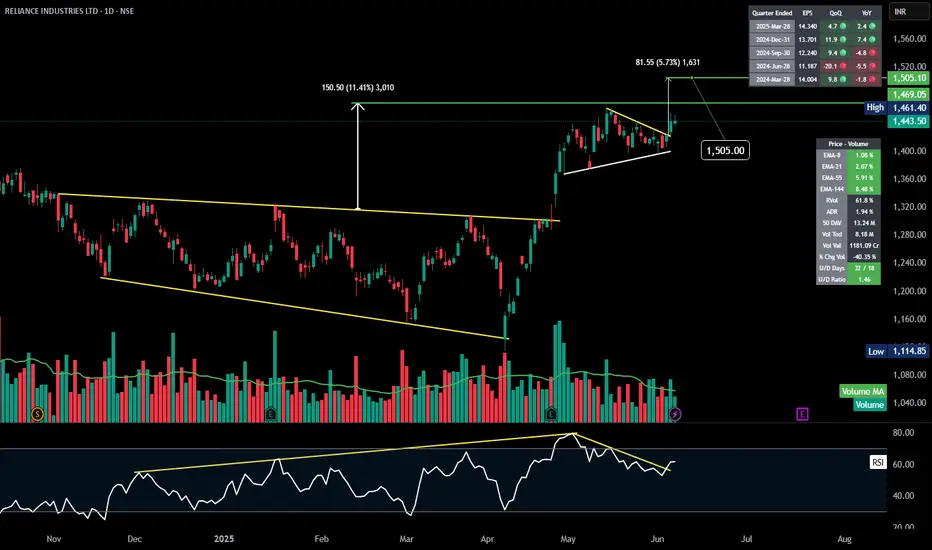
RELIANCE | Symmetrical Triangle | Breakout | Daily Here’s a detailed technical analysis of **Reliance Industries Ltd (RELIANCE)** based on the images you provided:
---
### 📊 **1️⃣ Pattern Overview:**
* **Falling Wedge Pattern:**
* A large falling wedge spanning several months from 2024 to early 2025, clearly visible in the first set of images.
* The stock broke out of the wedge in April-May 2025, leading to a significant up-move.
* **Continuation Triangle Pattern:**
* Post breakout, the stock formed a symmetrical triangle (or continuation pennant) in late May to early June 2025.
* The stock has just broken out of this consolidation, suggesting a continuation of the uptrend.
---
### 📈 **2️⃣ Key Levels:**
* **Breakout Levels:**
* Falling Wedge breakout: Around **1,300**
* Continuation Triangle breakout: Around **1,443.50 - 1,461.40**
* **Current Price:** **1,443.50**
* **Measured Move Targets:**
* Wedge depth measured move: \~**150.50 points** (11.41%)
* Continuation triangle target: \~**81.55 points** (5.73%)
* **Price Targets:** **1,505.00** and possibly **1,531 - 1,540** based on the continuation move.
---
### 💡 **3️⃣ Indicators & Confirmation:**
* **Volume:**
* Noticeable volume spikes during breakouts, confirming strong buying interest.
* Post-breakout consolidation volumes have been healthy (lower, indicating accumulation).
* **RSI:**
* Divergence in RSI before the wedge breakout (lower lows in price, but not in RSI – bullish divergence).
* Currently, RSI is bouncing back from around 60, supporting continued bullish momentum.
* **EMA Analysis:**
* EMA-8, EMA-21, EMA-55, EMA-144 all sloping up, indicating strong trend alignment.
* EMA-8 and EMA-21 holding as dynamic support, especially on the 1,443 breakout.
---
### ⚙️ **4️⃣ Key Support and Resistance:**
* **Supports:**
* 1,443-1,461 zone: Breakout levels and EMA cluster support.
* 1,300 zone: Former wedge breakout level and major pivot support.
* **Immediate Resistance:**
* 1,505.00 (immediate price target)
* Followed by 1,531-1,540 zone.
---
### 🚦 **5️⃣ Risk Management / Trade Strategy:**
* **Stops:**
* Conservative stop-loss: Below 1,443 (immediate breakout zone).
* Wider stop-loss: Below 1,400 (where EMA-21 is likely to support).
* **Entry:**
* Re-entry on pullbacks to breakout levels (1,443-1,461) with tight risk control.
* **Upside Potential:**
* Short-term: 1,505
* Medium-term: 1,540 zone
---
### 🔍 **Summary:**
✅ **Bullish Wedge breakout** has been confirmed and has driven the stock significantly higher.
✅ **Continuation triangle breakout** at 1,443-1,461 zone suggests further upside to 1,505 and 1,540.
✅ RSI, volume, and EMAs align with a continued bullish bias.
---
💬 **Would you like me to draft a YouTube video script, a trading plan document, or a social media post for this analysis? Let me know! 🚀**
I am Bullish on Kotak BankMonthly chart - After consolidation Breakout- Retesting- CIP
Weekly Chart - 20 MA support
Daily Chart - Lower band support- Fib 0.61 at 40 RSI support, Relative strength positive, Trendline breakout
Sector Bullish

Gold Uptrend Continues June 6, 2025As yesterday Gold made high of 3403, I was expecting to cross upto 3430 but it dropped sharply. News was strong and as it made cautious to investors and safe heaven asset declines moved back to riskers market to 3340.
Now today you can check a pattern and gold is moving in that support and resistance, expecting it to move upward. Currently the situation is unexpected as gold may come down to 3340 and then move upward or directly upward from 3358. Our target is 3375-3389-3400.
Key point.
Resistance - 3360, 3375, 3389, 3400
Support - 3340, 3354
Any Query Reach Us or comment down
Rudra Vasaikar Wishes You A Great And Very Amazing Trading Life. Trade Safe, Trade Right.
RISK WARNING 🔴 🔴 🔴
There is high risk of loss in Trading Forex, Crypto, Indices, CFDs, Features and Stocks. Choose your trade wisely and confidently, please see if such trading is appropriate for you or not. Past performance is not indicative of future results. Highly recommended - Information provided by Pro Trading Point are for Educational purpose only. Do your investment according to your own risk. Any type of loss is not our responsibility.
HAPPY TRADING.
#gold #xauusd #xauusdtrading #goldtrading #goldanalysis #forextrading #forex #trendline #goldsignals #goldnews goldlatestanalysis #xauusdtradesetup #forextradingguide #fxgold

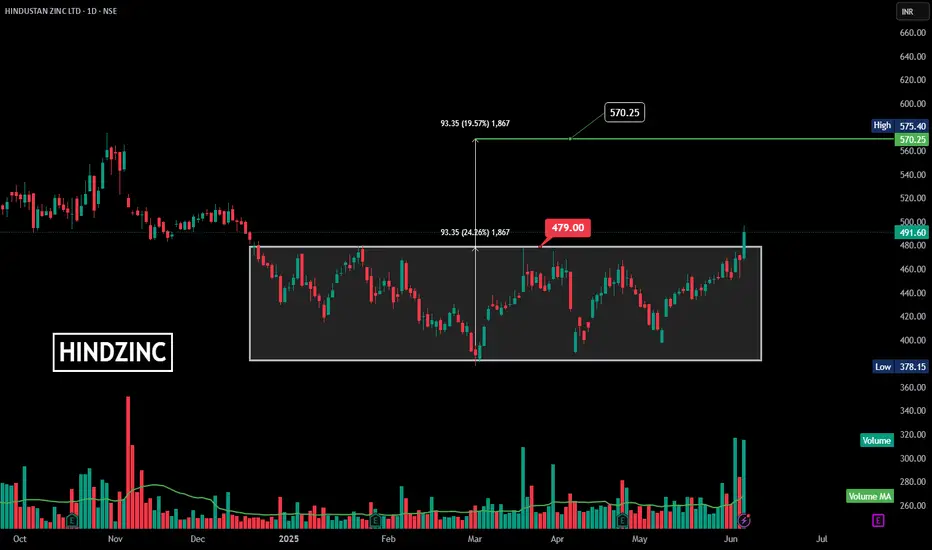
HINDZINC | Rectangular Consolidation | Breakout | DailyHere’s a detailed **technical summary and analysis** of the Hindustan Zinc Ltd. (HINDZINC) chart you shared:
---
### **Chart Pattern & Setup:**
✅ **Rectangular Consolidation / Range Breakout:**
* The stock has been trading within a range (rectangle) from approximately **378.15 (low)** to **479.00 (resistance)** for several months (since December 2024).
* This consolidation pattern signifies **accumulation**.
✅ **Breakout:**
* Price action has decisively broken out of the **rectangle’s upper boundary at 479.00 INR**.
* **Current price:** 491.60 INR, showing bullish momentum.
---
### **Measured Move & Target:**
* The height of the range (rectangle) is **93.35 INR** (24.26% move).
* **Target Calculation:**
$\text{Breakout Level (479)} + \text{Height (93.35)} = \approx \textbf{570.25 INR}$.
* Immediate resistance level is around 570-575 INR.
---
### **Volume Analysis:**
✅ A **significant spike in volume** confirms the breakout, validating the buying interest.
✅ The **Volume MA line** is also trending up, showing sustained interest.
---
### **Key Levels:**
* **Resistance (Breakout level):** 479.00 INR
* **Target:** 570.25 INR
* **Current Price:** 491.60 INR
* **Immediate support:** 479.00 INR
* **Low support:** 378.15 INR
---
### **Conclusion & Trade Idea:**
This breakout from a **rectangle consolidation** is a strong bullish signal, especially with the volume confirmation. If the price sustains above 479 INR, the next likely target is **570-575 INR**.
---
Would you like me to:
✅ Create a YouTube video title and description with these details?
✅ Suggest a possible trading plan or risk management idea?
✅ Generate hashtags for maximum YouTube SEO visibility?
Let me know! 🚀✨
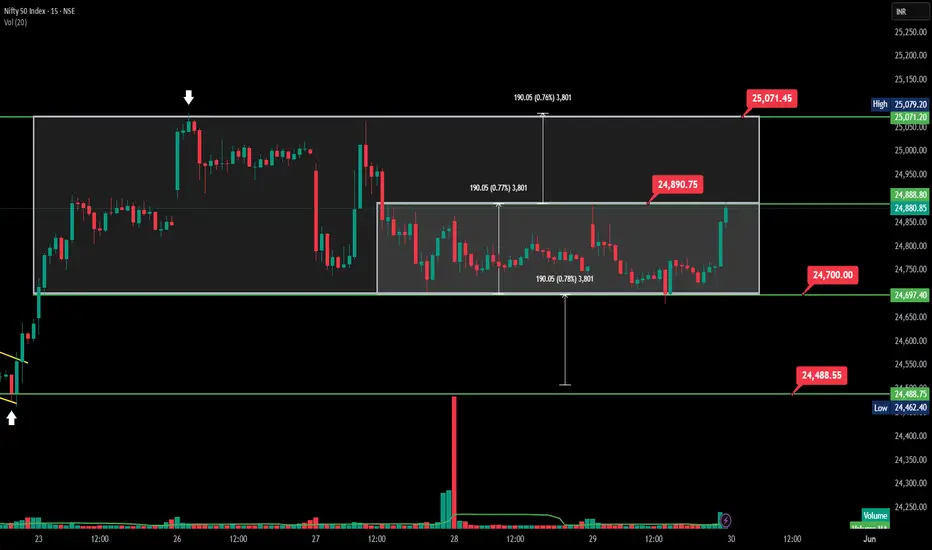
Nifty 50 Consolidation Zone – Ready to Explode?Here's a **brief high-level analysis** of the **Nifty 50 Index (15-min chart)**:
---
## 📊 **Nifty 50 – Consolidation & Breakout Setup**
* 🧱 **Structure**: Sideways consolidation in a **190-point range**
* 🔍 **Zones**:
* **Resistance**: ₹24,890
* **Support**: ₹24,700.00
* ⚡ **Breakout Watch**: Price approaching upper range
* 🕵️♂️ **Volume**: Spikes on breakout attempts hinting smart money interest
---
### 📌 **Scenarios to Track**
* ✅ **Bullish breakout above** ₹24,891 could lead to a **target of ₹25,070+**
* ❌ **Failure below** ₹24,700 may retest **₹24,488 support**
---
📌 *Ideal for intraday scalping or tight stop swing plays. Wait for volume confirmation on breakout.*
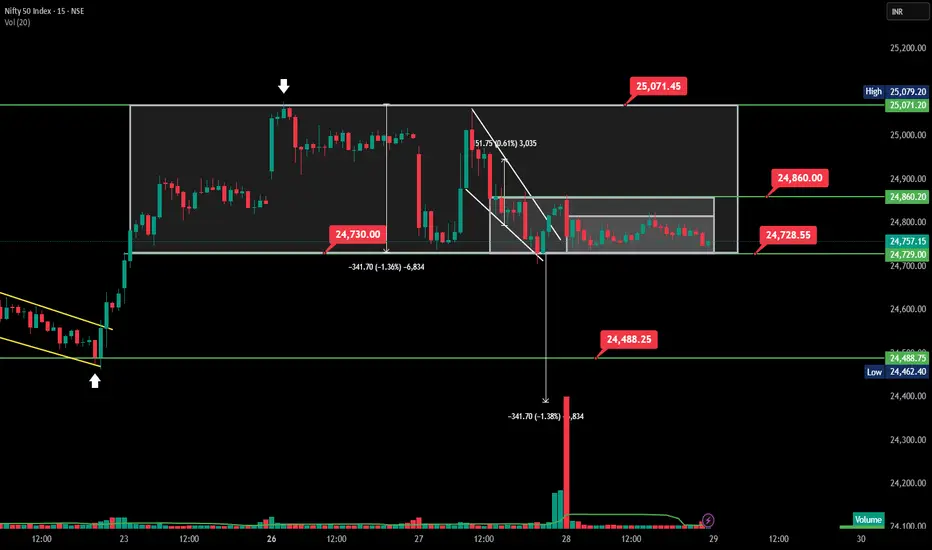
Nifty 50 chart breakdown (15-min TF) Levels for 29th MayHere’s a breakdown of the **Nifty 50 Index (15-minute chart)**
---
## 🧠 **Intraday Technical Analysis – Nifty 50 (15M TF)**
**Date:** May 28, 2025
**Pattern Observed:** Box Range Breakdown with Measured Move
**Timeframe:** 15-minute chart
---
### 🔍 **1. Chart Structure**
* The index **broke out** of a falling wedge pattern but unable move above 24860.
* **Range formation:** A strong horizontal box range formed between **24,730 – 25,071**, holding for multiple sessions.
* **Breakdown:** Price broke the lower boundary at **24,730**, triggering a sell-off of \~342 points (-1.36%) down to **24,488**, which matches the **measured move**.
---
### 📉 **2. Breakdown Move**
* **Breakdown Level:** 24,730
* **Measured Target:** 24,488 (achieved perfectly)
* **Volume Spike:** Major red volume candle confirms institutional selling post-breakdown.
---
### 🔄 **3. Post Breakdown Consolidation**
* After hitting the measured target, the index formed a **mini-consolidation box** between **24,729–24,860**.
* **Price struggling to reclaim 24,860**, indicating weak intraday buying and possible continuation.
---
### 🔁 **4. Key Levels**
| Level Type | Price (₹) |
| -------------------- | --------- |
| Resistance (Box Top) | 25,071 |
| Breakdown Level | 24,730 |
| Mini-Range Top | 24,860 |
| Support/Target Hit | 24,488 |
---
### 📌 **5. Conclusion & Strategy**
* **Bias:** Bearish below 24,729
* **Next move:** If price breaks below **24,729**, a retest of **24,488–24,462** zone is likely.
* **Bullish above 24,860** only if accompanied by volume.
* **Intraday Scalping Zone:** Between 24,729–24,860 (rangebound behavior)
---
Here's a **Nifty 50 Open Interest (OI) analysis** based on the charts you've provided (as of May 28, 2025):
---
### 📊 **1. Open Interest Data Interpretation**
* **Spot Price**: 24,757.15
* **Max Pain**: 24,800
* **Put-Call Ratio (PCR)**:
* **Current PCR**: 0.888 → Slightly bearish to neutral
* **PCR (All)**: 0.6626 → Bearish sentiment
#### 🔹 Key OI Levels:
* **Highest Call OI**:
* **25,000 CE** with \~1.2 Cr contracts
* Suggests **strong resistance** at 25,000 and 24,800
* **Highest Put OI**:
* **24,500 PE** with \~78L contracts
* Suggests **strong support** at 24,500
---
### 📈 **2. Change in OI (Intraday Insight)**
* **Strong addition in Call OI** at:
* **24,800 CE**
* **24,750 CE**
* Indicates fresh short positions in calls → Bears active here
* **Put OI change**: Mixed with some unwinding around 24,900–25,000
* **Short Put unwinding** near higher levels = Reduced bullish conviction
---
### 🔍 **3. Technical Chart (15-Minute View)**
* **Price action** shows a breakdown from a range between **24,730–25,070**
* Breakdown target met at **24,488**, now consolidating in a small range
* Heavy volume seen on the breakdown → confirms strength of sellers
---
### 📌 **4. Conclusion**
| Factor | Interpretation |
| ------------------- | --------------------------- |
| PCR | Bearish (below 1) |
| Max Pain | 24,800 (neutral zone) |
| Resistance | 25,000 |
| Support | 24,500 |
| Chart Price Action | Bearish breakdown confirmed |
| Volume on Breakdown | Very high |
---
### 📣 **Strategy Insight**
* **Intraday bias**: Bearish below 24,750
* **Upside capped** at 24,860–25,000 unless short covering occurs
* **Downside support**: 24,500; break below may lead to **24,400–24,300**
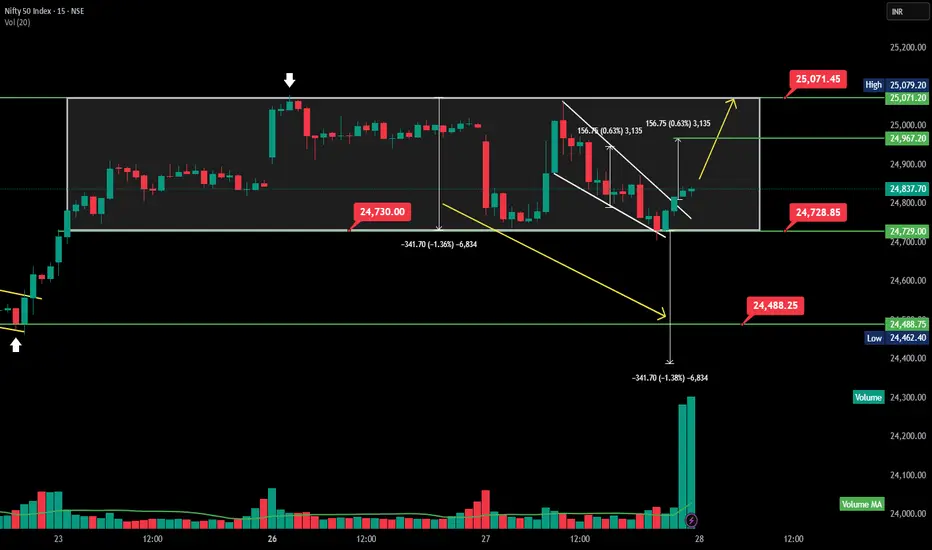
15-min intraday chart of Nifty 50 rectangle consolidation This is a **15-min intraday chart of Nifty 50 Index**, showing a **channel and retest**, followed by a potential **pullback setup** within a rectangle consolidation range.
---
### 📊 **Nifty 50 – Intraday Breakdown & Range Play Analysis**
#### 🔍 Chart Breakdown:
* **Range-bound Movement** between:
📌 Resistance: **25,071.45**
📌 Support: **24,730.00**
* **Breakdown from Rectangle:** Price fell sharply from range top to bottom, testing support at **24,730.00**.
* ** Flag Formation:** After the drop, price formed a flag pattern and gave break out for target - 24967.
* **Measured Move Target:**
Height of rectangle range = \~**342 pts**
📉 Breakdown target: **\~24,488**
📈 Rebound target (if breakout sustains) test top resistance: **\~25,071**
#### 🔄 **Scenario Outlook:**
* 🔼 **Bullish : can test 24,967 for move towards **25,071**
* 🔽 **Bearish below:** 24,728 — breakdown confirmation towards **24,488**
#### 📈 Volume Spike:
* Recent big green volume candle suggests accumulation or short covering.
---
Would you like a YouTube post setup for this intraday chart too?
Nifty50 Chart Analysis | Watch 25026 & 24937 | Breakout or Dowwn📊 Nifty 50 Update | Key Levels to Watch! (May 27, 2025)
🚨 Technical Analysis:
Nifty 50 has formed a range after a sharp up move. We are currently seeing a consolidation between 24,937 and 25,026.
📌 Scenarios:
Bullish Breakout above 25,026 ➤ Target: 25,119
Bearish Breakdown below 24,937 ➤ Target: 24,841
Both movements are based on the range height of ~90 points, in line with the breakout structure from the previous pole-and-flag pattern.
🟢 Keep an eye on volume confirmation at the breakout/breakdown levels.
⚠️ Disclaimer:
This video is for educational and informational purposes only. I am not a SEBI-registered advisor. Please consult with your financial advisor before making any trading decisions.

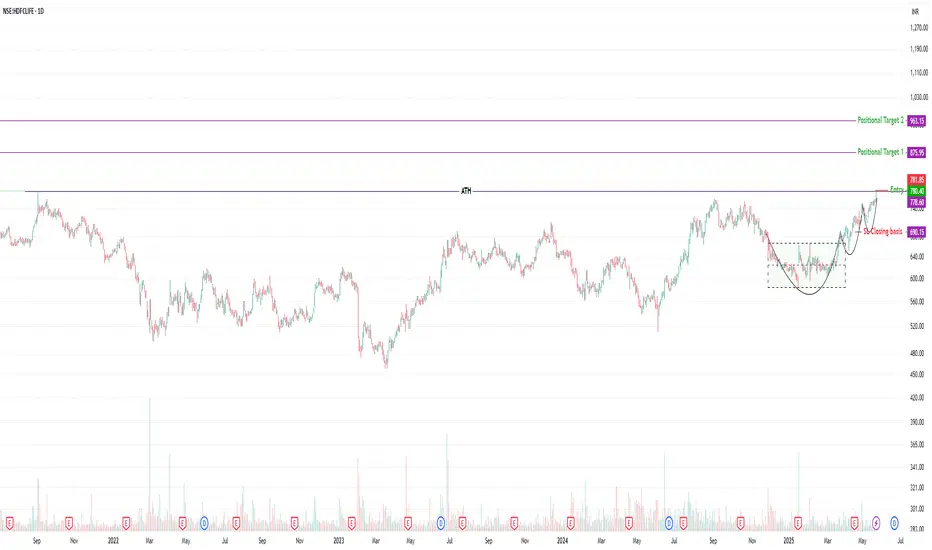
HDFC LIFE – VCP Breakout Setup | ATH ZoneHDFC LIFE – VCP Breakout Attempt | ATH Test After 44 Months
📈 Structure: Volatility Contraction Pattern (VCP)
📦 Base: Tight consolidation zone (rectangle)
📊 Trend: Higher Highs & Higher Lows
🟢 Volume: Gradually picking up
💥 Last Session: Wide range bullish candle
🔝 ATH Zone: Testing Sep 2021 high (44-month range)
📌 Price Action: Trading above Key DMAs
The stock formed a clean VCP structure with tight contractions and shallow pullbacks. It broke out from its recent base and is now testing the all-time high from Sep 2021, making this a high-stakes breakout watch.
Currently, it’s forming a breakout setup with entry above the previous day’s close — ideally confirming with more volume above ₹790.
📍 Trade Plan
Entry: 781.85
Stop Loss (Close Basis): 690.15
Target 1: 875.95
Target 2: 963.15
📊 Risk & Reward
Risk: 11.75%
Target 1: 12.02%
Target 2: 23.18%
RR to T1: 1 : 1.02
RR to T2: 1 : 1.97
⚠️ Risk Management Notes
Even though the structure is clean and momentum is building, risk remains high as the stock is trading at ATH levels — a zone where volatility can spike.
Always remember:
Protect capital first — never let a single trade ruin your portfolio
If it fails to hold above the breakout zone, pullbacks can be sharp
Don’t ignore market breadth and macro sentiment
Trade only with proper position sizing and SL discipline. If the breakout sustains with strength, this could enter a strong trend — but risk-reward must justify the trade.
📌 This is not a buy/sell recommendation. Just a technical view for educational purposes.
Nifty50 Intraday Setup – BO Above 24,905 or BD Below 24820Technical analysis of Nifty for 26th May - Summary with both breakout and breakdown scenarios
---
### 📊 **Nifty 50 (15-Min Chart) – Flag & Pole Pattern Analysis**
**Pattern**: Bullish Flag & Pole
**Pole Height**: \~442 pts
**Flag Range**: ₹24,820 – ₹24,905
---
### ✅ **Scenario 1: Breakout**
* **Breakout Above**: ₹24,905
* **Target**: ₹24,991
* **Stop Loss**: ₹24,905
* **Comment**: Valid **flag & pole continuation** only if price sustains above ₹24,905 with volume.
---
### ❌ **Scenario 2: Breakdown**
* **Breakdown Below**: ₹24,820
* **Target**: ₹24,735
* **Stop Loss**: ₹24,820
* **Comment**: Failure to hold the flag’s lower range can trigger a short-term **bearish move**.
---
📌 **Note**: Wait for **a decisive candle close** and **volume confirmation** above or below key levels before taking a position.
---

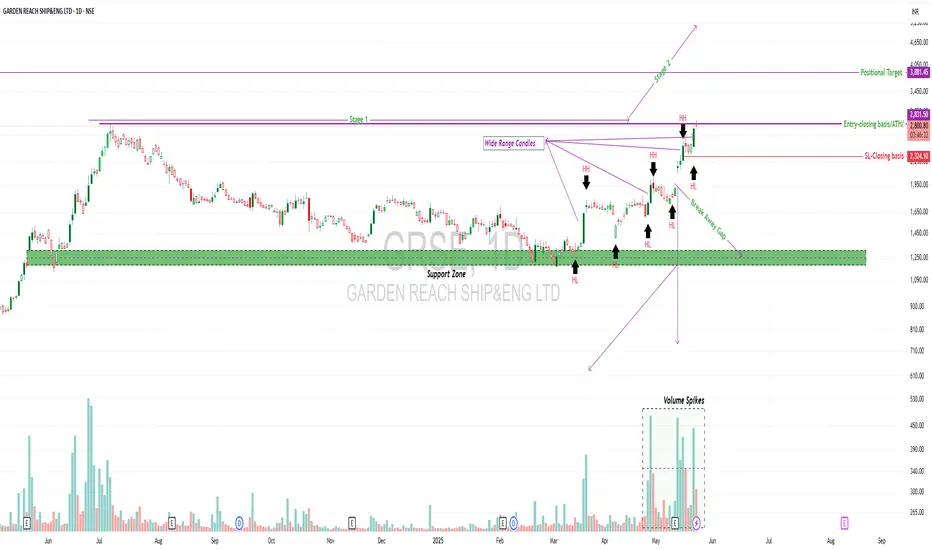
GRSE – Stage 2 Breakout WatchGRSE – Stage 2 Breakout Watch 🚢📈
CMP: ₹2,816
Structure: HH-HL forming | Wide Range Candles | ATH Zone
Stage: Transitioning from Stage 1 to potential Stage 2
Support Zone: ₹1,200–1,300
Breakout Trigger: ₹2,851+ (All-Time High zone)
🧠 Technical View
GRSE is attempting a breakout from a long consolidation base of nearly a year. The structure has turned constructive:
✅ Trading above all key DMAs
✅ Forming Higher Highs & Higher Lows
✅ Wide-range candles on upmoves, shallow pullbacks
✅ Breakaway gap followed by volume spikes
✅ Currently at All-Time High — part of a 1-year trading range breakout attempt
A clean close above ₹2,851 with volume could trigger a Stage 2 breakout, potentially unlocking a new leg of momentum.
📦 Entry Strategy
Add 50% exposure around current levels if comfortable with risk
Wait for retest of breakout zone for additional entry
Stop Loss (Closing Basis): ₹2,324.10
Target Zone: ₹3,880+ (measured move, continuation projection)
🎯 Risk : Reward
Entry: ₹2,816
Stop Loss: ₹2,324.10 → Risk: ~17.45%
Target: ₹3,881.45 → Reward: ~37.83%
📊 Risk : Reward = 1 : 2.17
Clean breakout setup with nearly 2x reward potential compared to the risk — solid structure for swing positioning.
🔍 Fundamentals Snapshot
Market Cap: ₹32,252 Cr
ROCE: 37.3% | ROE: 28.1%
Stock P/E: 61.1 (valuations are not cheap — price strength needs to sustain)
Dividend Yield: 0.33%
Excellent capital efficiency metrics, but don’t over-leverage based on fundamentals alone. Structure > Story.
📈 Sector Outlook + Market Conditions
The defence sector remains in focus, and GRSE is riding that thematic tailwind. However, overall market breadth remains weak, so expect pullbacks. Watch how price behaves during corrections — they could present opportunity if structure holds.
🛡️ Risk Management Notes
Don’t overcommit on a breakout — market volatility can fake moves.
Keep SL tight and re-enter if the structure continues
Trailing stop recommended post-breakout retest
⚠️ Disclaimer
I’m not a SEBI-registered advisor. This content is for educational purposes only. Please do your own research and manage risk based on your financial goals and position sizing strategy.
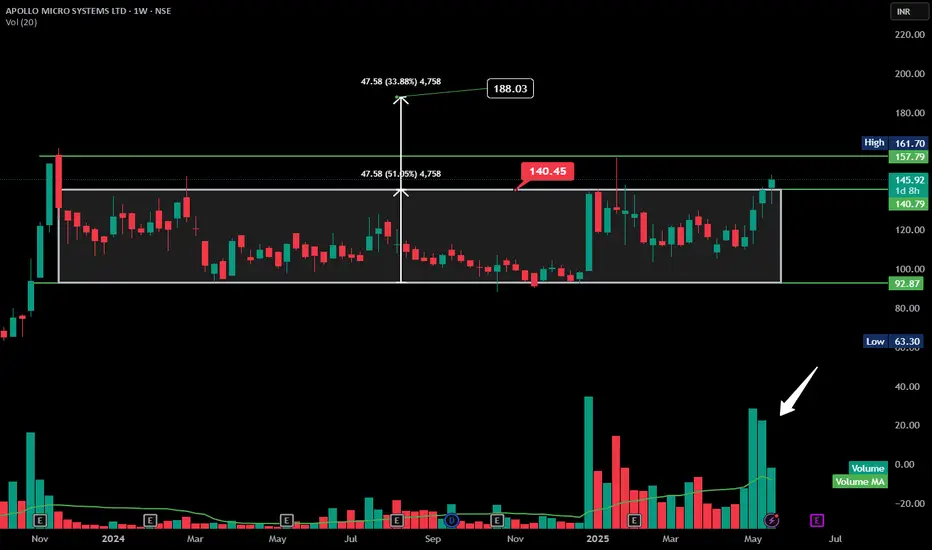
APOLLO rectangular consolidation Breakout - Good volumeHere’s a **technical analysis summary for APOLLO MICRO SYSTEMS LTD** based on the chart you provided:
---
### 📊 **APOLLO MICRO SYSTEMS LTD – Weekly Chart Summary**
* **Trend:** ✅ **Breakout Confirmed**
* Price has broken out above the rectangular consolidation zone after nearly a year of sideways movement.
* **Breakout Zone:**
* Resistance broken: **₹140.45**
* Consolidation range: ₹92.87 to ₹140.45
* **Target Projection (based on rectangle height):**
* Rectangle height = ₹47.58
* Projected Target = ₹140.45 + ₹47.58 = **₹188.03**
* **Current Price:** ₹145.92 (as of last weekly candle)
* **Volume Analysis:** 🔼
* Recent volume spikes confirm breakout strength.
* Volume > average, indicating institutional interest.
* **Support Levels:** * Lower: ₹92.87 (bottom of range)
---
### 📌 **Technical View:**
**Bullish outlook.** The breakout from a long accumulation phase with strong volume is a classic bullish signal. Price may face resistance around ₹157.79 and ₹161.70, but overall sentiment favors upside towards ₹188.
---
Gabriel India -Double Bottom Breakout!📊 Gabriel India - Positional Breakout Trade
🔍 Technical Overview:
✅ Trend: Strong uptrend, followed by a 32% correction and a double bottom formation .
✅ Breakout Confirmation: Cleared ₹565 resistance with strong volume.
✅ Key Levels:
Entry: Above ₹600 (Earlier breakout was at ₹565)
Stop Loss: ₹475 (Closing basis) 🔻
Positional Target: ₹824 (Tentative) 🎯
✅ Moving Averages: Trading above key DMAs, indicating strength.
✅ Market Condition: Stock is breaking out early as markets show signs of recovery.
⚠ Risk Management & Position Sizing:
Risk per trade: More than 20%, so position sizing is 🔑.
Recommended Approach:
Enter 25% now and accumulate on retest.
Do NOT go all-in – respect SL at all costs! 🚨
Current market structure: Still in LL-LH (Lower Low - Lower High). This could be a counter-trend pullback or a bull trap—stay cautious.
📈 Fundamental Overview:
Market Cap: ₹8,463 Cr
Current Price: ₹589
52W High/Low: ₹598 / ₹326
P/E Ratio: 40.2
Book Value: ₹74.9
Dividend Yield: 0.68%
ROCE: 26.7%
ROE: 19.6%
Debt-Free Company 💰
Sales, EPS, and Profits improving YoY 📈
🛑 Final Thoughts:
Market concerns still exist—we don’t know if this is the bottom or a reversal yet.
Control FOMO! Watch for market confirmation before adding aggressively.
If you struggle with risk management, sit on the sidelines—waiting is also a trade.
⚠ Disclaimer:
This is NOT financial advice. Trade at your own risk and follow your own risk management rules. 📉📈
