Info Edge Cmp 5761 dated 24.8.2021Info Edge Cmp 5761 dated 24.8.2021
1. Ascending Triangle Pattern BO @ 5660.
2. Rectangle BO 5660.
Buy for a tgt of 5880-6380 SL 5650
It is just a view, pls trade at your own risk.
Rectangle

Muthoot Finance Cmp 1503 dated 24.8.2021Muthoot Finance Cmp 1503 dated 24.8.2021
1. Rectangle support @ 1440.
2. RSI Divergence.
Buy for a tgt of 1530-1565-1615 SL 1465
It is just a view, pls trade at your own risk.

ASIANTILES - RectangleRectangle forming on 4H Chart of ASIAN TILES. BUY CMP/193.10 -> 205, 220, 235, 260 Support 182-83, 175-73. I'm learning chart patterns as of now. You can plan your trades accordingly if you know how to trade these patterns.

ADVANCED ENZYMES - RectangleRectangle forming on 3H Chart of ADVANCED ENZYMES. BUY CMP -> 450, 465-70, 480, 490 Support 418, 410, 405, 400, 395-6. I'm learning chart patterns as of now. You can plan your trades accordingly if you know how to trade these patterns.


KPIT Tech Cmp 357 dated 17.8.2021KPIT Tech Cmp 357 dated 17.8.2021
1. Rectangle Pattern BO @ 362
2. Rise in Volume.
Buy for a tgt of 440 SL 315
It is just a view, pls trade at your own risk.

TATAELXISgiven a good break out after a consolidation and there is nice price
volume expansion.if the stock takes support at 4484 it will be my entry
and stoploss is 4094

EID PARRY LTD1️⃣continuous repetition of the same pattern indicated by 1st ,2nd and 3rd step
2️⃣ With the goverment focus on sugar sector for ethanol blending , given chart could repeat the history with probably 4th step🤞

Tata Consumer Cmp 833 dated 17.8.2021Tata Consumer Cmp 833 dated 17.8.2021
1. REctangle Pattern BO @ 830.
Buy for a tgt of 935 SL 785
It is just a view, pls trade at your own risk.

LTI RANGE BREAKOUT DONE. SWING TRADE OPPORTUNITY.Price Consolidated almost 6-7month long time in a Rectangular Pattern Range..
Nice Breakout done of the range with Volume Support.
SWING TRADE OPPORTUNITY
BUY @ 4700 FOR TGT 5200-5700+ WITH STRICT SL @ 4200
LLong

ABCAPITAL NICE MOMENTUM BUILDING UP WITH HUGE VOLUME TOO.Price Consolidated long time, Now Momentum building up with huge volume support too.
All the important levels mentioned on the chart
SWING TRADE OPPORTUNITY
BUY AROUND 120 WITH STRICT SL 110 FOR TGT - 130, 140, 150, 160+

reliance : breakout candidate ( rectangle / triangle )reliance : 2108
highlights:
trade setup :
1. buy above 2133
2. keep stop loss as 2082 on closing basis
3. targets 2153/2207/2245/2280+++
technical buy based on :
1. rectangle
2. triangle
3. breakout concept
note :
stock trading in consolidation phase in a rectangle inside triangle pattern .
good base formation seen for a breakout above 2133 price levels.
higher lows / lowers highs candles are good indicators in a triangle pattern.
recent results are also good (Q ON Q) .
volume is dry in consolidation / correction.


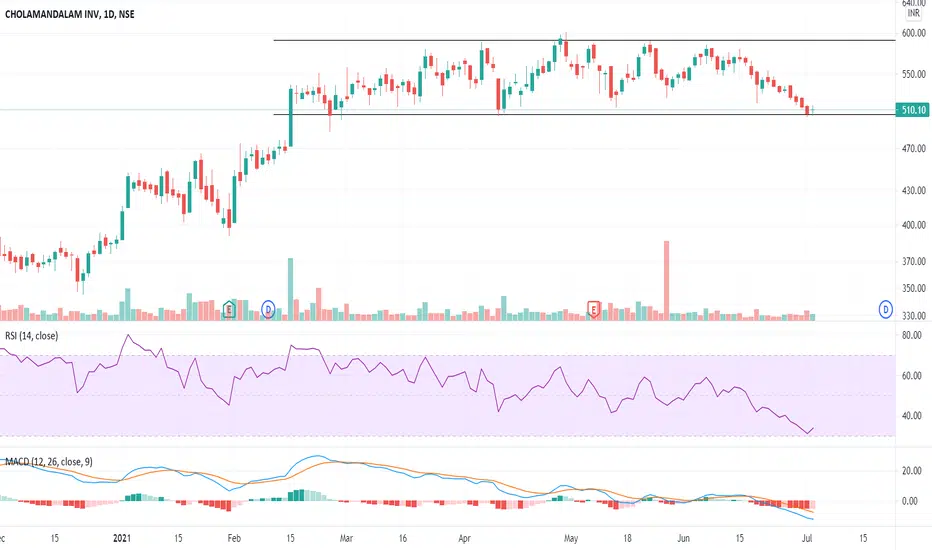
cholafin range bound,can expect 585 now currently at support and can see formation of doji
disclaimer- this is not any investment call or idea , this just my view and it can go wrong ,this is only for educational purposes trade at your own risk
l & T might turnaround this one also range bound L & T has already corrected we see an doji forming at support which indicates from here on it may be +ve
can buy at current price and sell at resistance
and further i am expecting infra sector to perform well so as i know good infra company is l & t
range bound stocks are good for swing trades or short term trades must use daily + 15 min time frame combined
disclaimer- this is not any investment call or idea , this just my view and it can go wrong ,this is only for educational purposes trade at your own risk

hcl tech range bound good to buy at 900-925hcl tech is moving in side ways good to accumulate and we can expect recatangular break out in the long run
900 and below is best price for hcl tech its like fair price
disclaimer- this is not any investment call or idea , this just my view and it can go wrong ,this is only for educational purposes trade at your own risk

Bata Cmp 1676 dated 9.8.2021Bata Cmp 1676 dated 9.8.2021
1. Trendline Resistance @ 1695.
2. Rectangle BO @ 1695
Buy above 1680 for a tgt of 1730-1760-1800-1840
SL 1635
It is just a view, pls trade at your own risk.

Just Dial Cmp 973 dated 9.8.2021Just Dial Cmp 973 dated 9.8.2021
1. Rectangle BO @ 985
Buy above 985 for a tgt of 1025-1050-1070 SL 945
It is just a view, pls trade at your own risk.

symmetrical triangle breakout trade!waterbase : 124
trade setup:
1. buy above 128
2. keep stop loss as 111 on closing basis
3. targets 145/164+
key technical highlights :
1. symmetrical triangle
2. rectangle
3. breakout concept .
note :
stock price trading in compression zone .
any time breakout expected .
dry volume during price correction / consolidation .
& good volume seen in previous bullish patterns
WLong

GREENLAM NICE BREAKOUT HAPPENING WITH HUGE VOLUME. SWING TRADEAs u see on chart nice and clean price action going on in this stock. Resistance turning as support.
keep eye on this as nice breakout happening with a huge volume
SWING TRADE OPPORTUNITY
BUY ABAOVE 1450+ FOR TGT - 1650+ WITH STRICT SL 1330


Swing trade∘ Bank sector moves Improving to Leading ( RRG )
∘ Strong Resistance over here multiple times taking Rejection
Note : Always be extra cautious with breakout trade with confirmation .

