Manappuram Fin (W): Bullish - Coiling at ResistanceTimeframe: Weekly | Scale: Logarithmic
The stock is challenging the upper end of its 3-month consolidation zone. The setup is a classic "Volatility Contraction" right below the All-Time High, supported by recent institutional accumulation and sector-wide tailwinds.
🚀 1. The Fundamental Catalyst (The "Why")
The stock is pushing resistance due to two key drivers:
> Liquidity Boost (Dec 15): The company successfully raised ₹500 Crore via Non-Convertible Debentures (NCDs), ensuring strong capital adequacy for growth.
> Sector Spillover: The massive deal in peer Shriram Finance (MUFG stake buy) has triggered a re-rating of the entire NBFC sector, lifting sentiment for gold loan players like Manappuram.
📈 2. The Chart Structure (Rectangular Base)
> The Box: The ₹262 – ₹295 trading range.
- Significance: The stock has spent 3 months absorbing supply in this zone.
> The "Knock" at the Door: The stock closed the week at ₹292.65 , just ~1.8% away from the ATH of ₹298 .
- Price Action: Closures near the high of the week indicate that buyers are willing to hold positions over the weekend, a bullish sign.
📊 3. Volume & Indicators
> Volume Analysis (Correction): While the breakout volume hasn't happened yet, the internal volume shows accumulation. High-volume spikes on Dec 12 (21M) and Dec 16 (12M) suggest institutions bought the dip, while the pullback days had lower volume. This confirms a healthy accumulation pattern .
> EMAs & RSI: Rising RSI and Positive Crossover on EMAs confirm the momentum is aligned to the upside.
🎯 4. Future Scenarios & Key Levels
The stock is primed for a "Blue Sky" breakout.
> 🐂 Bullish Breakout (The Trigger):
- Condition: A decisive Daily Close above ₹298 .
- Target 1: ₹325 .
- Target 2: ₹340 .
> 🛡️ Support (The Safety Net):
- Immediate Support: ₹275 – ₹280 . If the breakout fails, the stock will likely drift back to the middle of the box.
- Stop Loss: A close below ₹262 would invalidate the bullish thesis.
Conclusion
This is a High-Probability Setup . The "Accumulation Spikes" inside the range suggest the breakout is legitimate.
> Strategy: Watch for a high-volume move past ₹298 . The sector tailwinds make this a strong candidate for a new leg up.
Rectanglebreak

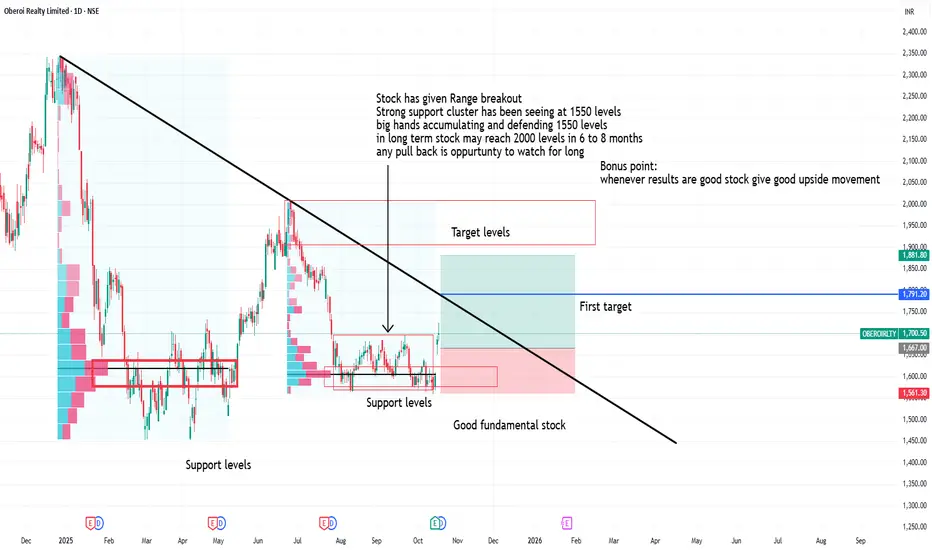
Oberoi reality range breakoutStock has given Range breakout
Strong support cluster has been seeing at 1550 levels
big hands accumulating and defending 1550 levels
in long term stock may reach 2000 levels in 6 to 8 months
any pull back is oppurtunty to watch for long
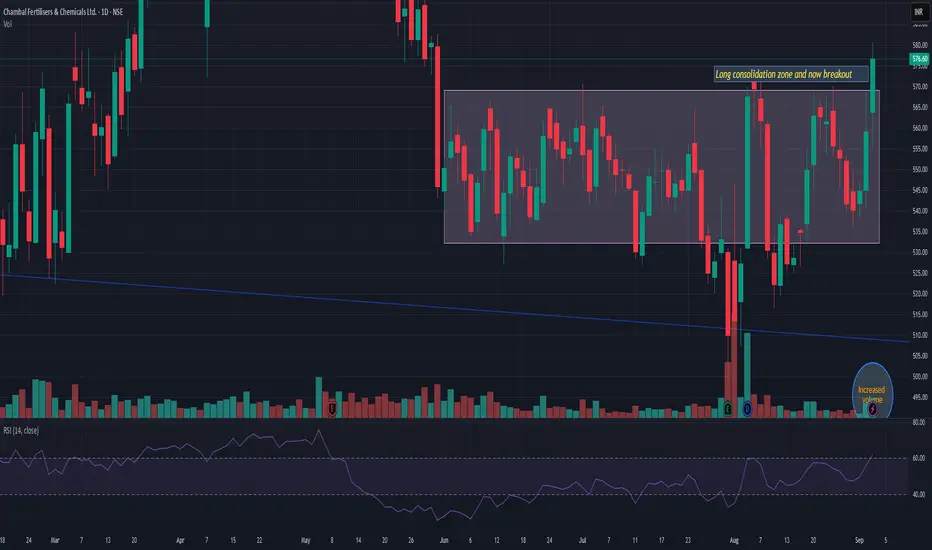
CHAMBLFERT CHAMBLFERT is giving rectangle breakout with decent volume. Stock is in consolidation zone since 1 quarter. Near term support is near 552. Next resistance seems to be near 635/666. Keep it watchlist.
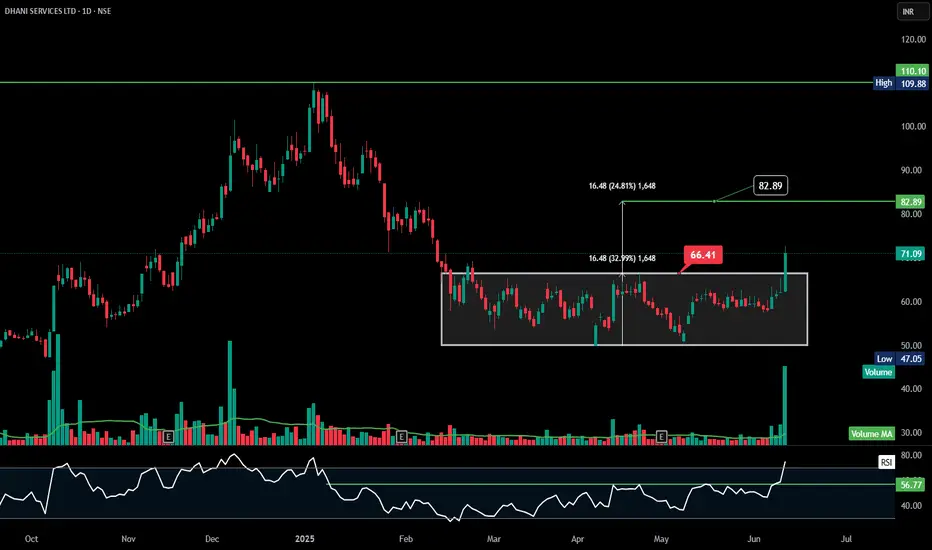
DHANI |Rectangle Consolidation Breakout | Daily
---
### 📈 **Breakout Overview:**
✅ **Rectangle Consolidation Breakout**
* **Consolidation Range:** ₹49.85 to ₹66.41
* **Breakout above:** ₹66.41
* **Current price:** ₹71.09 (+14.42% move today!)
* **Target projection:** ₹82.89–85 zone (based on rectangle height projection).
---
### 📊 **Key Chart Signals:**
* **Volume Surge:** Big spike in volume confirms breakout strength.
* **RSI:** RSI above 70 (around 80) signals strong momentum.
* **Rectangle height move:** Rectangle height (\~₹16.48) added to breakout level projects target around ₹82.89–85.
---
### 🔍 **What’s Next?**
* If the breakout sustains above ₹66.41, momentum likely to push price towards ₹82.89–85.
* Monitor for potential retest of the breakout zone (₹66–67) which would act as support.
* RSI being overbought (\~80) suggests possible minor pullback or consolidation before moving higher.
---
### 💡 **Key Takeaway:**
DHANI has **successfully broken out** of a long consolidation zone, with **volume and momentum** supporting further upside towards **₹82.89–85**.
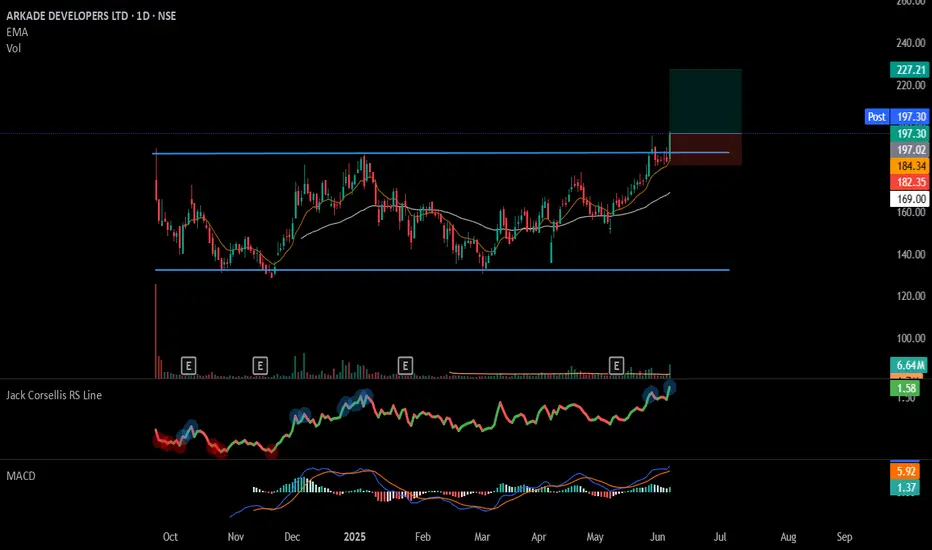
#ARKADE - IPO Base Breakout📊 Script: ARKADE
Key highlights: 💡⚡
📈 IPO Base Breakout in Daily Time Frame.
📈 Price consolidating near Resistance, then Breakout.
📈 Volume spike seen during Breakout.
📈 MACD Cross
📈 Can go for a swing trade
BUY ONLY ABOVE 197 DCB
⏱️ C.M.P 📑💰- 197.34
🟢 Target 🎯🏆 – 14%
⚠️ Stoploss ☠️🚫 – 7%
⚠️ Important: Market conditions are Okish, Position size 50% per Trade. Protect Capital Always
⚠️ Important: Always Exit the trade before any Event.
⚠️ Important: Always maintain your Risk:Reward Ratio as 1:2, with this RR, you only need a 33% win rate to Breakeven.
✅Like and follow to never miss a new idea!✅
Disclaimer: I am not SEBI Registered Advisor. My posts are purely for training and educational purposes.
Eat🍜 Sleep😴 TradingView📈 Repeat 🔁
Happy learning with MMT. Cheers!🥂
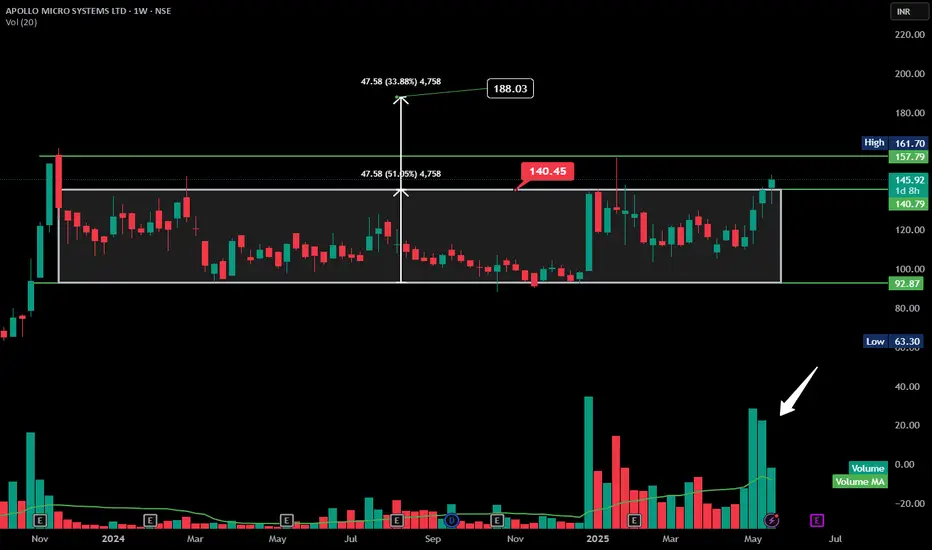
APOLLO rectangular consolidation Breakout - Good volumeHere’s a **technical analysis summary for APOLLO MICRO SYSTEMS LTD** based on the chart you provided:
---
### 📊 **APOLLO MICRO SYSTEMS LTD – Weekly Chart Summary**
* **Trend:** ✅ **Breakout Confirmed**
* Price has broken out above the rectangular consolidation zone after nearly a year of sideways movement.
* **Breakout Zone:**
* Resistance broken: **₹140.45**
* Consolidation range: ₹92.87 to ₹140.45
* **Target Projection (based on rectangle height):**
* Rectangle height = ₹47.58
* Projected Target = ₹140.45 + ₹47.58 = **₹188.03**
* **Current Price:** ₹145.92 (as of last weekly candle)
* **Volume Analysis:** 🔼
* Recent volume spikes confirm breakout strength.
* Volume > average, indicating institutional interest.
* **Support Levels:** * Lower: ₹92.87 (bottom of range)
---
### 📌 **Technical View:**
**Bullish outlook.** The breakout from a long accumulation phase with strong volume is a classic bullish signal. Price may face resistance around ₹157.79 and ₹161.70, but overall sentiment favors upside towards ₹188.
---
GODREJPROP - Rectangle -BO -DailyGodrej Properties Ltd (GODREJPROP) has recently released its Q4 FY25 results, revealing a mixed performance.
📊 Financial Highlights (Q4 FY25)
Net Profit: Declined by 19% year-on-year to ₹382 crore, compared to ₹471 crore in Q4 FY24.
Revenue: Increased by 49% year-on-year to ₹2,122 crore.
EBITDA: Slightly decreased by 2% to ₹634 crore.
Expenses: Overall expenses rose by 54%, primarily due to increased material consumption costs.
Bookings: Achieved record-high quarterly bookings of ₹10,163 crore, marking a 7% year-on-year increase.
FY26 Guidance: The company anticipates new bookings of ₹32,500 crore for FY26, slightly lower than FY25 projections.
Market Cap: Approximately ₹65,011 crore.
P/E Ratio (TTM): 43.66.
P/B Ratio: 3.86.
Debt-to-Equity Ratio: 1.25.
The chart **Godrej Properties Ltd (GODREJPROP)** shows a **bullish breakout** from a **rectangle base consolidation pattern**, suggesting a potential uptrend continuation. Here's the technical breakdown:
---
### 🧠 **Chart Pattern Analysis**
- **Pattern:** Rectangle base (accumulation zone) between ~₹1,900 and ~₹2,212
- **Breakout Level:** ₹2,212.50 (horizontal resistance)
- **Breakout Candle:** Strong bullish candle with volume spike (confirmation)
- **Target Projection:**
- Rectangle height: ₹2,212.50 - ₹1,900 ≈ ₹312.50
- Target: ₹2,212.50 + ₹312.50 = **₹2,525** (matches chart projection)
---
### 📌 **Key Levels**
- **Immediate Resistance:** ₹2,249.30 (current price), next at ₹2,525.55
- **Immediate Support:** ₹2,212.50 (breakout level), then ₹1,901.50
- **52-Week High:** ₹3,387.10 (far resistance)
---
### 📊 **Volume Confirmation**
- Noticeable volume spike on the breakout candle.
- Volume > 20-period moving average volume — supports breakout strength.
---
### 🧭 **Outlook**
- **Bullish bias** in the short to medium term.
- A sustained close above ₹2,212.50 with increasing volume favors the target move toward ₹2,525+.
- If price re-tests the breakout zone and holds (₹2,212 area), it would be a healthy sign of support.
---

Could Pokarna help you attain Nirvana ?After a long uptrend and in spite of the recent correction that we experienced this stock held its ground consolidated sideways holding on to its very strong support.
Although the targets here seem to be quite high, the overall markets are a little uncertain. Hence, we take small steps forward and then start trailing the Stoploss as and when it climbs.
Fantastic pattern and rectangle breakout seems evident. Enter only on Daily Closing Basis confirmation

RECTANGLE BREAKOUT KIRLOSKAR Again entered at 1650 level
Stop loss at: 1550 - 100 point stop loss.
Expecting 4R return in this trade.
Refer the following idea.

Chola fin will rate cut be an advantage to it TGT1600++Technical aspects can read on chart itself
Rate cut might be an advantage to cholafin
disclaimer- this is not any investment call or idea , this just my view and it can go wrong ,this is only for educational purposes trade at your own risk

POWERMECH Swing IdeaPOWERMECH broke out of parellel channel with weekly close confirmation.
Target of rectangle rpattern is given in chart. It may reach longterm uptrend channel upper line in coming days.
Need to plan trade accordingly with risk management.

JYOTHY LABS - Swing Trade Analysis - 3rd July #stocksJYOTHY LABS (1W TF) - Swing Trade Analysis given on 3rd July, 2024
Pattern: RECTANGLE BOX BREAKOUT
- Weekly Resistance Breakout - Done ✓
- Weekly Volume Buildup at Resistance - Done ✓
- Demand Zone Retest & Consolidation (for a small SL and a better RR) - In Progress
* Disclaimer

ADSL - BREAKOUT AND A 2X CANDIDATE BASED ON FUNDAMENTALSHi All,
This idea is about Allied Digital Services Ltd
Mkt Cap - 1204 Cr
Stock PE - 26
Mcap/Sales - 1.75
As per mgmt concal transcript, revenue guidance of 1000Cr in FY25/26
Assuming NPM at 8%, this could take the mktcap to 2200Cr easily which wud appreciate the stock price towards levels of 400
Technically also its a healthy breakout with expanding Moving averages after tight consolidation. Volume is extremely good to support further price action
Happy Trading,
Thanks,
Stock-n-Shine

WELCORP - CLEAN BREAKOUT OUT OF DARVAS BOXHi All,
This idea is about Welspun Corp Ltd
FUNDAMENTALS
Mkt Cap - 17161 Cr
Mkt Cap/Sales - 0.99
P/E - 15.5
P/BV - 3
FCF - 1022 Cr
D/E - 0.35
Promoter increase thr stake by 0.18%
ROE - 21%
ROCE - 21.6%
Technicals
Price has been consolidating within a range of 25% and has now given a decisive breakout above the supply zone. There was a mid resistance as well which was broken with good volumes
Hope you have a profitable trade,
Thanks,
Stock-n-Shine

PRAJ INDUSTRIES - Swing Trade Analysis - 9th June #stocksPRAJ INDUSTRIES (1D TF) - Swing Trade Analysis given on 9th June, 2024
Pattern: RECTANGLE BOX BREAKOUT
- Resistance Breakout - Done ✓
- Volume Buildup at Resistance - Done ✓
- Demand Zone Retest & Consolidation - In Progress
* Disclaimer

RAILTEL - Swing Trade Analysis - 23rd June #stocksRAILTEL CORPORATION OF INDIA (1W TF) - Swing Trade Analysis given on 23rd June, 2024
Pattern: RECTANGLE BOX BREAKOUT
- Weekly Resistance Breakout - Done ✓
- Weekly Volume Buildup at Resistance - Done ✓
- Demand Zone Retest & Consolidation - In Progress
* Disclaimer

METRO BRANDS - Swing Trade Analysis - 18th June #stocksMETRO BRANDS (1D TF) - Swing Trade Analysis given on 18th June, 2024
Pattern: RECTANGLE BOX BREAKOUT
- Resistance Breakout - Done ✓
- Volume Buildup at Resistance - Done ✓
- Demand Zone Retest & Consolidation - In Progress
* Disclaimer

MAHANAGAR GAS - Swing Trade Analysis - 30th June #stocksMAHANAGAR GAS LTD (1W TF) - Swing Trade Analysis given on 30th June, 2024
Pattern: RECTANGLE BOX BREAKOUT
- Weekly Resistance Breakout - Done ✓
- Weekly Volume Buildup at Resistance - Done ✓
- Demand Zone Retest & Consolidation (for a small SL and a better RR) - In Progress
* Disclaimer

JINDAL STAINLESS - Swing Trade Analysis - 25th May #stocksJINDAL STAINLESS (1D TF) - Swing Trade Analysis given on 24th May, 2024
Pattern: RECTANGLE BOX
- Volume Buildup at Resistance- Done ✓
- Resistance Breakout - In Progress
- Demand Zone Retest & Consolidation - In Progress
* Disclaimer

USHA MARTIN - Swing Trade Analysis - 1st May #stocksUSHA MARTIN (1W TF) - Swing Trade Analysis given on 1st May, 2024
Pattern: RECTANGLE BOX BREAKOUT
- Weekly Resistance Breakout - Done ✓
- Volume Buildup at Resistance - Done ✓
- Demand Zone Retest & Consolidation - In Progress
* Disclaimer

ESCORTS - Swing Trade Analysis - 20th April #stocksESCORTS (1W TF) - Swing Trade Analysis given on 20th April, 2024
Pattern: RECTANGLE BOX BREAKOUT
- Resistance Breakout - Done ✓
- Volume Buildup at Resistance - Done ✓
- Demand Zone Retest & Consolidation - In Progress
* Disclaimer
#ESCORTS

CHAMBAL FERTILISERS - Swing Trade - 10th March #stocksCHAMBAL FERTILISERS (1D TF) - Swing Trade Analysis given on 10th March, 2024
Pattern: RECTANGLE BOX
- Volume buildup at Resistance - Done ✓
- Resistance Breakout - In Progress
- Demand Zone Retest & Consolidation - In Progress
#chambalfert

CASTROL INDIA - Swing Trade Analysis - 10th April, 2024CASTROL INDIA (1D TF) - Swing Trade Analysis given on 10th April, 2024
Pattern: RECTANGLE BOX BREAKOUT
- Volume buildup at Resistance - Done ✓
- Resistance Breakout - Done ✓
- Wait for Demand Zone Retest & Consolidation - In Progress
* Disclaimer
