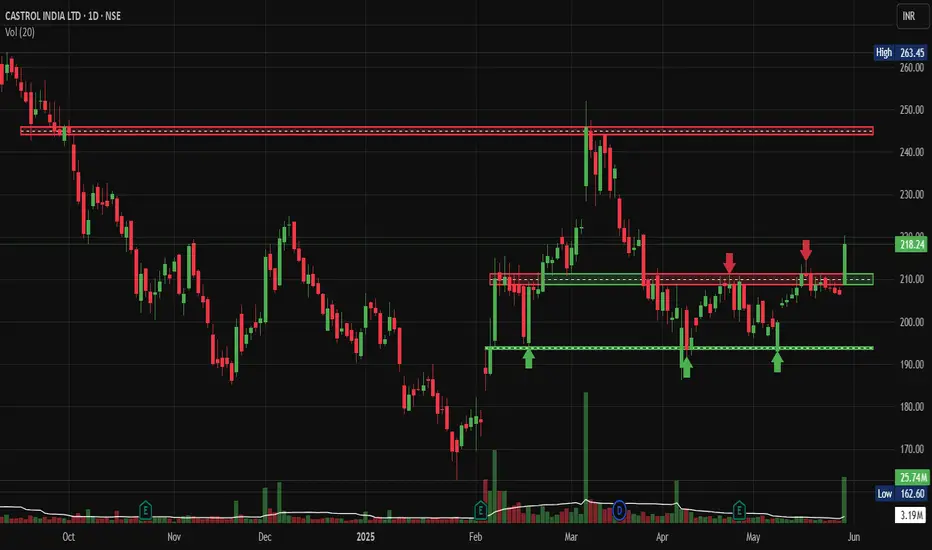
Castrol: Lubricant Oil Giant's Ends Consolidation PhaseNSE:CASTROLIND : Lubricant Oil Giant's Consolidation Phase Offers Strategic Entry Opportunity
Looking at NSE:CASTROLIND chart on the Daily Timeframe, the stock presents a compelling technical setup after months of consolidation following a significant decline from its October 2024 highs.
Price Action Analysis:
NSE:CASTROLIND has been trading in a well-defined range between ₹190-195 support and ₹210-215 resistance since February 2025. The stock peaked around ₹245-250 in October 2024 before experiencing a sharp correction that bottomed out near ₹162 in January. Since then, it has established a solid base above the ₹190 level with multiple successful retests.
The recent price action shows the stock consolidating around ₹208-210, with the current price at ₹208.70 representing a modest gain of 5.66%. This positioning near the upper end of the trading range suggests potential for a breakout attempt.
Volume Analysis:
Volume patterns reveal interesting insights - the chart shows several volume spikes that coincided with key support tests and bounce attempts. The volume of 25.74M against a 20-day average suggests active participation, though not at extreme levels. The volume profile indicates accumulation phases during dips below ₹200, which is constructive for future upward movement.
Key Support and Resistance Levels:
Key support levels are clearly defined at ₹190-195, , which have held multiple times since February. Secondary support exists around ₹180-185. On the upside, immediate resistance sits at ₹210-215 , followed by the more significant ₹230-235 zone . A break above ₹215 would target the previous consolidation high around ₹245.
Technical Pattern:
The stock is forming a classic rectangular consolidation pattern, also known as a trading range. This pattern typically resolves with a breakout in the direction of the prior trend, though given the extended decline from October highs, a base-building scenario appears more likely. The multiple retests of support without breaking down suggest a strong institutional interest at lower levels.
Trade Setup:
Entry Strategy: Consider accumulating on dips toward ₹195-200 or on a confirmed breakout above ₹215 with volume confirmation.
Entry Levels: ₹195-200 (value entry) or ₹216+ (momentum entry)
Target 1: ₹225-230
Target 2: ₹240-245
Target 3: ₹255-260
Stop Loss: Below ₹185 for medium-term positions
Risk-Reward: Approximately 1:2.5 from current levels
Sectoral and Fundamental Backdrop:
The lubricants sector has been facing headwinds from the transition to electric vehicles and longer oil change intervals in modern engines. However, Castrol benefits from its strong brand presence, extensive distribution network, and exposure to industrial lubricants. The company's parent, BP, provides technological advantages and global synergies.
Recent quarterly results have shown resilience despite volume pressures, with the company maintaining healthy margins through premiumization strategies. The automotive sector's recovery post-pandemic and increased industrial activity should support volume growth, though EV adoption remains a long-term concern.
India's infrastructure development and manufacturing push under various government initiatives provide tailwinds for industrial lubricant demand. Currency stability and crude oil price moderation also support margin profiles for lubricant companies.
The stock's valuation appears reasonable after the correction, trading below historical averages, which makes it attractive for patient investors willing to ride through the transition phase in the automotive industry.
Keep in the Watchlist.
NO RECO. For Buy/Sell.
📌Thank you for exploring my idea! I hope you found it valuable.
🙏FOLLOW for more
👍BOOST if you found it useful.
✍️COMMENT below with your views.
Meanwhile, check out my other stock ideas on the right side until this trade is activated. I would love your feedback.
Disclaimer: "I am not SEBI REGISTERED RESEARCH ANALYST AND INVESTMENT ADVISER."
This analysis is intended solely for informational and educational purposes and should not be interpreted as financial advice. It is advisable to consult a qualified financial advisor or conduct thorough research before making investment decisions.
Rectanglepatterns
ROTOROTO is showing good strength and currently trading above previous resistance line. It is in to consolidation phase. It seems like accumulation has been observed in recent sessions. Now as long as it is closing above 279 then ROTO is very strong and available at very good risk-reward. One may expect 12% to 21% in next rally once it comes from consolidation phase.

Dhani BO: Ready for Its Next Rally After 80% Correction?NSE:DHANI Breakout: Is This Med/Fin Tech Stock Ready for Its Next Rally After 80% Correction?
Price Action Overview:
- Stock has undergone a significant correction from highs of ₹109.88 to lows of ₹47.05, representing nearly a 57% decline
- Currently trading at ₹71.09 with recent bullish momentum showing +14.42% gains
- Price action suggests a potential bottoming process after prolonged consolidation
Volume Spread Analysis:
- Significant volume spikes observed during major price movements
- Recent breakout accompanied by above-average volume (4.22M vs average 30.03M)
- Volume concentration during earnings announcements (marked 'E' on the chart) indicates institutional participation
- Higher volume during recent uptick suggests renewed interest
Key Technical Levels:
Support Levels:
- Primary Support: ₹50-52 zone (previous consolidation area)
- Secondary Support: ₹47.05 (absolute low)
- Immediate Support: ₹62-65 (recent breakout zone)
Resistance Levels:
- Immediate Resistance: ₹82.71 (marked horizontal level)
- Major Resistance: ₹96.79-₹109.88 (previous highs zone)
- Intermediate Resistance: ₹75-78 (previous resistance turned support)
Base Formation:
- Extended consolidation base formed between ₹50-₹68 over 4-5 months
- Classic rectangle/range-bound pattern with multiple tests of support and resistance
- Recent breakout from the upper boundary of this base suggests the completion of the accumulation phase.
Technical Patterns:
- Descending triangle pattern from February to April 2025
- Internal Flag & Pole Breakout
- Recent breakout from the consolidation rectangle
- Potential inverse head and shoulders formation on smaller timeframes
- Rising volume during breakout confirms pattern validity
Trade Setup:
Entry Strategy:
- Primary Entry: ₹68-₹70 (on pullback to breakout level)
- Aggressive Entry: Current levels ₹71-₹72 (momentum play)
- Conservative Entry: ₹65-₹67 (retest of breakout zone)
Exit Levels:
- Target 1: ₹82-₹85 (immediate resistance zone) - Risk: Reward 1:2
- Target 2: ₹95-₹98 (major resistance area) - Risk: Reward 1:3.5
- Target 3: ₹110-₹115 (previous highs extension) - Risk: Reward 1:4.5
Stop Loss:
- Conservative Stop: ₹62 (below recent consolidation)
- Aggressive Stop: ₹58 (below key support cluster)
- Trailing Stop: Implement an 8-10% trailing stop after the first target achievement
Position Sizing:
- Risk per trade: Maximum 2% of portfolio
- Position size calculation: Portfolio value × 2% ÷ (Entry price - Stop loss)
- For ₹1,00,000 portfolio with ₹70 entry and ₹62 stop: Position size = ₹2,000 ÷ ₹8 = 250 shares
Risk Management:
- Maximum exposure to single stock: 5% of total portfolio
- Sector exposure limit: 15% to financial services
- Use of stop-loss orders mandatory
- Position review after every 10% move in either direction
- Risk-reward ratio minimum 1:2 for all trades
Sectoral Backdrop:
Fintech Sector Overview:
- Digital lending sector experiencing regulatory scrutiny, but long-term growth prospects intact
- Increasing digital adoption post-pandemic, supporting fintech growth
- RBI guidelines on digital lending create compliance costs but also barriers to entry
- Consolidation is expected in the sector, favouring established players
Industry Trends:
- Growing smartphone penetration is driving digital financial services adoption
- The government push for financial inclusion through digital means
- Rising interest rates are impacting borrowing costs but improving net interest margins
- Increasing focus on data analytics and AI-driven lending decisions
Fundamental Backdrop:
Company Overview:
- Dhani Services operates in the digital financial services space
- Diversified business model including lending, insurance, and investment services
- Strong technology platform enabling scalable operations
- Focus on serving underbanked population segments
Recent Developments:
- Quarterly earnings showing revenue growth trajectory
- Management focuses on improving asset quality and reducing NPAs
- Strategic partnerships for expanding product offerings
- Regulatory compliance improvements undertaken
Financial Health Indicators:
- Need to monitor debt-to-equity ratios given the lending business nature
- Asset quality metrics are crucial for long-term sustainability
- Revenue diversification, reducing dependence on single income streams
- Technology investments supporting operational efficiency
Catalyst Factors:
- Potential regulatory clarity on digital lending norms
- Expansion of credit underwriting capabilities
- Strategic alliances or acquisition opportunities
- Improved economic conditions support loan demand
Risk Factors:
- Regulatory changes in the fintech space
- Competition from established banks entering the digital space
- Credit risk in unsecured lending segments
- Technology and cybersecurity risks
- Dependence on external funding for growth capital
My Take:
This technical setup suggests a potential medium-term opportunity with proper risk management, though investors should monitor both technical levels and fundamental developments closely.
Keep in the Watchlist.
NO RECO. For Buy/Sell.
📌Thank you for exploring my idea! I hope you found it valuable.
🙏FOLLOW for more
👍BOOST if you found it useful.
✍️COMMENT below with your views.
Meanwhile, check out my other stock ideas on the right side until this trade is activated. I would love your feedback.
Disclaimer: "I am not a SEBI REGISTERED RESEARCH ANALYST AND INVESTMENT ADVISER."
This analysis is intended solely for informational and educational purposes and should not be interpreted as financial advice. It is advisable to consult a qualified financial advisor or conduct thorough research before making investment decisions.
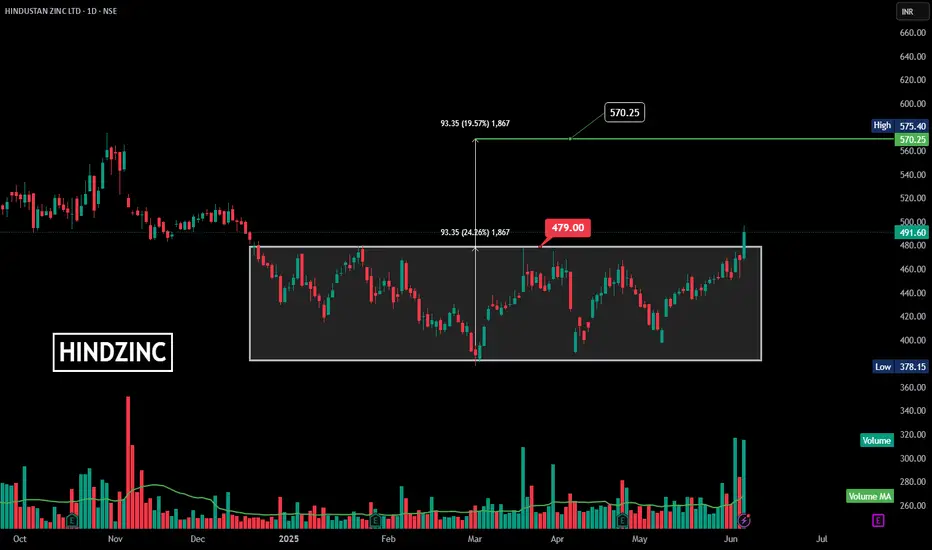
DLong

HINDZINC | Rectangular Consolidation | Breakout | DailyHere’s a detailed **technical summary and analysis** of the Hindustan Zinc Ltd. (HINDZINC) chart you shared:
---
### **Chart Pattern & Setup:**
✅ **Rectangular Consolidation / Range Breakout:**
* The stock has been trading within a range (rectangle) from approximately **378.15 (low)** to **479.00 (resistance)** for several months (since December 2024).
* This consolidation pattern signifies **accumulation**.
✅ **Breakout:**
* Price action has decisively broken out of the **rectangle’s upper boundary at 479.00 INR**.
* **Current price:** 491.60 INR, showing bullish momentum.
---
### **Measured Move & Target:**
* The height of the range (rectangle) is **93.35 INR** (24.26% move).
* **Target Calculation:**
$\text{Breakout Level (479)} + \text{Height (93.35)} = \approx \textbf{570.25 INR}$.
* Immediate resistance level is around 570-575 INR.
---
### **Volume Analysis:**
✅ A **significant spike in volume** confirms the breakout, validating the buying interest.
✅ The **Volume MA line** is also trending up, showing sustained interest.
---
### **Key Levels:**
* **Resistance (Breakout level):** 479.00 INR
* **Target:** 570.25 INR
* **Current Price:** 491.60 INR
* **Immediate support:** 479.00 INR
* **Low support:** 378.15 INR
---
### **Conclusion & Trade Idea:**
This breakout from a **rectangle consolidation** is a strong bullish signal, especially with the volume confirmation. If the price sustains above 479 INR, the next likely target is **570-575 INR**.
---
Would you like me to:
✅ Create a YouTube video title and description with these details?
✅ Suggest a possible trading plan or risk management idea?
✅ Generate hashtags for maximum YouTube SEO visibility?
Let me know! 🚀✨
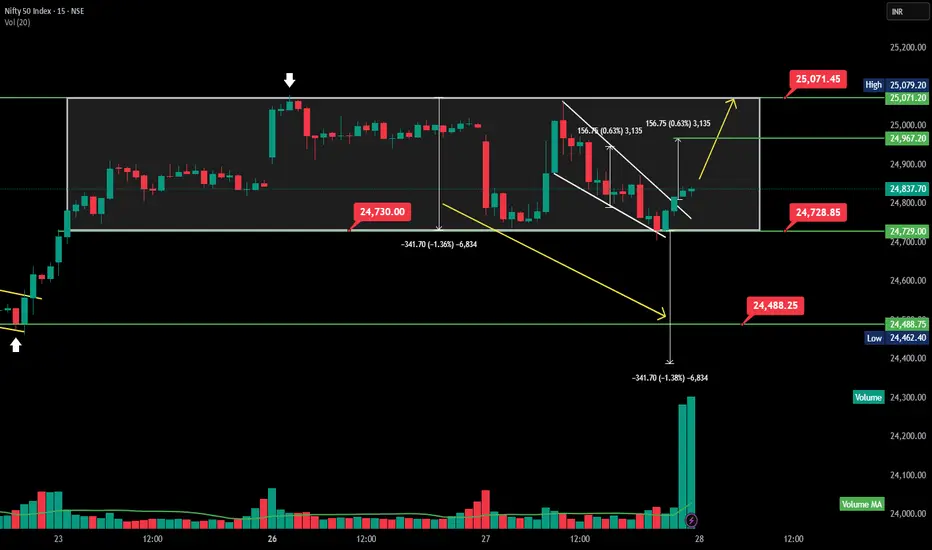
15-min intraday chart of Nifty 50 rectangle consolidation This is a **15-min intraday chart of Nifty 50 Index**, showing a **channel and retest**, followed by a potential **pullback setup** within a rectangle consolidation range.
---
### 📊 **Nifty 50 – Intraday Breakdown & Range Play Analysis**
#### 🔍 Chart Breakdown:
* **Range-bound Movement** between:
📌 Resistance: **25,071.45**
📌 Support: **24,730.00**
* **Breakdown from Rectangle:** Price fell sharply from range top to bottom, testing support at **24,730.00**.
* ** Flag Formation:** After the drop, price formed a flag pattern and gave break out for target - 24967.
* **Measured Move Target:**
Height of rectangle range = \~**342 pts**
📉 Breakdown target: **\~24,488**
📈 Rebound target (if breakout sustains) test top resistance: **\~25,071**
#### 🔄 **Scenario Outlook:**
* 🔼 **Bullish : can test 24,967 for move towards **25,071**
* 🔽 **Bearish below:** 24,728 — breakdown confirmation towards **24,488**
#### 📈 Volume Spike:
* Recent big green volume candle suggests accumulation or short covering.
---
Would you like a YouTube post setup for this intraday chart too?
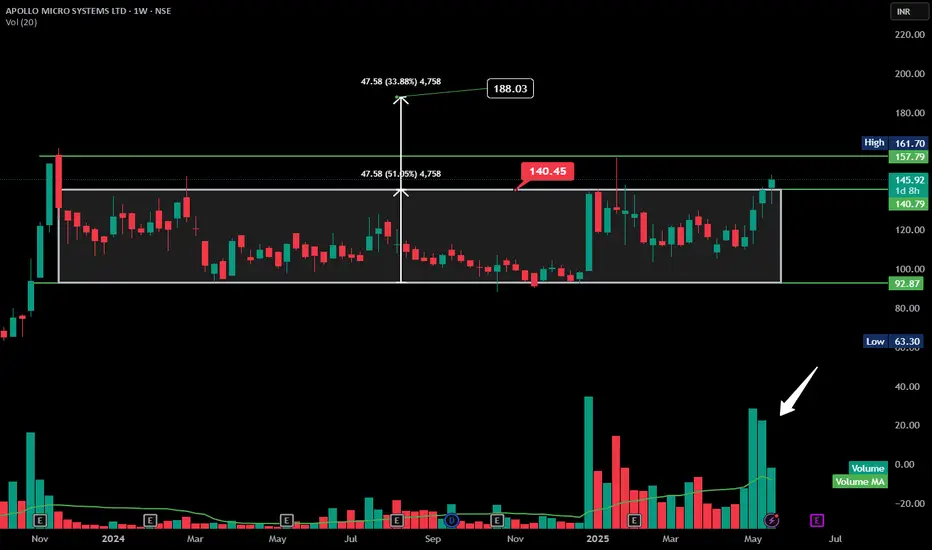
APOLLO rectangular consolidation Breakout - Good volumeHere’s a **technical analysis summary for APOLLO MICRO SYSTEMS LTD** based on the chart you provided:
---
### 📊 **APOLLO MICRO SYSTEMS LTD – Weekly Chart Summary**
* **Trend:** ✅ **Breakout Confirmed**
* Price has broken out above the rectangular consolidation zone after nearly a year of sideways movement.
* **Breakout Zone:**
* Resistance broken: **₹140.45**
* Consolidation range: ₹92.87 to ₹140.45
* **Target Projection (based on rectangle height):**
* Rectangle height = ₹47.58
* Projected Target = ₹140.45 + ₹47.58 = **₹188.03**
* **Current Price:** ₹145.92 (as of last weekly candle)
* **Volume Analysis:** 🔼
* Recent volume spikes confirm breakout strength.
* Volume > average, indicating institutional interest.
* **Support Levels:** * Lower: ₹92.87 (bottom of range)
---
### 📌 **Technical View:**
**Bullish outlook.** The breakout from a long accumulation phase with strong volume is a classic bullish signal. Price may face resistance around ₹157.79 and ₹161.70, but overall sentiment favors upside towards ₹188.
---
Titagarh - Double Bottom Reversal PatternNSE:TITAGARH Made Beautiful Chart Structure of Double Bottom Reversal Pattern today before Q4 Results with Good Price and Volume action.
Price Action Analysis:
- After a sharp decline from December 2024 to February 2025, the stock has formed a rectangular consolidation pattern
- Current price at ₹806.90, up significantly by ₹57.80 (+7.72%) in today's session
- Strong bullish candle today with substantial range, suggesting renewed buying interest
- Price is testing the upper boundary of the consolidation range
Volume Analysis:
- Today's volume stands at 5.27M shares vs. an average of 1.98M
- This high-volume move indicates strong institutional interest
- Previous bounces from support also showed increased volume (green arrows)
- Volume confirmation adds credibility to the potential breakout scenario
Key Supports and Resistances:
- Strong horizontal resistance at ₹820-830 level (marked by red horizontal line)
- Multiple rejections at this level (marked by red arrows)
- Solid support established at ₹675-680 zone (green horizontal line)
- Major resistance above at ₹1,110 from the previous price structure
- Recent high mark at ₹1,370
Technical Patterns:
1. Rectangle Pattern- Price consolidating between ₹675-680 (support) and ₹820-830 (resistance)
2. Double Bottom- Formed at the support level (₹675) in March and early May
3. Multiple Rejection Points- Four distinct tests of resistance (red arrows)
4. Higher Lows- Recent price structure showing potential strength
Trade Setup:
- Rectangle Pattern breakout opportunity
- Confirmation: If Sustained trading above ₹830 with continued volume support
- Strong rally today suggests momentum building for potential breakout
Entry Points:
1. Aggressive Entry: Current level (₹806.90) with partial position
2. Confirmation Entry: On close above ₹830 resistance
3. Pullback Entry: If price retraces to ₹780 after initial breakout attempt
Exit Strategy:
- Target 1: ₹900 (initial psychological level)
- Target 2: ₹1,000 (round number resistance)
- Target 3: ₹1,110 (previous significant resistance level)
- Ultimate Target: ₹1,300-1,370 (previous high area)
- Trailing Stop: Consider a trailing stop of 3-5% once Target 1 is achieved
Stop Loss Placement:
- Aggressive Stop: ₹775 (below today's low)
- Conservative Stop: ₹740 (midpoint of the range)
- Pattern-Based Stop-Loss: ₹675 (below the established support level)
Risk Management:
- Position sizing: Limit risk to 1-2% of trading capital
- Risk-reward ratio: Minimum 1:1.5 (with conservative stop)
- Consider scaling in on confirmed breakout and scaling out at each target
Keep in the Watchlist.
NO RECO. For Buy/Sell.
📌Thank you for exploring my idea! I hope you found it valuable.
🙏FLLOW for more
👍BOOST if useful
✍️COMMENT below with your views.
Meanwhile, check out my other stock ideas on the right side until this trade is activated. I would love your feedback.
Disclaimer: "I am not SEBI REGISTERED RESEARCH ANALYST AND INVESTMENT ADVISER."
This analysis is intended solely for informational and educational purposes and should not be interpreted as financial advice. It is advisable to consult a qualified financial advisor or conduct thorough research before making investment decisions.

GODREJPROP - Rectangle -BO -DailyGodrej Properties Ltd (GODREJPROP) has recently released its Q4 FY25 results, revealing a mixed performance.
📊 Financial Highlights (Q4 FY25)
Net Profit: Declined by 19% year-on-year to ₹382 crore, compared to ₹471 crore in Q4 FY24.
Revenue: Increased by 49% year-on-year to ₹2,122 crore.
EBITDA: Slightly decreased by 2% to ₹634 crore.
Expenses: Overall expenses rose by 54%, primarily due to increased material consumption costs.
Bookings: Achieved record-high quarterly bookings of ₹10,163 crore, marking a 7% year-on-year increase.
FY26 Guidance: The company anticipates new bookings of ₹32,500 crore for FY26, slightly lower than FY25 projections.
Market Cap: Approximately ₹65,011 crore.
P/E Ratio (TTM): 43.66.
P/B Ratio: 3.86.
Debt-to-Equity Ratio: 1.25.
The chart **Godrej Properties Ltd (GODREJPROP)** shows a **bullish breakout** from a **rectangle base consolidation pattern**, suggesting a potential uptrend continuation. Here's the technical breakdown:
---
### 🧠 **Chart Pattern Analysis**
- **Pattern:** Rectangle base (accumulation zone) between ~₹1,900 and ~₹2,212
- **Breakout Level:** ₹2,212.50 (horizontal resistance)
- **Breakout Candle:** Strong bullish candle with volume spike (confirmation)
- **Target Projection:**
- Rectangle height: ₹2,212.50 - ₹1,900 ≈ ₹312.50
- Target: ₹2,212.50 + ₹312.50 = **₹2,525** (matches chart projection)
---
### 📌 **Key Levels**
- **Immediate Resistance:** ₹2,249.30 (current price), next at ₹2,525.55
- **Immediate Support:** ₹2,212.50 (breakout level), then ₹1,901.50
- **52-Week High:** ₹3,387.10 (far resistance)
---
### 📊 **Volume Confirmation**
- Noticeable volume spike on the breakout candle.
- Volume > 20-period moving average volume — supports breakout strength.
---
### 🧭 **Outlook**
- **Bullish bias** in the short to medium term.
- A sustained close above ₹2,212.50 with increasing volume favors the target move toward ₹2,525+.
- If price re-tests the breakout zone and holds (₹2,212 area), it would be a healthy sign of support.
---

Let's talk about Patience !!This stock on the chart just looks flawless but in reality, it is a stock that will test your patience to at least get 50% returns. Price action wise it shows a very promising setup, in 2021 coming out of a 10 year consolidation and again consolidating for over 3.5 years. It has 50 MA support on monthly and currently looks good for a good returns.
CMP: 9.50
Target 1: 15
Target 2: 20+
Time frame: 0-2 years
Disclaimer: Trade at your own risk

Chambal Fertiliser a 6 month consolidation will it breakout ?Chambal Fertilisers and Chemicals Ltd. is another interesting chart to keep on radar with following
1. RSI on all time frames (DWM) is at or above 60
2. Narrowing Bollinger Bands on daily chart with price walking on upper band
3. ABCD pattern under formation on weekly chart with fib-extension targets of 639-694
4. 6 month long consolidation on daily chart within channel of 440-530 zone
5. Major Supports are as under:
20 SMA (weekly) 491
20 SMA (Daily) 478
50 EMA (Daily) 483
With cluster of supports in area of 478-492 lets see if it breaks out of its consolidation or continues its consolidation
Lets See How it Evolves.
Disclaimer: NOT A BUY / SELL RECOMMENDATION I am not an expert I just share interesting charts here for educational purpose and not to be taken as buy/sell recommendation. Please seek expert opinion before investing and trading as trading/ investing in market is subject to market risks. I do not hold any position in the stock as on date but I may look to take some position with my own Risk Reward matrix.

DIVISLAB - CHANNEL CONSOLIDATION -WILL IT BREAKOUT OR NOTDivi's Laboratories Ltd. is an interesting chart with following
1. RSI on all time frames (i.e. D/W/M) above 60
2. Narrowing Bollinger Bands on daily chart with price walking on upper band
3. Two month's long consolidation of price in rectangular range of 5675 to 6300 levels and once price breaks out of this range, momentum will increase
4. ABCD pattern under formation on weekly chart
5. Major price supports at 5930 i.e. 20 Day SMA and 5750 i.e. 50 EMA respectively
Breakout of 6300 + levels on closing basis can fetch 6700 + and 6980 levels as per Fibonacci projection tool
Lets see How it evolves
Disclaimer: NOT A BUY / SELL RECOMMENDATION I am not an expert I just share interesting charts here for educational purpose and not to be taken as buy/sell recommendation. Please seek expert opinion before investing and trading as trading/ investing in market is subject to market risks. I do not hold any position in the stock as on date but I may look to take some position with my own Risk Reward matrix.

STYLEBAAZACompany Profile
Incorporated in June 2013, Bazaar Style Retail Limited is a fashion retailer operating in West Bengal and Odisha.
heir average transaction value was ₹ 1,039 in FY24, which was the 2nd highest when compared to that of the Listed Value Retailers in India.
Co. intends to raise 835 Crs through the IPO of which 148 Crs is a fresh issue that will be utilized for:
A) Repayment of Borrowings
B) General Corporate Purpose
----------------------------------------------------------
Fundamentals
Market Cap - ₹ 2,845 Cr.
Promoter holding - 45.6 %
FII holding - 5.26 %
DII holding - 9.16 %
Public holding - 40.0 %
Looks good to buy on dip.

POWERMECH Swing IdeaPOWERMECH broke out of parellel channel with weekly close confirmation.
Target of rectangle rpattern is given in chart. It may reach longterm uptrend channel upper line in coming days.
Need to plan trade accordingly with risk management.

KANSAI NEROLAC - Swing Trade Analysis - 30th July #stocksKANSAI NEROLAC PAINTS (1W TF) - Swing Trade Analysis given on 30th July, 2024
Pattern: RECTANGLE BOX BREAKOUT
- Weekly Resistance Breakout Initiated - Done ✓
- Weekly Volume Buildup at Resistance - Done ✓
- Demand Zone Retest & Consolidation (for a small SL and a better RR) - In Progress
* Disclaimer

MMTC - Swing Trade Analysis - 4th July #stocksMMTC (1D TF) - Swing Trade Analysis given on 4th July, 2024
Pattern: RECTANGLE BOX BREAKOUT
- Resistance Breakout - Done ✓
- Volume Buildup at Resistance - Done ✓
- Demand Zone Retest & Consolidation (for a small SL and a better RR) - Done ✓
* Disclaimer

ADSL - BREAKOUT AND A 2X CANDIDATE BASED ON FUNDAMENTALSHi All,
This idea is about Allied Digital Services Ltd
Mkt Cap - 1204 Cr
Stock PE - 26
Mcap/Sales - 1.75
As per mgmt concal transcript, revenue guidance of 1000Cr in FY25/26
Assuming NPM at 8%, this could take the mktcap to 2200Cr easily which wud appreciate the stock price towards levels of 400
Technically also its a healthy breakout with expanding Moving averages after tight consolidation. Volume is extremely good to support further price action
Happy Trading,
Thanks,
Stock-n-Shine

WELCORP - CLEAN BREAKOUT OUT OF DARVAS BOXHi All,
This idea is about Welspun Corp Ltd
FUNDAMENTALS
Mkt Cap - 17161 Cr
Mkt Cap/Sales - 0.99
P/E - 15.5
P/BV - 3
FCF - 1022 Cr
D/E - 0.35
Promoter increase thr stake by 0.18%
ROE - 21%
ROCE - 21.6%
Technicals
Price has been consolidating within a range of 25% and has now given a decisive breakout above the supply zone. There was a mid resistance as well which was broken with good volumes
Hope you have a profitable trade,
Thanks,
Stock-n-Shine

AVANTI FEEDS - Swing Trade Analysis - 7th June #stocksAVANTI FEEDS (1D TF) - Swing Trade Analysis given on 7th June, 2024
Pattern: RECTANGLE BOX
- Volume Buildup at Resistance - Done ✓
- Resistance Breakout - In Progress
- Demand Zone Retest & Consolidation - In Progress
Please ensure that the pullback to the demand zone gives a nice small SL for a better RR
* Disclaimer

Indusind BankAfter Down Move stock went in consolidation so one can trade this stock on support and resistance basis

WIPRO - SWING TRADE - 23rd December #stocksWIPRO (1W TF)
Swing Trade Analysis given on 23rd December, 2023 (Saturday)
Pattern: RECTANGLE BOX BREAKOUT
- Breakout of Resistance - Done ✓
- Volume Spike near Breakout - Done ✓
- Retracement & Consolidation - In Progress
#stocks #swingtrade #chartanalysis #priceaction #traderyte #wipro

APOLLOHOSP - SWING TRADE - 27th December #stocks#APOLLOHOSP (1D TF)
Swing Trade Analysis given on 27th December, 2023
Pattern: RECTANGLE BOX BREAKOUT
- Volume Spike Buildup - Done ✓
- Breakout of Resistance - In Progress
- Retracement & Consolidation - In Progress
#stocks #swingtrade #chartanalysis #priceaction #traderyte

CONCORD BIOTECH - Swing Trade - 25th February #stocksCONCORD BIOTECH (1D TF) - Swing Trade Analysis given on 25th Feb, 2024
Pattern: RECTANGLE BOX
- Volume buildup at Resistance - Done ✓
- Resistance Breakout - In Progress
- Retest & Consolidation - In Progress
#stocks #swingtrade #chartanalysis #priceaction #traderyte #CONCORDBIOTECH #stockmarket #sharemarket #viral #sharemarketindia #StockMarketindia

STATE BANK OF INDIA - Swing Trade - 3rd March #stocksSTATE BANK OF INDIA (1D TF) - Swing Trade Analysis given on 3rd March, 2024
Pattern: RECTANGLE BOX
- Volume buildup at Resistance - Done ✓
- Wait for Retest at Demand Zone & Consolidation - In Progress
