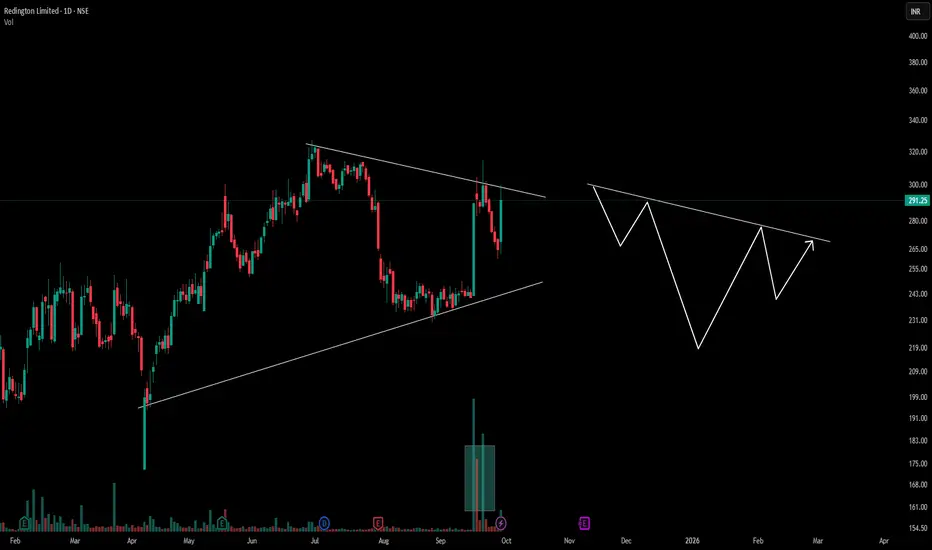
Redington Ltd | Symmetrical Triangle – Breakout AwaitedRedington Ltd is a leading technology distribution and supply chain solutions company, operating across India, the Middle East, Africa, and South Asia. The company specializes in the distribution of IT products, mobility devices, cloud solutions, and emerging technologies, partnering with global brands to deliver end-to-end supply chain and value-added services. With a strong focus on digital transformation, scalability, and efficient logistics, Redington plays a crucial role in enabling technology adoption across multiple markets.
Redington Ltd is currently consolidating within a symmetrical triangle formation, indicating a phase of price contraction and equilibrium between buyers and sellers. The stock has been making lower highs and higher lows, reflecting reduced volatility and a potential build-up for a strong directional move. A decisive breakout with volume confirmation will be crucial to determine the next trend direction.
REDINGTON

Inverse head and shoulder formed in reddington1. Inverse head and shoulder formation on Support levels showing buyers will take control from here
2. With minimum downside one can watch for long upside movement shown as target zone on charts
3. The strong movement has shown after result which tells us if movement continues then target may come soon
4. SL is strict as if move fails then not giving chance to get trapped

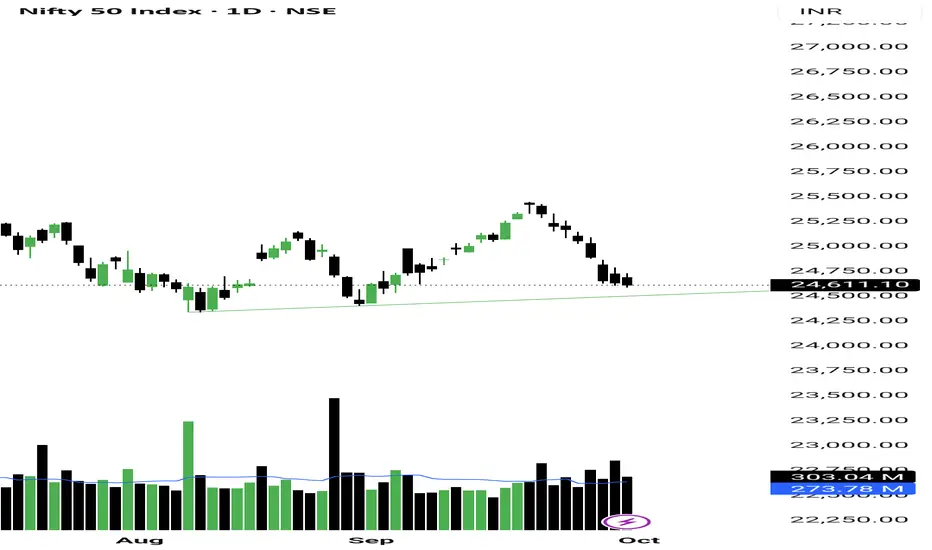
Accumulation in Nifty seen again! This is the 2nd straight session where NSE:NIFTY price closed below the day low but buyers’ volume was higher.
Red candle + green volume = a clear institutional accumulation footprint.
On top of that, the retailers index is going down, which confirms the view even more.
Normally, after yesterday’s strong buyers’ volume, we should have seen a bounce in the index today. But thanks to the weekly + monthly expiry, price was suppressed.
That suppression means one thing – the market can pop out anytime.
Remember the 3-step process I shared before:
1. Accumulation
2. Manipulation
3. Distribution (uptrend)
Right now we’re in the accumulation phase. A manipulation phase cannot be ruled out – it could come as a direct drop or a bounce with sell-on-rise characteristics. So, watch closely over the next 2–3 days.
Personally, I think from next week we’ll enter the 3rd phase – distribution or simply, the uptrend. Until then, accumulating dips whenever buyers’ volume is up is the right strategy. That’s exactly what I’m doing.
Now for tomorrow:
– Pivot is at 24644, PP is 0.13%
– If index opens above the pivot and holds on the hourly chart, we can see a sharp move to 24760 / 24880
– Downside support is at 24570
Sector-wise, PSU Banks and Metals are looking strong.
I’m holding NSE:HINDZINC and added NSE:REDINGTON today. I won’t be adding more until market breadth improves.
That’s all for today. Take care. Have a profitable tomorrow.
---
📊 Levels at a glance:
Pivot: 24644
Support: 24570
Resistance 1: 24760
Resistance 2: 24880
Pivot Percentile: 0.13% (sharp move possible)
Bias: Accumulation phase, buy dips on buyers’ volume uptick
Sectors to watch: NSE:CNXPSUBANK , NSE:CNXMETAL
Extended Inverted Head & Shoulders Structure in Price ActionThis chart features an extended inverted head and shoulders pattern, illustrating how these classic formations can significantly vary in length and shape across timeframes. The left and right shoulders frame a deeper head, while the neckline is not strictly horizontal but angled, reflecting real market dynamics. Observing these variations enhances one’s ability to identify patterns in imperfect conditions.
Key aspects include the evolving symmetry between the shoulders, the consistency of the head’s depth, and the interaction of price with the neckline angle. This post encourages traders to look beyond textbook structures and develop a refined eye for authentic technical setups, emphasizing pattern recognition without predicting price direction.
Disclaimer: This analysis is for educational purposes only and does not constitute investment advice. Always conduct your own research before making trading decisions.
Looks bullish on coming daysRedington , broken its tight consolidation with good volume and 8.4% move. It looks positive for coming days. Stock could give 10-20% in very short duration.
200% + RVOL shows buyers interest.
Weekly if we see, this stock came out of channel structure and giving good upmove with volume push.
Stay connected for commentary for coming days
Disclaimer:
The information provided herein is for educational and informational purposes only and should not be construed as investment advice. The stock analysis and recommendations are based on publicly available information, data sources believed to be reliable, and our interpretation at the time of writing.
Investing in equities involves risks, including the risk of loss of capital. Past performance is not indicative of future results. Readers and investors are advised to conduct their own research or consult a qualified financial advisor before making any investment decisions.
The author(s), affiliates, or associated entities may hold positions in the stocks mentioned, and such positions are subject to change without notice.
We do not guarantee the accuracy, completeness, or timeliness of any information presented, and we disclaim any liability for financial losses or damages resulting from the use of this content.

Triangle Breakout is expected in REDINGTON.Elliott wave analysis:-
Running Flat took place with B wave as triangle. now an upside move is expected.
i am not a SEBI registered advisor. Before taking a trade do your own analysis or consult a financial advisor. I share chart for education purpose only. I share my trade setup.

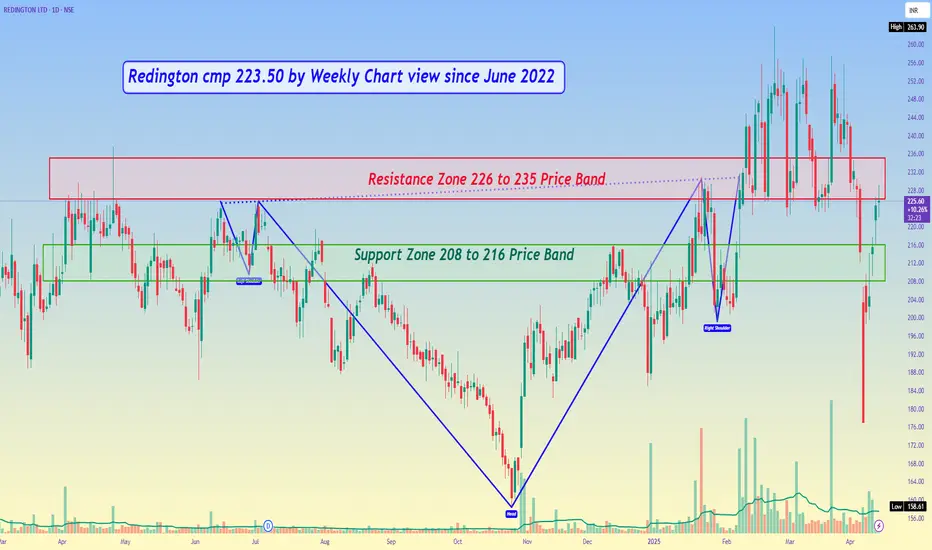
Redington cmp 223.50 by Weekly Chart viewRedington cmp 223.50 by Weekly Chart view
- Support Zone 208 to 216 Price Band
- Resistance Zone 226 to 235 Price Band
- Bullish Head and Shoulders made with neckline at Resistance Zone
- Kindly ignore the comment "since June 2022" as it got included from another chart
Redington in Blue Sky With Vol Post Q3NSE:REDINGTON is now in blue sky with Vol. Post Q3. With RSI and MACD Trending Up.
About:
NSE:REDINGTON is a leading IT and mobility product distributor and a supply chain management solutions and support services provider in India, the Middle East, Turkey and Africa.
Trade Setup:
As it's in the blue sky, there is no target just wait for pullbacks and buy on dips keeping the mentioned Supports as Stop Loss.
Target(Take Profit):
Depends on your entry just keep 1:1 at least.
Stop Loss:
Entry Candle Low for Swing Trader and Recent Swing Lows for Positional Trader.
📌Thank you for exploring my idea! I hope you found it valuable.
🙏FLLOW for more
👍BOOST if useful
✍️COMMENT Below your views.
Meanwhile, check out my other stock ideas on the right side until this trade is activated. I would love your feedback.
Disclaimer: "I am not SEBI REGISTERED RESEARCH ANALYST AND INVESTMENT ADVISER."
This analysis is intended solely for informational and educational purposes only and should not be interpreted as financial advice. It is advisable to consult a qualified financial advisor or conduct thorough research before making investment decisions.

Redington cmp 245.26 by Weekly Chart viewAdd the stock to your watchlist for New ATH levels creation on the way
Redington cmp 245.26 by Weekly Chart view
- Volumes have burst out exponentially over last few weeks
- All Major Technical Indicators EMA, MACD, RSI trending very positively
- Weekly Support at 216 > 183 > 152 and Resistance ATH 248 and every New ATH
- Stock Price traversing within the Rising Price Channel and has hit ATH 248 last week
- Also Multiple Bullish Rounding Bottoms formed by considerate VCP Pattern too can be seen

Redington Bounced from a Long Term Base With MACD +veNSE:REDINGTON today confirmed a Strong Base Formation after closing above major Levels RSI Showing Bullish Momentum and MACD turned Positive Today With Good Volumes.
Trade Setup:
It can be a Good 1:1 RISK-REWARD Trade. With the recent base being crucial levels.
Target(Take Profit):
234.25 Levels for Positional Trader.
Stop-Loss:
Around 198.58 For Swing Trade and Recent Base for Positional Trader.
📌Thank you for exploring my idea! I hope you found it valuable.
🙏FLLOW for more
👍BOOST if useful
✍️COMMENT Below your views.
Meanwhile, check out my other stock ideas below until this trade is activated. I would love your feedback.
Disclaimer: This analysis is intended solely for informational and educational purposes and should not be interpreted as financial advice. It is advisable to consult a qualified financial advisor or conduct thorough research before making investment decisions.

Redington cmp 223.50 by Weekly Chart viewRedington cmp 223.50 by Weekly Chart view
- Support Zone at 194 to 199 Price Band
- Stock made back to back Bullish Rounding Bottoms
- Price closure sustained breakout well above Falling Resistance Trendline
- Weekly basis Support at 199 > 180 > 158 with Resistance only at ATH 238.46

SWING OPPORTUINTY IN FALLING MARKET (REDINGTON)Stock gave strong breakout of all time high and trading above it if it sustains above 230,we can see buying opportunity till 250 ,270.
Entry - Above 230
Target -250 to 273 (According to your risk management)
Stoploss - 211
This is not a buy or sell call, analysis is shared for educational purpose.

Crossover - REDINGTON📊 Script: REDINGTON
📊 Sector: Trading
📊 Industry: Trading
Key highlights: 💡⚡
📈 Script is trading at upper band of BB and giving breakout of it.
📈 MACD is giving crossover .
📈 Double Moving Averages are giving crossover.
📈 Right now RSI is around 64.
📈 One can go for Swing Trade.
⏱️ C.M.P 📑💰- 222
🟢 Target 🎯🏆 - 235
⚠️ Stoploss ☠️🚫 - 217
⚠️ Important: Always maintain your Risk & Reward Ratio.
✅Like and follow to never miss a new idea!✅
Disclaimer: I am not SEBI Registered Advisor. My posts are purely for training and educational purposes.
Eat🍜 Sleep😴 TradingView📈 Repeat 🔁
Happy learning with trading. Cheers!🥂

RedingtonThere is a one more stock Which is showing a great opportunity , stock is near support cum resistance. what is your view please comment it down. We are NISM Certified. All views shared on this channel are my personal opinion and is shared for educational purpose and should not be considered advise of any nature. Pasted a image from my private idea because daily idea post limit is reached.

RedingtonRedington Limited has made a breakout and is currently in a buying zone. CMP is 189. Breakout confirmation and retesting in one day and one week time frame, thus we expect to hit all of our targets.

REDINGTON BOREDINGTON gave a breakout last week and a retest is due with a gap at the green zone (Now support) entry can be taken only near the zone.
NOTE: I'm not a SEBI REG. Study before investing.

REDINGTON Redington gives a Beautiful breakout of Cup & Handle Pattern & Now its readying for further good up rally
KEEEP ON RADAR

This stock can fly after breakout!Redington has been forming an inverted head and shoulder pattern from the past 2 years.
A weekly closing above 200 will confirm the breakout which will unlock huge targets for the stock.
This stock has nice fundamentals with a good dividend yield so one can consider this stock for long term investment as well.
Keep this stock in watchlist as the rejection in previous week is due to dividend correction.
Idea shared for educational purposes.

Investment_ Redington IndiaNamaste!
Redington India is a good mid-cap pick considering it's fundamentals, very consistent EPS, and after a good correction.
It is a buy at current prices (Rs 126.55).
The logic is simple, if a company with good fundamentals available at a discount, then it's a perfect opportunity to invest.
Remember, never invest more than 10% of your capital in any particular stock. Diversification is a must for reducing risks.
I have shared many stocks till now and will share more in the future, in the tradingview platform. I expect anyone, who is reading these articles to do your own analysis, and pick the stocks of your choice. Make a perfect blend of sectors and stocks resulting in a market-beating portfolio.
The most important rule in Investing is, never ever sell at a loss. There are only two possibilities in my opinion, either the company goes bankrupt, or you make money.
Disclaimer: The analysis I have shared is based on my understanding and experience in the markets. Investment does not guarantee a fixed return due to volatile nature of markets. Please do your analysis and/or consult your financial advisor before investing.

alternative view redingtonan alternate view on final 5th wave and once this is completed. an impulse wave was yet to complete.

An impulse wave over and simple correction happen in REDINGTONELLIOTT WAVE ANALYSIS
An impulse took place and a cycle has completed the 1) wave and the correction of 2) is in the end .
In 2) wave a simple flat correction took place. But my view is that we may expectation is that we may expect a complex correction .
It may raise to 180-190.
If the up move was slow and too long then we can expect a correction wave.
correction wave pattern was already posted and it was linked below, you people can view that chart for more clarification. it an alternative view.


Redington Accumulation in Wave 4Redington needs to hold 160 levels to keep this counts valid & a day close above 183 will gain momentum.
This Stock is in Larger degree Wave 3 so keep riding the trend.
