Sector Rotation With Sector Relative Strength [Afnan]Most traders spend their time reading charts, drawing levels, waiting for breakouts, and searching for the perfect Demand Zone pattern. But very few ask the most important question:
“Is the sector supporting my trade?”
That single question often separates strong moves from failed setups. A breakout inside a weak sector usually fades. A demand zone inside an underperforming group often breaks. But a stock backed by a strong sector? Even a simple pattern can turn into a powerful trending move.
This is where the Sector Relative Strength indicator becomes a game-changer.
🧭 Why Sector Strength Matters 🧭
When institutional money rotates from one sector to another, prices shift in a way that pure price action cannot reveal on its own. This rotation is what fuels trends in some stocks while suppressing others.
A weak stock in a strong sector can still deliver solid moves.
A strong chart inside a weak sector often struggles.
Sector rotation is an early signal of where markets want to move next.
Following sector flow aligns your trades with market momentum rather than fighting it.
This indicator simplifies all of that.
📌 What This Indicator Brings to the Table 📌
Sector Relative Strength Afnan provides real-time sector rotation directly on TradingView, condensing complex institutional analysis into a clean and actionable structure.
Tracks 26 Indices at once.
Uses multi-timeframe relative strength — RS21, RS55, and RS123.
Automatically detects your stock’s related sector.
Compares each sector with your chosen benchmark.
Shows short-term and medium-term rank changes.
Uses EMA alignment to classify trends.
Displays heatmap colors for instant clarity.
Shows market sentiment as outperform, mixed, or underperform.
Fully customizable for traders outside India as well.
This transforms sector analysis from a tedious manual task into a smooth, visual workflow.
🛠️ How to Use It Like a Pro 🛠️
To unlock the full potential of this indicator, use it in a two-layer setup:
Add the first instance with the table ON — this is your sector scanner.
Add the second instance with the table OFF — this keeps your chart clean while still showing relative strength lines and sector mapping.
Once your setup is ready, focus on sectors that show:
High ranking positions.
Positive relative strength across periods.
Clear trend alignment.
Improving rank over 5 and 21 bars.
Avoid sectors that fall deep into the red zone or show consistent deterioration. These areas often trap traders and reduce momentum.
Following this simple rule — trade in strong sectors and avoid weak ones — instantly improves trade selection.
🚀 What Makes This Tool Truly Unique 🚀
To manually replicate everything this indicator does, you would need to calculate:
Relative strength for every sector.
Sector-to-benchmark comparisons.
Multi-period RS changes.
Trend checks through EMA alignment.
Rank history for multiple lookbacks.
Heatmap scoring.
Sentiment classification.
This is the type of work traders either avoid or pay subscription fees for on premium websites.
Having it automated inside a TradingView indicator saves hours and removes guesswork, allowing you to focus on the highest-probability opportunities.
📌 “The market rewards those who follow strength, not those who chase noise.”
Lastly, Thank you for your support, your likes & comments.
✨ Keep learning, stay disciplined, and let the trend be your guide. ✨
This analysis is purely for educational purposes and is not a trading or investment recommendation. I am not a SEBI-registered analyst.
Relativestrength

IT SectorHello & welcome to this analysis
The relative strength of CNX IT with Nifty is indicating the likelihood of a stronger reversal.
In the monthly time frame we can see after doing a 2x Fibonacci trend extension it did a retracement up to the I H S neckline.
In the weekly time frame we can see an early stages of the probability of a double bottom formation.
Current ratio is 1.45, if it can hold on a weekly basis above 1.39 it could continue to improve with resistance coming in at 1.55. A weekly close above 1.60 opens the probability of 1.90 and 2.10. Failure to hold 1.39 would suggest further downtrend continuation.
Relative Strength is a measure of 2 tradeable assets versus each other. In this case the analysis is if Nifty rallies then IT index will rally strong and if Nifty declines IT index will decline less as long the ratios mentioned above are maintained.
All the best

Relaxo Footware looking interestingNSE:RELAXO
After a long consolidation for about 4 months, now the stock is trying to breakout.
Stock Volume and Delivery surged by 2.4 times and 3.4 times respectively indicating good interest.
Market cap of the footwear sector is increased by 1.2% in last trading session
RS crossing above zero indicates the outperformance
RSI going above 70 indicates great momentum
Closed above 100 DEMA. Next resistance is the 200 DEMA around 540.

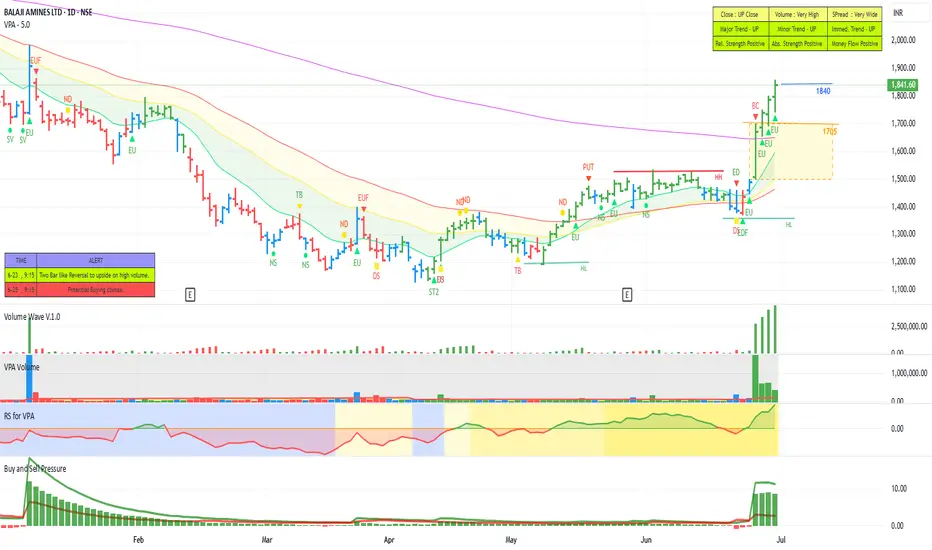
BALAJI AMINES - STEPPING INTO STAGE 2 ?The leading amine manufacturing company stocks had seen a huge down move of 50 to 60 percent. Of late many of these stocks have seen smart recovering. Leading stocks like alkyl amine, Vinati organics etc. crossed above the short-term moving averages. 200 DMA and moving up. Another stock in the group Balaji Amines has also started moving up now. After making a bottom it is now started making higher highs and Higher Lows. It also crossed above the short-term moving averages. The last few sessions we saw a huge momentum coming in with a huge Buy Wave pushing the stock above the 200 DMA. We can see that the relative strength and the absolute strength are also positive with the money also flowing into the stock. Now it is safely out above the 200 DMA with all other parameters looking positive. There is also good committed buying seen looking at the delivery volumes. The current momentum is likely to push up the stock further along in line with the other main amine manufacturing stocks.
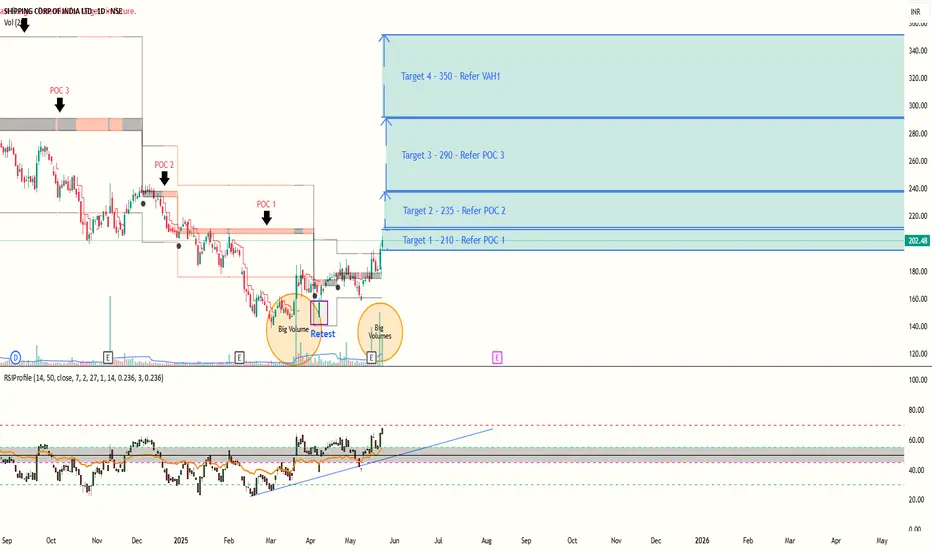
Shipping Corporation of India - Value Buying and Bullish trendShipping Corporation of India had retraced almost 61.8 % from highs near the lows, after a period of accumulation where there were continous responsive buyers at lows. The price started moving up.
Volumes : Volumes can be confirmed with the circles plotted on chart.
Retest : The retest of price happened highlighted by the rectangle.
Initiative Buyer : we can see big volumes coming after the retest happened and price started moving above POC - Point of control of current range. This suggest a strong support zone below even if the price retraces a bit eventual trend is up.
From the previous point of controls and value area highs we can set targets for upcoming upmoves :
Targets :
1)210
2)235
3)290
4)350
There should be strong support around Point of control and value area low of current range, in case of SL hunting of weak hands.
Still shows a relatively low risk opportunity with potential for high reward.
PS : Post is educational in nature and doesn't constitute any financial or buy sell advice. Do your own research. The publication is made with the intention to explain the concepts of RSI Hybrid Profile.
Indicator
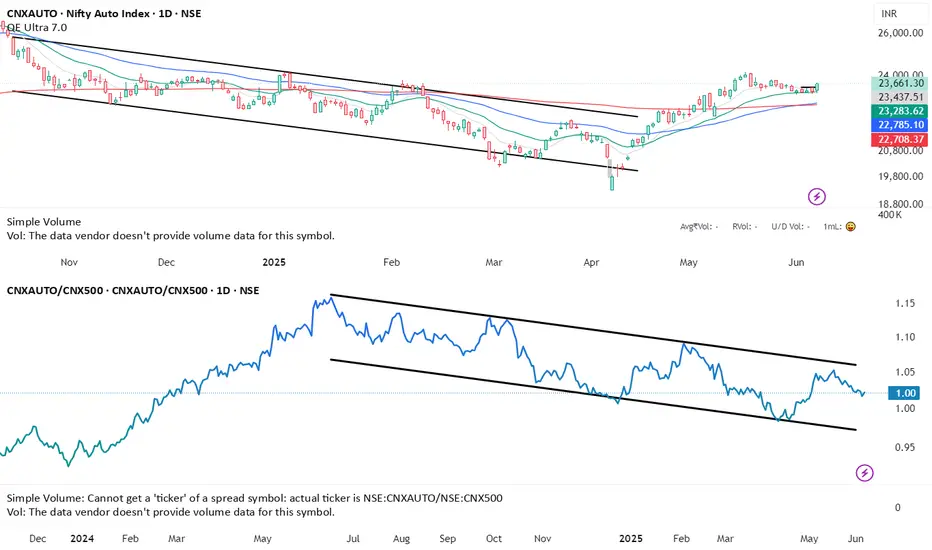
Relative Strength or weakness in Auto sectorLet's see if this makes lower high but this sector does not look the strongest for sure
Stocks in this index:
NSE:MARUTI,NSE:M&M,NSE:TATAMOTORS,NSE:BAJAJ-AUTO,NSE:EICHERMOT,NSE:TVSMOTOR,NSE:MOTHERSON,NSE:BOSCHLTD,NSE:HEROMOTOCO,NSE:ASHOKLEY,NSE:BHARATFORG,NSE:TIINDIA,NSE:MRF,NSE:BALKRISIND,NSE:EXIDEIND
Will have to check Ancillaries separately as there are many stocks which are coming in scans from Ancillaries space.
We are also facing rare magnets issue in the short term.
This is how you can use ratio charts to gain an extra edge.
Source: x.com
DISCLAIMER: NOT A SEBI REGISTERED ANALYST.
NO RECOMMENDATION TO BUY AND SELL
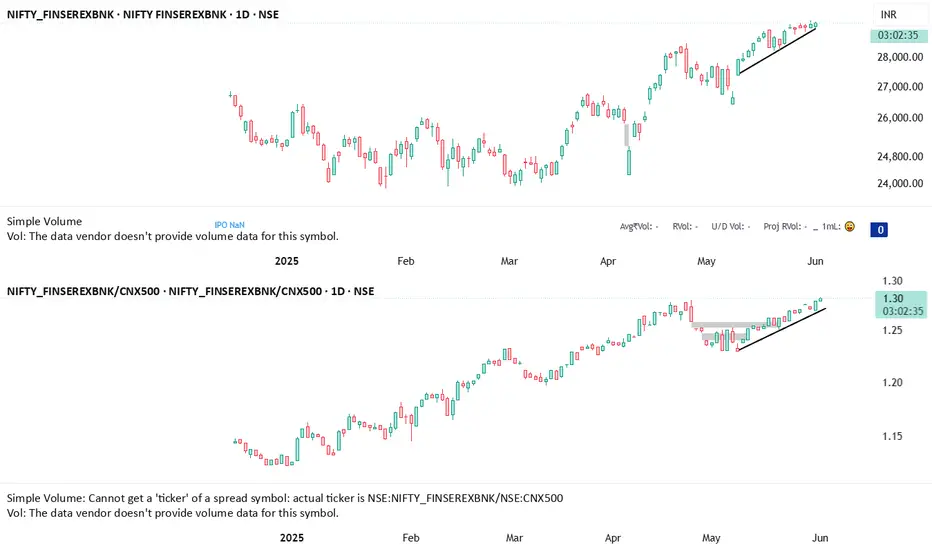
NIFTY FINANCIAL SERVICES EXCLUDING BANKSPrice is also moving up and Ratio charts also confirms this index is outperforming.
Stocks included in this index are:
NSE:ABCAPITAL,NSE:ANGELONE,NSE:BSE,NSE:BAJFINANCE,NSE:BAJAJFINSV,NSE:CDSL,NSE:CHOLAFIN,NSE:CAMS,NSE:HDFCAMC,NSE:HDFCLIFE,NSE:ICICIGI,NSE:ICICIPRULI,NSE:IEX,NSE:IRFC,NSE:JIOFIN,NSE:LTF,NSE:LICHSGFIN,NSE:LICI,NSE:M&MFIN,NSE:MFSL,NSE:MCX,NSE:MUTHOOTFIN,NSE:PAYTM,NSE:POLICYBZR,NSE:PEL,NSE:PFC,NSE:RECLTD,NSE:SBICARD,NSE:SBILIFE,NSE:SHRIRAMFIN
You can check individual stock chart to know which stock is strongest
DISCLOSURE: NOT A BUY/SELL recommendation.
NOT A SEBI REGISTERED ANALYST
Relative outperformanceIf you see both the charts Nifty Private Bank was out performing Nifty 500 but it is falling now and PSU bank index has started increasing. It seems money is flowing in PSU Banks. They may outperform Nifty 500.
Disclaimer: INVESTED IN BANK NIFTY ETF. I'm NOT SEBI REGISTERED. NOT A BUY/SELL RECOMMENDATION.

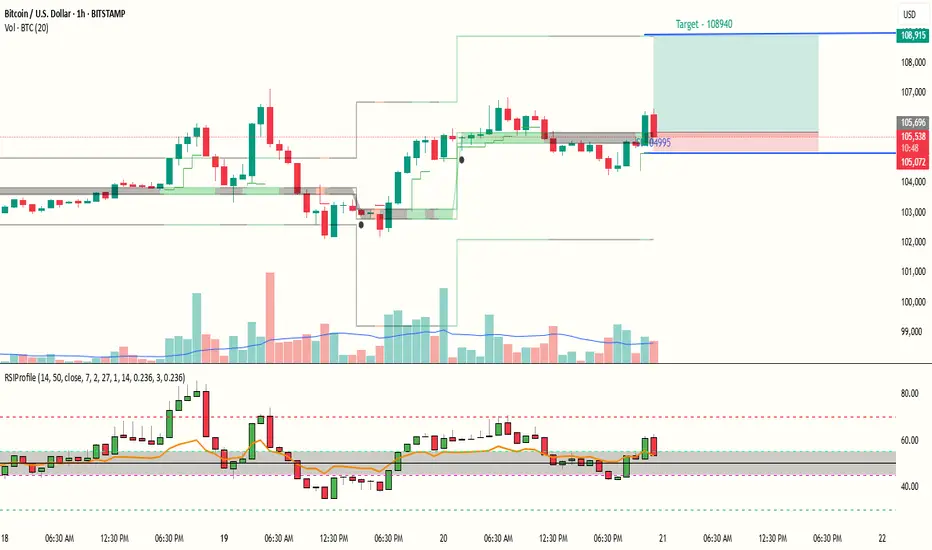
BTC ready for continuation of UP move with a reward ratio of 5RSI Profile shows a positive trend for BTCUSD and and risk reward ration is above 5. Also a Bullish triangle pattern seems to reach near complete on BTC Chart. Price is above RSI Point of Control, hence a small SL below POC and target is near the Value area High.
Entry near 105600
Target near 108940
Sl near 104995
RR : 5.16
PS : Above is only for Educational purpose and does not constitute any financial advice. Do your Own Research.
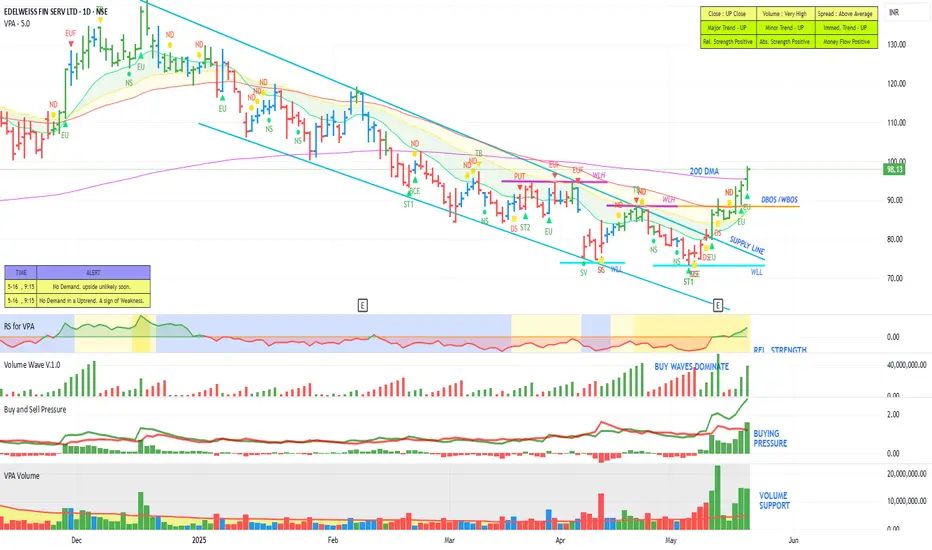
EDELWEISS - Setting up for a good up move?One more interesting chart for study. This stock was pushed down from the top by almost 50%. As you can see, as the stock was dropping, the buy waves were getting stronger and stronger and they started dominating. As you can see, now it seems to be on the recovery path. It has gone above the supply line and moved past the short-term moving averages and also the 200 DMA. We can see marked increase in the buying pressure. Also, there is a very good volume support coming here. The Relative Strength and Money Flow are positive. Now we can see that there is a break of structure in both daily and weekly as well. The stock seems to be getting ready for a good up move and could see 140 levels as a minimum. But at this juncture, we could see a retest of the 200 DMA levels before moving up further.
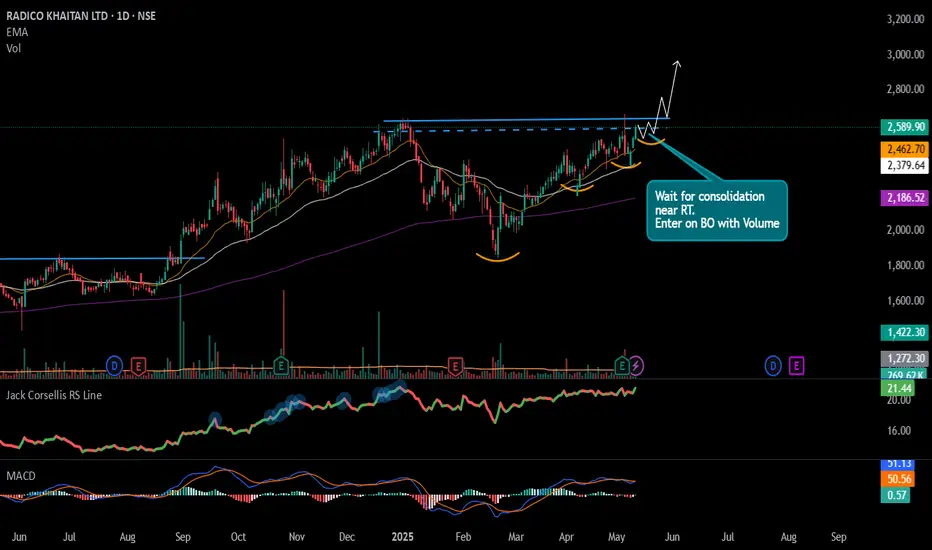
#RADICO - Potential Breakout Keep in WL📊 Script: RADICO
Key highlights: 💡⚡
📈 Roiunding Bottom Pattern / VCP Set up in Daily Time Frame.
📈 Wait for price consolidating near Resistance.
📈 Can Enter on BO with Volume spike or Wait for Pullback
📈 MACD Nutral
📈 One can go for Swing Trade.
BUY ONLY ABOVE NA DCB
⏱️ C.M.P 📑💰- 2589
🟢 Target 🎯🏆 – NA%
⚠️ Stoploss ☠️🚫 – NA%
️⚠️ Important: Market conditions are Okish, Position size 50% per Trade. Protect Capital Always
⚠️ Important: Always Exit the trade before any Event.
⚠️ Important: Always maintain your Risk:Reward Ratio as 1:2, with this RR, you only need a 33% win rate to Breakeven.
✅Like and follow to never miss a new idea!✅
Disclaimer: I am not SEBI Registered Advisor. My posts are purely for training and educational purposes.
Eat🍜 Sleep😴 TradingView📈 Repeat 🔁
Happy learning with MMT. Cheers!🥂
#AVANTIFEED - Multi Year Breakout Candidate📊 Script: AVANTIFEED
Key highlights: 💡⚡
📈Multi Year Breakout
📈 VCP in Weekly Time Frame
📈 BO with Volume in Daily Time Frame
📈 MACD gave a Bounce
📈 Price consolidated for 6 Years
📈 One can go for Swing Trade
⚠️ Over All Market condition is bad, Practice paper trading
🟢 If you have any questions regarding the setup, please feel free to leave your inquiries in the comments, and I will respond promptly.
BUY ONLY ABOVE 800 DCB
⏱️ C.M.P 📑💰- 786
🟢 Target 🎯🏆 – 30%
⚠️ Stoploss ☠️🚫 – 15%
⚠️ Important: Always Exit the trade before any Event.
⚠️ Important: Always maintain your Risk & Reward Ratio.
✅#Boost, #Like & #Follow to never miss a new idea! ✅
Disclaimer: I am not SEBI Registered Advisor. My posts are purely for training and educational purposes.
Eat🍜 Sleep😴 TradingView📈 Repeat 🔁
Happy learning with MMT. Cheers!🥂

GANESH HOUSING ON THE VERGE MAKING NEW ATHThe stock has seen a great bull rally even though the index was in the declining phase but this stock has outperformed the index ,since there is a bullish sentiment in the current market this stock might see a good upside movement .
View negates below 1315.00

CUBEX TUBINGS NEAR ALL TIME HIGH BREAKOUT (Positional Trade)The stock has seen great retracement from its Low of 79.95 on the verge of breaking its ATH and a 9 month long resistance from which stock has been in a consolidation zone for a while and in last 3 weeks stock has seen a good buying rally towards its resistance level , the stock can be bought every pull backs .and might seen a long term target off 162/213/240+ , the stock view neglected below 80.

Nifty / Small Cap 100Hello & welcome to this analysis
The relative strength of Nifty vis a vis Small Cap index is showing signs of a reversal from its slanting trend line after a period of 56 months of underperformance.
What does relative strength (RS) signify?
It suggests whether the underlying financial asset (in this case Nifty) is outperforming or underperforming against another financial asset (in this case Small Cap 100)
It means, in case of this RS slanting upwards
In rallies Nifty will do better than Small Cap 100
In corrections Nifty will fall less than Small Cap 100
If we go by the past reference as plotted, then a big reversal could be happening in terms of time for a period of 2 years at least. The horizontal lines as marked are trigger levels one needs to review.
Investing in Large caps (Nifty) appears safer than Small caps from here onwards unless this flips and continues to decline.
All the best with your investing & trading decisions

PSU BANKSHello & welcome to this analysis
PSU Banks which had been outperforming Private Banks and the broader market since 2020 have since June 2024.
It has for now stopped the lower high formation, for more strength it needs to sustain above 7250 and confirm a higher low formation.
Happy Investing & Trading

JKPAPER#JKPAPER
Bounced from the Supply turned demand zone.
Volume is looking good.
Relative strength turned positive
Expecting a good return in the next few weeks.
Stop loss below the swing low or low of the last candle i.e. 444.75

RELIANCE Levels // 4 HOURHello Everyone 👋
Employee Stock Option Plans (ESOPs): Ahead of its anticipated initial public offering (IPO), Reliance Retail granted ESOPs worth ₹351 crore to 15 senior executives during the last financial year. The company issued 4.417 million shares at ₹796.5 per share to top-level employees, demonstrating its commitment to retaining and rewarding key leadership.
Reliance Retail, owned by Mukesh Ambani, is India’s largest retailer, serving 304 million registered customers and welcoming over 1.06 billion footfalls across its stores in the financial year 2023-24. Its diverse portfolio spans grocery, consumer electronics, fashion, lifestyle, and pharmaceuticals. Notable brands under Reliance Retail include Smart Bazaar, 7-Eleven, Fresh Signature, Freshpik, Netmeds (pharma), Tira (beauty), Reliance Digital, MyJio Store (electronics), and retail chains like Trends, Reliance Jewels, and Hamleys.

CIGNITITEC - 4 Months Consolidation / Retracement BreakoutCigniti Technologies Ltd
1) Time Frame - Monthly.
2) The Stock had given an All time high breakout & It has been in a Consolidation since (November, 2023). Now It has given a Consolidation breakout & Closed above it's (November, 2023) High with good bullish momentum candle in Weekly Time Frame. One can consider entering here with weekly TF or Should wait for the strong monthly close above (1204).
3) The stock may find It's next resistance around the (price 1510) in short term.
4) Ev en though the MidCap and SmallCap index were showing weakness in the past week the stock had shown some relative strength and managed to sustain above it's 21 day moving average. Since It's a 3500 Cr Market Cap stock, One need to be cautious & should keep the Stop Loss tight In case of any sudden selling in the stock.
5) Recommendation - Consider Buying it with tight Stop Loss.

Stock Selection Based on Relative StrengthHello,
Here i will be talking about the process for picking up the stocks based upon the Relative Strength. As this is known to everyone but only few are getting benefitted by applying it in real trading. Most of the gains are made with the stocks having greater RSI. If RSI having > 75 those are the ones which create maximum wealth in Short time. Now, Question comes at what time frame it will apply and this depend upon the individual trading style. It works well on Daily, Weekly, and Monthly TF. The higher the timeframe the better the reward. This can be combined with the Price and Volume, It Can do wonder in your trading Journey.
Screener for Stock Selection in Trading View:-
- Go to Stock Screener Tab at bottom in the Tradingview.
- Go to Filters
- Symbol Type - Common Stock
- Select New 52 Week High
- Select Relative Strength Index (14) >=75
The above will filter out stocks on Daily Timeframe. You can add more filters according to your requirements and make your stock list more refine such as All Time High, New 6 Months high etc. and Make a list and look for opportunity.
As i am a Price Sction trader i mix this with Price and Volume and ride the momentum.
Few examples - Cupid, Glaxo
You can try it and submit your feedback to me. Also, Tell me if you find something else which can be useful to the community. Together we can help eachother in Learing and excel in profession.
Remember: I am a Price Action Trader and use Price and Volume together with different Timeframes, including RSI, and market conditions. To get best result always wait for confirmation. Focus on Risk Management and Position sizing.
Treat trading like a business and it will pay you like a business…..!!
Hope this post is helpful to community
Thanks
RastogiG

HFCL - TRIANGLE BREAKOUTSL : 72
Target:110-120
1. High Volume
2. Momentum
3. Higher Relative strength
Add 50% now & 50% on pullback between 75-79

Easy way to spot change in characterIn this post, i discuss a simple way of when to start paying attention to a particular sector or a stock, with the example of IT sector
1) At point 1, as nifty is forming a bottom, IT is attempting to form a bottom as well, moving along with the index
2) As nifty continues to move higher, it forms a higher low at point 2, whereas IT has a big gap down and forms a lower low, clear underperformance.
3) at around point 3, this is the first time IT attempts to outperform the markets, printing a clear wide range candle, still underperforming overall. start paying closer attention once this happens
4) at point 4, nifty peaks and corrects, and IT falls along with the index, right from its previous resistance zones.
5) IT was a laggard, and continues to fall with the index, but after swing low, bounce back is of more magnitude, wide range candles are starting to form
6) point 6 is where we get clear confirmation of outperformance by IT index, as nifty forms a lower low, whereas IT forms a clear higher low. things are starting to change
7) even though IT remains in a stage 1 structure, signs of outperformance in the coming cycle are starting to show. when this happens, start going through individual stocks in the IT sector and prepare for the next cycle

Nifty Auto Sector AnalysisUpcoming Week / Days
Looks like Auto Sector is going to outperform
The formation of the Chart Nifty Auto Looks interesting
RSI is overbought zone, whenever RSI goes above 70 the tendency of the sector is to fall back & touch the 21/50 day EMA giving an ample opportunity to buy stocks in the sector
Though RS (Nifty) is above 0 still looking nice for an upmove
