Cummins India - Good Bullish MomentumKey Points:
- On daily TF this stock showing strong up move momentum from last 6 months
- RSI crossed 70 and above RSI MA
- All EMA crossed and good potential of up move
In Gujarati “ Bhav is Bhagwan ”
Disclaimer :
I am not a SEBI registered Analyst.
Please do your own Analysis before taking any trade/investment.
The above view is just for educational purpose only.
Relative Strength Index (RSI)

Jindal Stainless - Up move momentumKey Points:
- On daily and weekly chart strong bullish momentum seen with breaking ATH price & potential to have up move for short term
- RSI 74 crossed RSI MA of 62
- Volume above VMA
- Price crossed above 20,50,200 EMA
In Gujarati “ Bhav is Bhagwan ”
Disclaimer :
I am not a SEBI registered Analyst.
Please do your own Analysis before taking any trade/investment.
The above view is just for educational purpose only.

Suprajit Eng Ltd - Bullish BreakoutKey Points:
- On daily chart strong Bullish breakout momentum seen after a 305 days long Consolidation with potential to rise 15% to 20 % after crosses Rs. 395
- RSI crossed 70
- Tech showing buy signals
- Volume also crossed VMA
- Price is above 20,50,200 EMA
Bhav is “ Bhagwan ”
Disclaimer :
I am not a SEBI registered Analyst.
Please do your own Analysis before taking any trade/investment.
The above view is just for educational purpose only.

Nifty Bigger correction/crash in Medium TermNifty showing Bearish divergence wrt RSI as well as MACD on Weekly timeframe.
On Medium term this may signify a bigger correction incoming.
Nifty remains a buy in short term.

Asianpaints BullishAsianpaints Closing 2828.8 with stoploss 2770 then targets are 2890-3060-3150.
Buying Reason.
1 --> Price action is ready to break the #range.
2 --> #RSI is 52.38.
3 --> ADX is show the #Bullish move and +DMI is #RISE.
4 --> #Volume is also confirm the #Bullish move come in the some days.
5 --> Also On a #Monthly chart Price take #Support at #Bollinger #Band.

LT share analysis #harishwaveanalystLT share elliot wave analysis daily time chart complete upside 5 wave and 2 or 4 trendline break
price go down wave ABC
volume decrease
rsi decrase
macd negative

DEEPAKNTR BULLISHDEEPAKNTR closing 1812.05 with stoploss 1750 then targets are 1860-1900-1950+.
Buying Reason.
1 --> Price Bounce Back from the Strong Demand Zone.
2 --> RSI is also turn around from 40.
3 --> ADX is shwo the Bullish move and +DMI is rise.
4 --> 20 EMA is crossing then more up side open.
5 --> Volume is also show the Acclumation and there is the People Acclumate the Shares.

Persistant System - Bullish BreakoutKey Points:
- On daily chart strong Bullish breakout momentum seen with potential to rise from closing price of Rs. 4968
- 52 Week Resistance breakout @ 2873
- RSI near about 70
- Tech showing buy signals
- Price is above 20,50,200 EMA
Bhav is “ Bhagwan ”
Disclaimer :
I am not a SEBI registered Analyst.
Please do your own Analysis before taking any trade/investment.
The above view is just for educational purpose only.

Schaeffler India Ltd- Resistance BreakoutKey Points:
- On daily chart strong Bullish breakout momentum seen after down trend with potential of 12.50% rise from closing price of Rs. 2943
- Resistance breakout @ 2873
- RSI > 70
- Tech showing buy signals
- Price is above 20,50,200 EMA
- Volume is above VMA
Bhav is “ Bhagwan ”
Disclaimer :
I am not a SEBI registered Analyst.
Please do your own Analysis before taking any trade/investment.
The above view is just for educational purpose only

Long -Kotakbreakout + fibo + rsi
showing kotak targets at
1795-1800-1810
disclaimer - trade @ own risk

Info share Elliot wave Analysisthis stock all time high correct 5 wave . if any stock ya price go down 5 wave indicate zig zag correction and price move upside corrective wave A,b,c and price again go down 5 wave

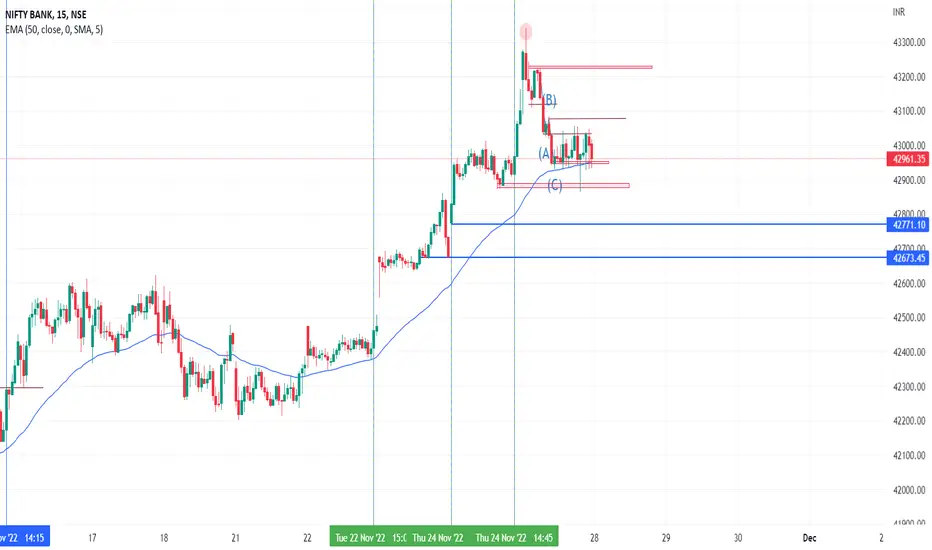
bnf viewbnf at crucial level
looks all good to rise further
theory based on rsi + suppot resistance
disclaimer - trade @ own risk

Buy ShreecemBuy shreecem closing is 24420.95 with stop loss 23960 then targets are 25000-25800-27000.

'GOLDIAM' ready to boom like 'GOLD' !!!We all have witnessed the bombastic rally of Gold & Silver, now it seems that companies
that are engaged in business related to gold & silver are going to buzz.
Let's have a detailed overview of the stock in prominent timeframes.
Daily Timeframe: -
Goldiam has shown a breakout from a right-angled broadening wedge pattern which
was under construction for the last 4 months.
Thunder Volumes supports the breakout. Also, there is an RSI breakout which indicates the strength
of the stock.
All moving averages were been converged, and now slowly 20DEMA is diverging and crossing above all
important moving averages this indicates that the stock has finished the choppiness and is ready for a fresh move.
Weekly Timeframe: -
Goldiam is breaking from a time-long consolidation phase after base building formation.
Record Volumes this week indicate strong interest in market participants.
RSI is also given a breakout from a channel and now sustaining above 60 which confirms the strength.
My Observation: The only thing to ponder is the Daily RSI is at 79, and Goldiam has shown a continuous move of almost 20% in the last 4 days, so I must suggest
to deploy 50% position now and wait to cool off i.e. accumulate around 155-150 which is the breakout level.

ONGC Buying In 1 HourONGC is in 1 Hour in timeframe create the Cup & Handle pattern and breakout and one more reason to buy RSI is above 60.


Bearish RSI divergence in GLENMARKAs seen in today's trading session, GLENMARK stock is trading in bearish RSI divergence pattern, so reversal entry will take new high level of 445- and its short reversal target can be upto below 420 level.

ultracement longterm buyultratech cement
buy 7000
stoploss 6800
target 7800
ultratech cement multi pattern breakout

Trend line with RSI and MACD back test trend line with RSI and MACD and cross over 60 in 15 min and 5 min best result....
FCPO | End of downsideFCPO has been on the downside for an extended period, corrected huge.
now we are looking for upside movement.
as one can see RSI is also supportive, it may turn upside anytime soon.

NATIONAL ALUMINIUM COMPANY LTD - SMA Crossover + Double Digit 📊 Script: NATIONALUM (NATIONAL ALUMINIUM COMPANY LIMITED)
📊 Nifty50 Stock: NO
📊 Sectoral Index: NIFTY 500 / NIFTY METAL / NIFTY MIDCAP
📊 Sector: Commodities - Metals & Mining
📊 Industry: Non - Ferrous Metals - Aluminium
Key highlights: 💡⚡
📈 Script is trading at upper band of Bollinger Bands (BB) and giving breakout of it.
📈 MACD is already giving crossover.
📈 Double Moving Averages also giving crossover.
📈 Volume is increasing along with price which is volume breakout.
📈 Current RSI is around 63.
📈 One can go for Swing Trade.
⏱️ C.M.P 📑💰- 77.95
🟢 Target 🎯🏆 - 88
⚠️ Stoploss ☠️🚫 - 72
⚠️ Important: Always maintain your Risk & Reward Ratio.
⚠️ Purely technical based pick.
✅Like and follow to never miss a new idea!✅
Disclaimer: I am not SEBI Registered Advisor. My posts are purely for training and educational purposes.
Eat🍜 Sleep😴 TradingView📈 Repeat🔁
Happy learning with trading. Cheers!🥂

INGERSOLL RAND LTD - Multiple Indicator 📊 Script: INGERRAND (INGERSOLL RAND (INDIA) LIMITED)
📊 Nifty50 Stock: NO
📊 Sectoral Index: NIFTY INFRASTRUCTURE
📊 Sector: Industrials - Capital Goods
📊 Industry: Industrial Products - Compressors & Pumps
Key highlights: 💡⚡
I have used 4 indicators which is as follow:
1. Bollinger Bands (BB)
2. MACD
3. RSI
4. MOVING AVERAGE CROSSOVER
📈 Script is trading at upper band of Bollinger Bands (BB) and giving breakout of it.
📈 MACD is giving crossover.
📈 Double Moving Averages also giving crossover.
📈 Current RSI is around 67.
📈 One can go for Swing Trade.
⏱️ C.M.P 📑💰- 2292
🟢 Target 🎯🏆 - 2475
⚠️ Stoploss ☠️🚫 - 2194
⚠️ Important: Always maintain your Risk & Reward Ratio.
⚠️ Purely technical based pick.
✅Like and follow to never miss a new idea!✅
Disclaimer: I am not SEBI Registered Advisor. My posts are purely for training and educational purposes.
Eat🍜 Sleep😴 TradingView📈 Repeat🔁
Happy learning with trading. Cheers!🥂

ADANI ENTERPRISES LIMITED - Volume Breakout + Bullish on Chart📊 Script: ADANIENT (ADANI ENTERPRISES LIMITED)
📊 Nifty50 Stock: NO
📊 Sectoral Index: NIFTY 500 / NIFTY METAL / NIFTY NEXT 50
📊 Sector: Commodities Metals & Mining
📊 Industry: Metals & Minerals Trading
Key highlights: 💡⚡
📈 Script is trading at upper band of Bollinger Bands (BB) and giving breakout of it.
📈 MACD is giving crossover.
📈 Double Moving Averages giving crossover.
📈 Volume is increasing along with price which is volume breakout.
📈 Current RSI is around 67.
📈 One can go for Swing Trade.
⏱️ C.M.P 📑💰- 3575.70
🟢 Target 🎯🏆 - 3885
⚠️ Stoploss ☠️🚫 - 3417
⚠️ Important: Always maintain your Risk & Reward Ratio.
⚠️ Purely technical based pick.
✅Like and follow to never miss a new idea!✅
Disclaimer: I am not SEBI Registered Advisor. My posts are purely for training and educational purposes.
Eat🍜 Sleep😴 TradingView📈 Repeat🔁
Happy learning with trading. Cheers!🥂
