Reliance Intraday for 11th Aug 2022Key Reference Point for Reliance11th Aug 2022.
I am not a Sebi Registered. This is for education and research purposes.
Relianceindustries

Reliance for tomorrow 10th Aug 2022Key Reference Points for Reliance for tomorrow 10th Aug 2022.
I am not Sebi registered. This idea is for education and research purposes.

RELIANCE READY FOR 3000it is making hh-hl formation in monthly time frame & it is currently at demand zone in monthly time frame ; ready for 3000 ; keep on track

Reliance Fut for TomorrowKey Reference Points for Reliance Futures for tomorrow i.e. 7th Aug 2022.
These Reference Points can help one to initiate or exit a trade.
I am not Sebi registered.
This is for education and research purposes.

Reliance Intraday for 5th Aug 2022Reference Points
VAH - 2588
POC - 2562
VAL - 2550
PDL - 2538
PDH - 2616
One can Trade on Breakout of the range of 2588 and 2550 or Trade Reversal at PDL i.e. 2538 or VAL i.e. 2550 and VAH i.e. 2588.
I am not SEBI Registered. This is just an idea. I won't be liable if someone loses money because of this idea.
This is just for education and research purposes.

Reliance Intraday and positional setupLong above 2600, SL 2588
Short below 2588, SL 2610
Please use the lines as resistance and support for your trades

Reliance to take the market up. GO GO GO!!!Reliance industries aiming to hit the range top again Target 2800-2850


IS RELIANCE GETTING READY FOR 400 POINTS FALL?Double Top has been formed on daily chart and Reliance looks good to sell if sustains below 2360 for the Target of 2000 - 1920.
To motivate us, Please like the idea If you agree with the analysis.
Happy Trading!
InvestPro India Team

This Star Share Is Looking BearishFrom last few trading sessions we are witnessing a big upside rally in broad market.
Nifty 50 from low, made on 22 june recovered +7.5%.
It is surprising that Nifty's most treatable player not recovered more than 3 % from recent lows.
On technical side
1) The inverted flag pattern is showing a short term down trend,
2) Prices are trading below 200 day moving average,
3) Reliance is not participating with broad market bull rally
4) Bad news (described below)
5) The support level it is holding is very crucial for trend change in medium term.
-----------------------
Big Bad News
We have seen that how crude oil market of india got a boot by deregulation of prices. But suddenly after few days Govt. Increased taxes on diesel and petrol export significantly to curb the windfall gains of oil producing and refinery companies.
- The government imposed a Rs 6 per litre tax on exports of Petrol and Rs 13 per litre on exports of Diesel.
- The government also imposed Rs 23,230 per tonne tax on domestic crude oil to take away windfall gains accruing to producers.
-----------------------
Now what do you think who will impact the most from this modi govt. move. ?
Reliance yes your guess was correct because, reliace jamnagar two refineries were the top refineries of India with refining capacity of more than 35 MT.
- Reliance Jamnagar plant can process 1.36 million barrels of crude a day from two refineries, reliance surpassed all the refineries in the year of 2002 – 2003 in terms of volume processing and become biggest Indian Refiner.
- Reliance export 80% of its output from Jamnagar refineries.
-----------------------
Reliance was reaping the inflated prices of crude products. This move can decrease the margins significantly.
----------------------
NOTE : Quarterly results are scheduled this friday, so keenly watch the price movement and OI data.


All Set to Sell Reliance IndustriesTriangle Pattern Formation seen on 4-Hourly chart, Stock is trading below 200 Days EMA. Below 2380 We may sell off in RELIANCE FUT

RELIANCE INDS - Expected support lvlReliance Inds forms Descending triangle pattern in 4hrs time frame. keep concentrate if price break below 2380, It will move downwards to the mentioned support level of 2320.

Reliance - Intraday Levels for 13 July 2022Reliance Intraday Levels for Tomorrow..
Trend : Bullish
Sentiment : Negative
Expectation : Bearish Reversal
Expecting trend reversal in Reliance on the lower side, as many resistance out there. 2364 Will be Strong Support in between 2403 - S1 and PDL will act as support for tomorrow
Refer the chart for detailed Intraday Support and Resistance levels.
Happy Trading!!


Reliance industries good entry point Take the long position on reliance industries within period of 2-3 months, reliance can reach a new high of 3300.
Disclaimer: I am not SEBI registered analyst

RELIANCE is bearish Chart looking bearish & also the Ai is telling bearish positionally swing trade lets see how its going to react in coming days

RELIANCE : IS IT RIGHT TIME TO EXIT?Reliance after making big move & has reached to upside & formed ascending channel & showing some weakness on daily timeframe. I would definitely won't trade on this. Best time to stay away & wait to see further movement.

Best stocks to trade on 4 July with Logic | Index analysisI daily make market analysis videos and posts on Financial markets
Disclaimer: The information provided is for educational purposes only. Our intention is not to provide any financial advice, don't take any decision without consulting your financial advisor

Reliance Parallel Channel Strong Confluence Circle I daily make market analysis videos and posts on Financial markets
SR means Support and Resistance
PC means Parallel Channel
Disclaimer: The information provided is for educational purposes only. Our intention is not to provide any financial advice, don't take any decision without consulting your financial advisor.

Reliance industry is so week It's seem like a big fall to come in reliance industries, if it's going to break the channel.
Keep eyes on this stock.


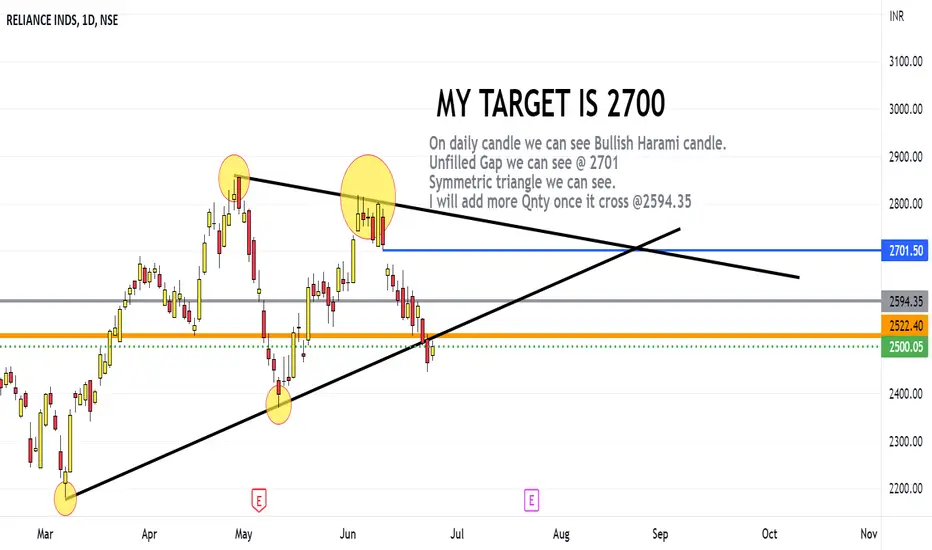
Reliance Chart analysisOn daily candle we can see Bullish Harami candle.
Unfilled Gap we can see @ 2701
Symmetric triangle we can see.
I will add more Qnty once it cross @2594.35