BUY TODAY SELL TOMORROW for 5%DON’T HAVE TIME TO MANAGE YOUR TRADES?
- Take BTST trades at 3:25 pm every day
- Try to exit by taking 4-7% profit of each trade
- SL can also be maintained as closing below the low of the breakout candle
Now, why do I prefer BTST over swing trades? The primary reason is that I have observed that 90% of the stocks give most of the movement in just 1-2 days and the rest of the time they either consolidate or fall
Resistance Breakout in RAIN
BUY TODAY SELL TOMORROW for 5%
Resistancebroken

BUY TODAY SELL TOMORROW for 5%DON’T HAVE TIME TO MANAGE YOUR TRADES?
- Take BTST trades at 3:25 pm every day
- Try to exit by taking 4-7% profit of each trade
- SL can also be maintained as closing below the low of the breakout candle
Now, why do I prefer BTST over swing trades? The primary reason is that I have observed that 90% of the stocks give most of the movement in just 1-2 days and the rest of the time they either consolidate or fall
Resistance Breakout in SMCGLOBAL
BUY TODAY SELL TOMORROW for 5%

BUY TODAY SELL TOMORROW for 5%DON’T HAVE TIME TO MANAGE YOUR TRADES?
- Take BTST trades at 3:25 pm every day
- Try to exit by taking 4-7% profit of each trade
- SL can also be maintained as closing below the low of the breakout candle
Now, why do I prefer BTST over swing trades? The primary reason is that I have observed that 90% of the stocks give most of the movement in just 1-2 days and the rest of the time they either consolidate or fall
Resistance Breakout in RAMASTEEL
BUY TODAY SELL TOMORROW for 5%

BUY TODAY SELL TOMORROW for 5%DON’T HAVE TIME TO MANAGE YOUR TRADES?
- Take BTST trades at 3:25 pm every day
- Try to exit by taking 4-7% profit of each trade
- SL can also be maintained as closing below the low of the breakout candle
Now, why do I prefer BTST over swing trades? The primary reason is that I have observed that 90% of the stocks give most of the movement in just 1-2 days and the rest of the time they either consolidate or fall
Resistance Breakout in MTARTECH
BUY TODAY SELL TOMORROW for 5%

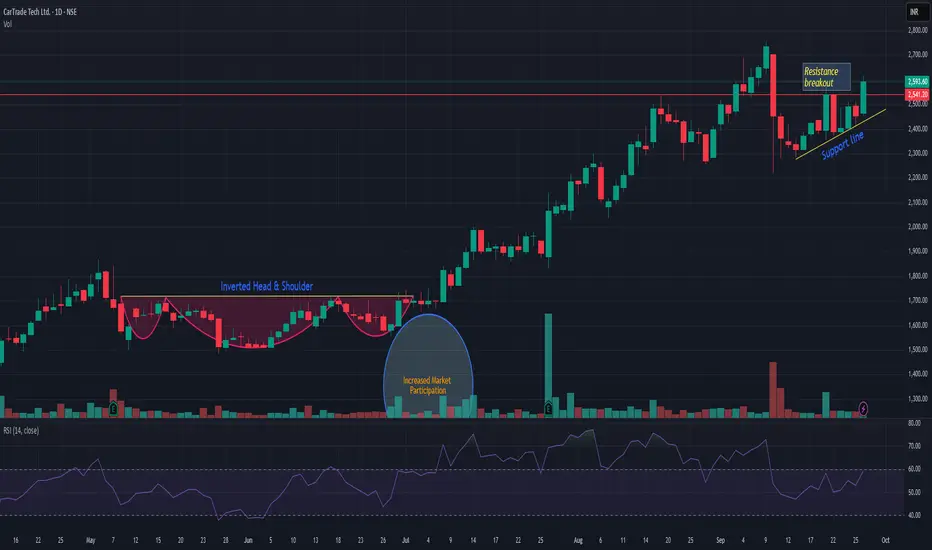
CARTRADECARTRADE is trying to come out from consolidation zone. Consolidation after good uptrend is a very good accumulation zone. Volume spike is also observed. There is v high probablity that the stock will resume its rally. So now as long as it is trading above support line it may give good bounce from current level. Keep it on radar.
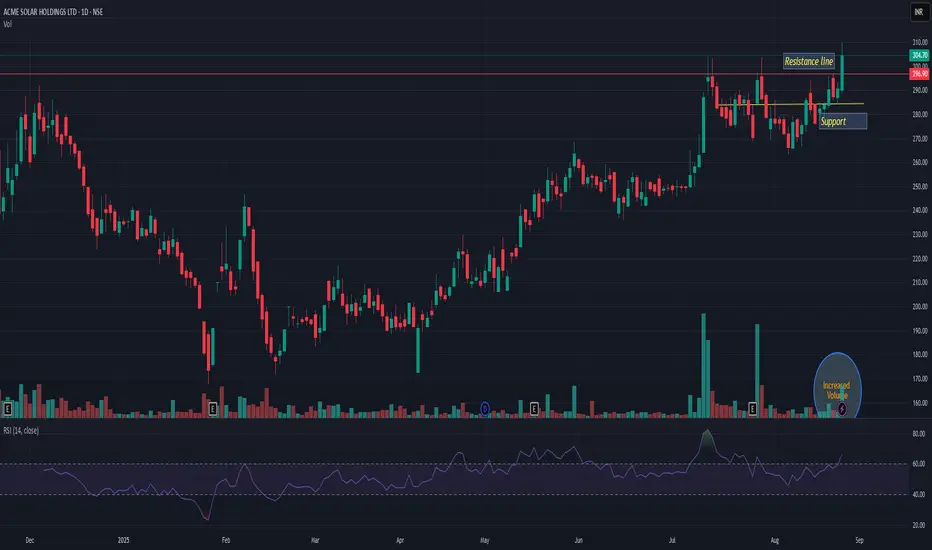
ACMESOLARACMESOLAR giving resistance breakout with decent volume. Support is near 280. Seems like this may take a new ride; trading at ATH. Very high probability that it can add up 12-15% from current level. Its very good risk-reward trade. Keep in yr watchlist
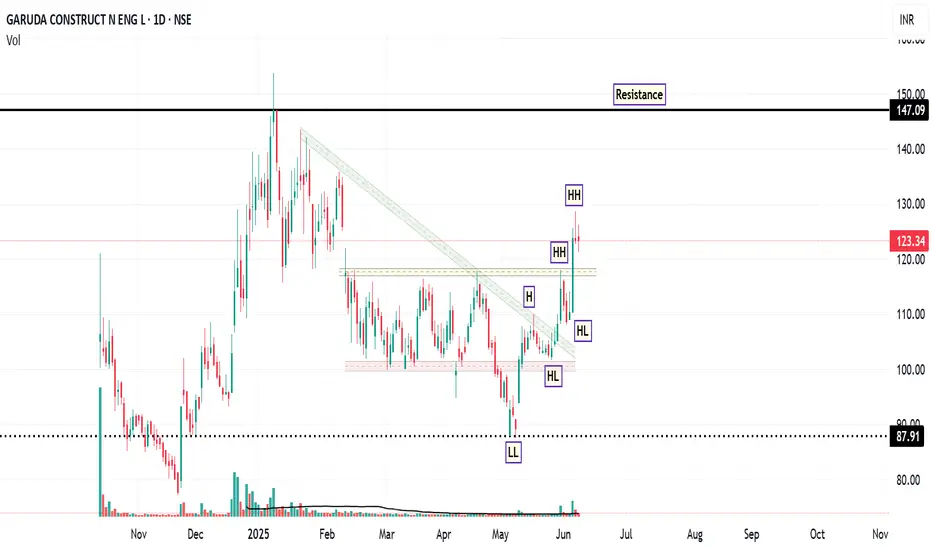
Garuda: Riding the Momentum WaveFrom February to late May 2025, the stock of GARUDA was trading in a sideways consolidation range, roughly between ₹100 (support) and ₹115-₹120 (resistance). The recent powerful green candles have shattered the upper boundary of this range. Also, the most significant event on the daily chart is the decisive breakout from a descending trendline that had capped prices. Also, LL and HH formation observed on daily chart.
The breakout was accompanied by a significant spike in volume ( 862.88K shares ), which is substantially higher than the average volume during the consolidation period. High volume on a breakout lends strong credibility to the move.
The RSI is at a strong 69.20 . It is in bullish territory and rising, indicating strong buying momentum. It is approaching the overbought region (>70), but is not there yet, leaving room for further upside before becoming extended.
If the stock consolidates above the ₹120-₹121 support level. Buyers step in on any minor dip till ₹118 , and the price then continues its upward trajectory towards the resistance targets of ₹129 and subsequently ₹149 .
Disclaimer: This technical analysis is for informational purposes only and should not be considered as financial advice. Trading in the stock market involves risk. Always conduct your own research and consult with a qualified financial advisor before making any investment decisions.
HEUBACHINDHEUBACHIND is trying to come out of long consolidation zone of almost a quarter with decent volume. Already above R-1 around 555 and trying to go above R-2 around 573. If successfully close above R-2 then there is v high probability that it can do wonder! Keep it in yr watchlist.

TEXRAIL: Technical Signals Point to 20% PotentialThe chart provides a comprehensive overview of the key breakout levels and potential upward movement scenarios.
symmetrical triangle Breakout
RSI is above 60 and showing an upward trend
Surpass the hidden resistance and establish it as support
Disclaimer: The information contained in this technical analysis report is intended solely for informational and educational purposes. It should not be interpreted as financial advice or a recommendation to buy or sell any security. Investors are strongly encouraged to conduct their own research and consult with a qualified financial advisor before making any investment decisions.

OLAELECOLAELEC giving cup & handle breakout with decent volume. Showing consolidation phase since last 8-10 session. And now above 100 it should take a next drive. It has a potential to increase upto 20% in near future as per chart pattern. Keep it on radar.

Muthooth Finance 1 dBullish view
Resistance Broken
RSI > 60 in daily weekly monthly time frame
Volume rising

Rising Channel Respecting 50 EMA Breaking Crucial LevelsNSE:SHAILY is Breaking Crucial Levels on Daily Charts Respecting the 50 EMA in a Rising Channel Formation with Volumes Significantly Increasing. Keep in Watchlist.
Disclaimer: This analysis is intended solely for informational and educational purposes and should not be interpreted as financial advice. It is advisable to consult a qualified financial advisor or conduct thorough research before making investment decisions.

CCLCCL showing very good strength in recent session. and now its trading above resistance zone. Today's volume also very decent. Probability of new run is quite high. Taken support near 20 MA and again gone up. Keep it on radar.

MASTEKMASTEK is coming out of long accumulation zone and given a resistance breakout. Increased market participation also observed in recent time. Seems its ready for next run... Keep it on radar

DLF... 25% upside potentialDLF has come out of 7 months of consolidation and has broken the resistance trendline.
A decent upmove of about 25% is expected over the next 2 to 3 months.
Stoploss below the trendline.

LLOYDSME LONG 780-800 Breakout of resistance & successful retestI bought some LLYODSME at 800.
Short-term Target: 852
Long-term Target: 932
STOP-LOSS: Follow for SL updates.
Disclaimer: I am not SEBI certified, and this is not financial advice. Always conduct your own research before making any investment decisions.

VIPINDVIPIND has given resistance breakout with decent volume. Market participation in recent days also increased. Crossed 200MA today. Keep it on radar.


TATATECH: Potential Bullish Breakout + Inverse Head & ShoulderBullish Analysis of TATA TECHNOLOGIES LTD
Key Observations:
1. Pattern Identified: Inverse Head & Shoulders
- The inverse head and shoulders pattern suggests a bullish reversal.
2. Resistance Zone:
- The stock is approaching a key resistance zone.
- A breakout above this zone could signal a strong upward movement.
3. Target Projections:
- If the breakout happens, the first target is set at ₹1,263, followed by ₹1,333.
4. Volume:
- Recent volume spikes indicate strong buying interest, supporting the potential breakout.
5. RSI:
- Currently at 60.91, it indicates strength, but still below the overbought zone, allowing room for upward movement.
Conclusion:
- Entry Point: A breakout above ₹1,093 can be a bullish signal.
- Targets: ₹1,263, ₹1,333.
- Risk: Watch for failure to break the resistance zone, which may signal a short-term pullback.
Follow us for STOP-LOSS updates.
Note: Always consider risk management and market conditions before making investment decisions.


ANIKINDS - All Time High BreakoutResistance line since 2009 and price breaks the same this month.
Stoploss - 65 Rs
Entry - Good Time to Enter
First Target - 90 Rs
Second Target - 100

IREDA Analysis!NSE:IREDA Analysis on a Daily Timeframe!
Triangle Pattern Formation in IREDA!
Triangle Pattern Breakout in IREDA!
Analysis:
As we can see the stock in moving in a triangle since December 2023. It was continuously consolidating in it. On 27th June it tried breaking out the resistance but unable to sustain above the resistance. Today again it has been successfully given the breakout and able to close above the breakout. As i marked all the important levels on the chart please have a look.
Trade Setup:
Entry = Current price level is good to Enter
Key Level = 214.80 This is the All Time High Level, Price may reverse from this level but if it breaks, will the major uptrend
Target = 455.85
Stop Loss = Below 173 or as per your Risk To Reward
Disclaimer = Consider my analysis for Educational Purpose only.
Before entering into any trade -
1) Educate Yourself
2) Do your research and analysis
3) Define your Risk to Reward ratio
4) Don't trade with full capital

IFBIND / IFB INDUSTRIES LTD - 3 Years Downtrend Channel BreakoutIFBIND
1) Time Frame - Weekly.
2) The Stock has been consolidating in a downtrend channel since 2021 & Now It has given a 3 years Downtrend breakout with huge volume & strong bullish candle close in weekly.
3) The next target / resistance would be its previous life time high (1546.95 - 24.5% from the current price 1241.95).
4) Recommendation - Strong Buy
