BUY TODAY SELL TOMORROW for 5%DON’T HAVE TIME TO MANAGE YOUR TRADES?
- Take BTST trades at 3:25 pm every day
- Try to exit by taking 4-7% profit of each trade
- SL can also be maintained as closing below the low of the breakout candle
Now, why do I prefer BTST over swing trades? The primary reason is that I have observed that 90% of the stocks give most of the movement in just 1-2 days and the rest of the time they either consolidate or fall
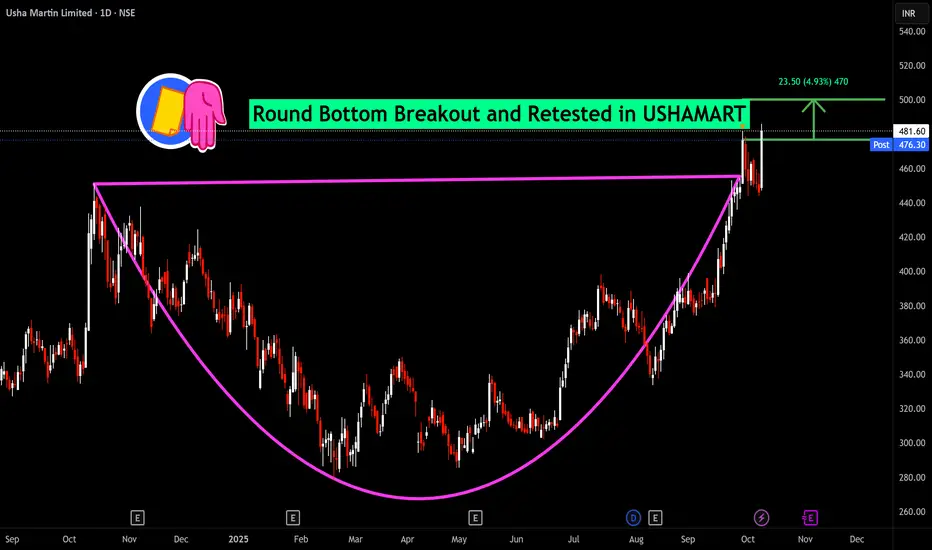
Round Bottom Breakout and Retested in USHAMART
BUY TODAY SELL TOMORROW for 5%
Retested
Cup and Handle Breakout and Retested in NYKAANykaa triggers a textbook cup-and-handle breakout on the daily chart, followed by a clean retest that flips resistance into support and signals continuation potential toward the measured move. The 28 Oct 2025 257.5 CE premium surges alongside, reflecting bullish momentum but remains sensitive to decay if price slips back below the neckline

BUY TODAY SELL TOMORROW for 5%DON’T HAVE TIME TO MANAGE YOUR TRADES?
- Take BTST trades at 3:25 pm every day
- Try to exit by taking 4-7% profit of each trade
- SL can also be maintained as closing below the low of the breakout candle
Now, why do I prefer BTST over swing trades? The primary reason is that I have observed that 90% of the stocks give most of the movement in just 1-2 days and the rest of the time they either consolidate or fall
Round Bottom & Retested Breakout in
HEMIPROP
BUY TODAY SELL TOMORROW for 5%

AKZO NOBLE it has perfectly retested the old breakout zone
entry and stoploss mention on charts
chart is in bullish formation
this is for learning purpose only.
one can always analyse before entering the trade.

Cup and handle breakout in Powergrid!Powergrid is a portfolio stock with good dividend yield and strong fundamentals.
The stock has given a breakout of cup and handle pattern with neckline of 250. The retest of the same is completed as well.
Stock can give good returns with minimum target of 300. SL can be below 246 DCB.
Idea is shared for educational purposes and should not be considered as a recommnedation.

Mana coin-Downside flag breakoutMana coin is making a flag pattern in 4h timeframe.The flag once broke out earlier,now it is retesting from the trendline and can fall downside to the next support.If high volume bear candles form on the chart,then a short trade can be initiated downside.Supports are marked there on the chart.


Granules India Ltd - trendline breakoutGranules India Ltd - trendline breakout
StopLoss @ 364
Target 1 @ 402
Target 2 @ 426

Orchid Hotels Limited - Triangle pattern breakout & RetestedOrchid Hotels Limited - Triangle pattern breakout & Retested
StopLoss @ 65
Target 1 @ 93
Target 2 @ 101

Restested and looking for good up movestock has rested after a breakout, now there is a possibility its can move up
note:
This is just my point of view, please recheck and take your trade accordingly

Morepen Laboratories Limited - Trendline breakout & RetestedMorepen Laboratories Limited - Trendline breakout & Retested
StopLoss below the trendline
Target 1 @ 72
Target 2 @ 98

Jindal Saw Limited - Channel pattern breakout + Resistance breakJindal Saw Limited - Channel pattern breakout + Resistance breakout
Retested
StopLoss @ 97
Target 1 @ 131
Target 2 @ 173

Centum Electronics Ltd. - Trendline breakoutCentum Electronics Ltd. - Trendline breakout
StopLoss @ 453
Target 1 @ 575
Target 2 @ 778

Avanti Feeds Ltd - Trendline breakoutAvanti Feeds Ltd - Trendline breakout
StopLoss @ 566
Target 1 @ 728
Target 2 @ 978

JK Tyre & Industries Ltd. - Cup & Handle Pattern breakoutJK Tyre & Industries Ltd. - Cup & Handle Pattern breakout
Retested
StopLoss below trendline
Target @ 185

Death crossover done, what next in Bitcoin?Technical analysis:
Welcome to this quick update everyone,
In Daily timeframe Chart, Death Cross Confirmed in 1D Chart ✅
So far Bitcoin is Moving Inside the 34-41k S/R Range..
RSI indicator is Making Lower Highs Since 8th Jan (Downtrend)
If Daily candle Closed Below the 34.5k Support, Bitcoin Might Retest the 31k Horizontal Support Area 📉
A close above EMA200 (41k) invalidate the Death Cross‼️
❤️ If you find this helpful and want more FREE forecasts in Tradingview.
. . . . . Please show your support back,
. . . . . . . . Hit the 👍 LIKE button,
. . . . . . . . . . Drop some feedback below in the comment!
❤️ Your Support is very much 🙏 appreciated!❤️
💎 Want me to help you become a better Crypto trader?
Now, It's your turn!
Be sure to leave a comment; let me know how you see this opportunity and forecast.
Trade well, ❤️
#bitcoin #crypto #nextmove #bullmarket #sideways #btcusdt #dailyclosed #deathcrossover

Reliance Long (Double bottom breakout)Reliance has broken its double bottom neckline at 1207 & passed in retest now. Looks good for a long trade.

AIA Engineering 'Triangle Pattern' BreakoutAIA Engineering 'Triangle Pattern' Breakout
T1 @ 2078
T2 @ 2189
T3 @ 2299
StopLoss: below the trend line

Bhansali Engineering Polymers Ltd. breakout Bhansali Engineering Polymers Ltd. breakout from parallel channel pattern and retested
Stop Loss @ 196.50
Target @ 212

