Delta Corp : Long-Term Downtrend | Possible Reversal | Study📊 Analysis (Simple View)
Stock is in long-term downtrend since 2018.
Price is now near major support around ₹60–65.
This zone acted as strong base earlier.
RSI is oversold (~27) → selling pressure may be ending.
Price is near bottom of falling trendline.
🚀 Long-Term Opportunity
If ₹60 support holds:
Possible targets: ₹90 → ₹130 → ₹180
Good zone for slow accumulation (with risk control).
If ₹60 breaks:
Next downside: ₹50–₹40
📚 Study Summary
Trend: Bearish
Support: Strong
RSI: Oversold
Setup: High Risk – High Reward
📝 Note
This is for study only, not investment advice.
Wait for confirmation (above ₹90) for safer entry.
Reversal

IPCA Labs – Trend Reversal After Long ConsolidationNSE:IPCALAB has successfully transitioned from a downtrend into a bullish structure after months of sideways consolidation. The breakout above the falling trendline followed by a controlled pullback suggests accumulation.
As long as price holds above ₹1450, the trend remains positive and a fresh breakout above ₹1500 can open the door for further upside.

Bullish Reversal Setup - Simple & Practical GuideIntroduction to the Setup
In this educational post, we will discover a low-risk bullish reversal setup,
We all know that markets are dynamic & getting more and more efficient, and in such conditions, we also need to take a dynamic approach to the markets in different situations, you can't have a edge if you stick to only one setup in every market situation. For Example If you are a breakout trader then you will only look range breakouts but the current market situation is kind of end phase of A correction. So there you won't find stocks with good ranges building up for breakout At that point You either will have bad entries or either you need to wait for the range to build.
But here let's say you have another setup of reversal trading then you can find many good entries with low risk.
This setup a combination of price action and moving averages, Let's explore great setup in detail.
1. You need to identify the The trend
👉🏻Market was already in an uptrend.
👉🏻Higher highs and higher lows were present earlier.
Once you have identified a uptrend then you are ready to move to the second step.
2. Correction Phase – Healthy Pullback, Not Breakdown
👉🏻Price made a deep correction from the top.
👉🏻This correction came into the EMA support area.
👉🏻No panic selling, no long red candles exploding downward.
A correction should show signs of weakness when it reaches into 3rd step.
3. The Demand Zone
👉🏻 You need to find a area on the left side of chart (in uptrend) from where Massive up move has started.
👉🏻 On the chart you will find we have marked a rectangle box in blue color starting from the previous higher area, From this point the price has good up move Hence it's a demand zone.
👉🏻 When falling price reaches this area the price should react
by giving wicks from below in a candle or the size falling candle should reduce or some indecision candle form like Doji, spinning top etc.
4. Demand Zone Marking
👉 On the higher low you area you will find range candle just before the upmove bursts so that candle is used to mark the demand zone
5.EMA + Demand Zone = Support Cluster
👉Price reacts exactly where EMA support and demand zone overlap.
👉This zone is where buyers previously stepped in.
👉Market is basically saying: “This area still matters.”
⭐️ One support is weak. Multiple supports together are strong.
6. Holding demand zone
👉🏻After touching demand, price does NOT make a lower low.
👉🏻Instead, it forms a higher low.
👉🏻This is the first real signal that sellers are losing control.
7. Entry Action
👉🏻 Usually when the price hit demand zone and it forms few bullish candles, it tries to retest the demand zone once again but this time it reverses a little above from demand zone at that time you need to act and place your buys.
8. Setting The Stoploss
👉🏻 The stop loss is below the demand zone, If the demand zone fails to hold the prize then you will get a very early exit, Usually these kind of entries have 1% to 2% of stop loss because we do not want to trade any demand zone which is bigger than 2%
9. The Reward
👉🏻 In a reversal setup you at least need to maintain 1:2 risk to reward ratio.
👉🏻 Pay attention last Higher High Zone From where this correction has started That point will be called as a supply zone and there also you will find range bar just the starting of down move so that supply zone is the maximum target that you need to aim for.
👉🏻 Make sure that the last supply zone is not too near from your entry you need to give price some room to make movements.
Practice Time - With Live Examples🗒
This is HOSE:TVS motor 1h chart and we have applied a 200 EMA.
First you will find a very good uptrend then a pullback that has stopped for the first time just above 200 EMA and then it gave a very good high making new swing high then it corrected down into the last reversal area which we have marked as a demand zone and there 200 EMA is also acting as a support so we have a very good cluster of supports there,
At that time you will strike and place your buy orders.
I hope you have a good Clarity on this Setup, simple and actionable with a good price action understanding.
Hit the Boost Button & Comment down your Doubts, Queries and ideas
Keep Learning,
Happy Trading.

KMEW is trading in a well-defined higher high–higher low structuNSE:KMEW is trading in a well-defined higher high–higher low structure on the weekly timeframe, indicating a strong primary uptrend. Price has respected the rising trendline support multiple times, confirming the validity of the trend.
After a strong impulse move, the stock is currently undergoing a healthy pullback / consolidation near the trendline, which often acts as a demand zone in trending markets. There is no significant breakdown structure, suggesting this move is a pause rather than a reversal.
Volume expansion during the up-move followed by controlled volume during the pullback indicates lack of aggressive selling pressure. RSI remains in the bullish zone (above 60), supporting continuation bias.
As long as price holds above the rising trendline, the structure favors a trend continuation towards higher levels.

$NSE:APLAPOLLO Breakout Retest from Long-Term Resistance NSE:APLAPOLLO has recently broken out above a long-term resistance zone on the weekly timeframe, marking a structural shift from consolidation to uptrend. The highlighted zone had previously acted as a strong supply area, rejecting price multiple times in the past.
Post breakout, the stock is currently undergoing a controlled pullback / retest into the breakout zone, which is now acting as support (role reversal). Price action during the retest remains stable, with no aggressive selling pressure, indicating absorption of supply and strong demand at higher levels.
Volume expansion during the breakout phase followed by relatively lower volume during the pullback supports the view that this move is a healthy retest rather than a failed breakout. RSI continues to remain in the bullish range, suggesting momentum is intact.
As long as price holds above the breakout support zone, the structure favors a bullish continuation towards higher targets.

DSSL TECHNOFUNDA STOCK REVERSALStock is attempting a trend reversal after a long downtrend, with a descending trendline breakout followed by a retest near key support and forming higher highs

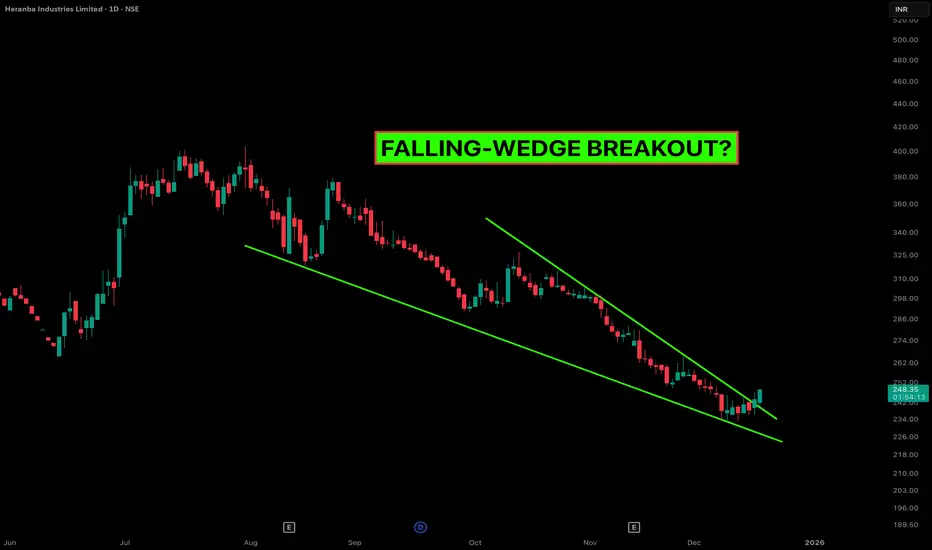
Heranba Industries: Why Falling Wedges Often Mark the BottomThe Setup Heranba Industries (NSE: HERANBA) has been in a corrective phase for months, but the structure has now matured into a classic Falling Wedge Pattern on the Daily timeframe.
For those new to this pattern: A Falling Wedge is a bullish reversal pattern. It is characterized by "Lower Highs" and "Lower Lows" contracting into a narrower range. This contraction signals that selling pressure is exhausting and buyers are stepping in at higher relative lows.
Technical Breakdown:
Price Action: The price has respected the upper trendline resistance multiple times. The recent breakout candle suggests a shift in momentum.
The Psychology: Notice how the selling waves are getting shorter? This "compression" usually precedes an expansion in volatility (the breakout).
Volume Profile: We are looking for a spike in volume to confirm the breakout validity. A low-volume breakout is often a trap, so watch the close.
Trade Management (Educational View):
Aggressive Entry: On the immediate break of the upper trendline (Current Levels: ~247-248).
Conservative Entry: Waiting for a "Retest" of the trendline around 240-242 to confirm support.
Stop Loss: Strictly below the recent swing low (invalidate the pattern if price falls back into the wedge).
Targets: The theoretical target of a wedge is often the top of the wedge structure (the origin of the pattern).
Risological Note: We track these compression patterns because they offer high Risk-to-Reward ratios. We are not predicting the future; we are reacting to probability.
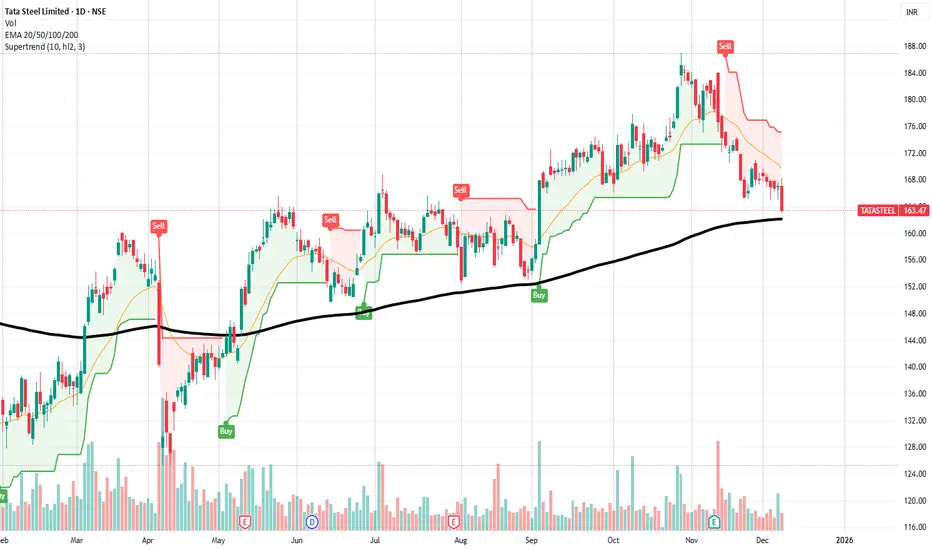
Tata Steel | 200 EMA Support + MACD Bullish Setup | Perfect std.Tata Steel has entered a high-probability reversal zone, combining multiple technical signals that traders often use to identify strong opportunities.
1. Price Sitting Exactly on 200 EMA (Major Trend Support)
The stock has reached the 200 EMA, a long-term trend indicator that acts as strong dynamic support.
From the chart, the last 3 touches to the 200 EMA (May, June & September) resulted in sharp upward reversals.
This increases the probability that buyers may step in again at this level.
------------------------------------------------------------------
2. MACD Close to Bullish Crossover
The MACD histogram is reducing red bars and is moving toward the zero line, indicating that selling pressure is cooling down.
A bullish crossover near a major support often marks the beginning of an upswing in momentum.
------------------------------------------------------------------
3. Stock Appears Short-Term Oversold
Price is stretched away from the short-term moving averages (20 & 50 EMA), and recent candles show slowing selling pressure.
This supports the idea of a bounce or trend reversal from the current zone.
------------------------------------------------------------------
4. Supertrend Still in Sell but Losing Momentum
Supertrend remains red, but the fall has slowed significantly.
A close above 170–172 will flip Supertrend to Buy, confirming the reversal.
Support Zones
162–164 → 200 EMA support zone
158 → Last horizontal support (critical)
Resistance Zones
170 → Short-term resistance (20 EMA)
176–178 → Strong reversal confirmation zone
185 → Major swing resistance
📈 Possible Bullish Scenario (Primary View)
If the price holds above 162–164 and MACD turns positive:
Targets: 170 | 176–178 | 185 | Stop-loss: Below 160 (Daily close)
📝 Notes (Important for Traders)
This is a technical analysis idea, not a buy/sell recommendation.
Risk management is important: adjust SL according to your trading style.
INOXWIND Accumulation Zone – High Probability Upside Reversal INOXWIND is approaching a high-probability bullish reversal zone.
Price is currently sitting at long-term horizontal support while compressing inside a falling triangle pattern. This area has previously acted as a strong demand zone.
Key Bullish Signals:
🔹 1. Price near major support + triangle apex
The price is holding above long-term support and squeezing toward the triangle’s end — a zone where breakouts or sharp reversals often happen.
🔹 2. RSI deeply oversold (near 28–30)
RSI is at levels where previous reversals occurred, showing sellers are exhausted and downside momentum is weakening.
🔹 3. MACD losing bearish strength
The MACD histogram is flattening and the lines are preparing for a potential bullish crossover, indicating the downtrend is weakening.
🔹 4. Tight price compression forming a “price pipe”
Price action is tightening, which often precedes a volatile move — and with indicators oversold, the probability favors an upside bounce.
🎯 Bullish Expectation
If the support holds, INOXWIND may show a sharp relief rally toward:
₹140
₹150 trendline
And possibly higher if volume supports a breakout.
⚠️ Risk Disclaimer
Support breakdown below ₹130 will invalidate the bullish setup.
This is a study of chart behavior and probability only — not a buy/sell recommendation. Always do your own research and manage risk.

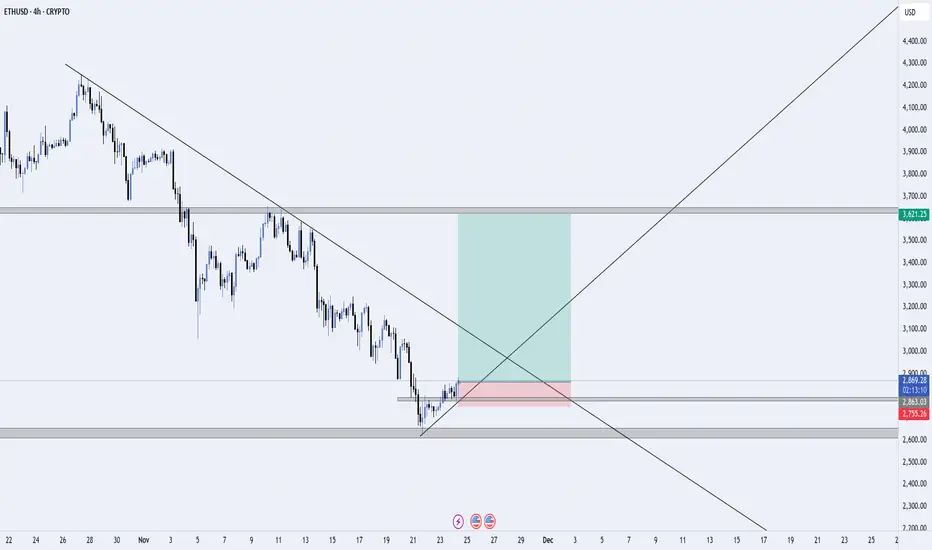
ETH/USD – Trendline Breakout Attempt from Higher-Timeframe DemanETH/USD is reacting strongly from a major 4H demand zone after an extended downtrend. Price has tapped into a high-volume area between $2,760–$2,800, showing the first signs of bullish strength with a clean internal structure shift.
📌 Setup Overview
Price respected a long-term descending trendline, but buyers stepped in strongly at the higher-timeframe demand zone.
A short-term structure break (BOS) suggests a potential reversal beginning to form.
Market is now retesting the broken structure + mini demand zone, where buyers are likely to defend.
🎯 Trade Plan
Entry: After the retest confirmation of the minor demand zone.
Stop-loss: Below the demand area to protect against liquidity sweeps.
Target: The next major supply zone around $3,600, aligning with the larger structure and trendline interaction.
📈 Bias
Bullish short-term — expecting continuation to the upside if price holds above the retest zone.
Structure suggests a potential mid-term trend reversal if buyers maintain control.
❌ Invalidation
Idea becomes invalid if price closes below the demand zone and breaks structure to the downside.
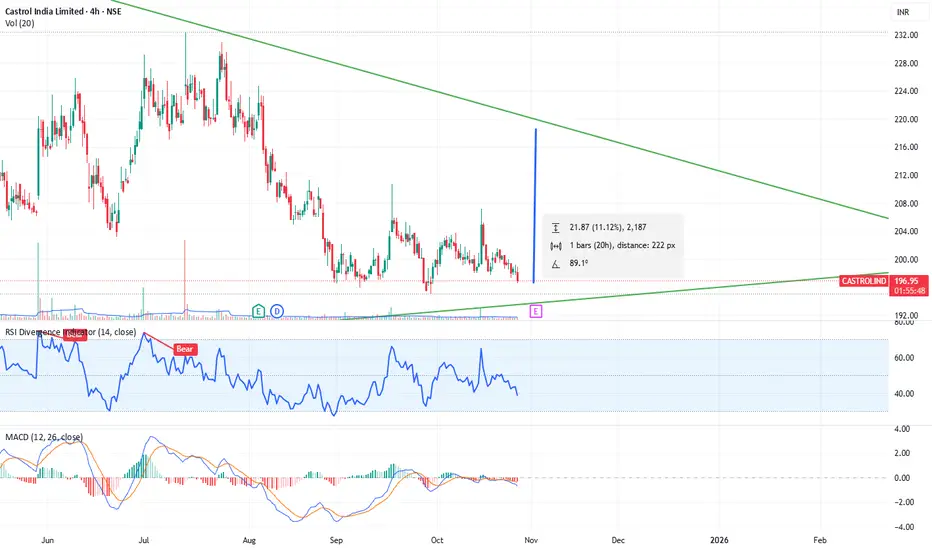
Castrol India (NSE: CASTROLIND) – Bullish Study Idea🧩 Chart Pattern:
Price is consolidating within a descending triangle and forming a strong base near ₹190–₹192.
A breakout above ₹202–₹204 could trigger a trend reversal and a potential 10% short-term rally.
📊 Technical View:
Trendline Resistance: ₹202–₹204
Support Zone: ₹190–₹192
RSI: Around 40, showing momentum buildup after consolidation
MACD: Flattening near zero — early signs of possible bullish crossover
Volume: Decreasing during consolidation — breakout volume will confirm direction
This analysis is for educational purposes only.
Not financial advice — do your own research or consult your advisor before trading.
Double Top in SilverEntry- 143000-143200
Target- 142000, 141500, 141200
SL- Day high
Pattern - Double Top has been made in MCX silver and Comex silver in 1 hr and 15 min time frame.
Disclaimer- This is just for educational purpose.
Jai Shree Ram.

ETH BIG HAMMERAfter good correction ETH has made a hammer at the previous liquidity zone (Support).
One can look for Buy on dip from here on in ETH.
SL- 4070
Target- 4300, 4370, 4400
Disclaimer- This is just for Education Purpose.
Follow for mor such content and learnings.
Jai Shree Ram.

XAU/USD SD + OTE + Fractal Reversal TradeHey traders!
Here you can see all the trades taken by me in accordance with some major concepts of ICT.
1. OTE - Optimal Trade Entry
2. SD - Standard Deviation
3. Fractal Nature - If you can't find a pattern on the HTF, you'll surely find something on the LTF and vice versa. For example:
- The SELL entry over here, we had an FVG on the 5 min TF , there was no other valid level to short the markets.
- The other BUY Entries were taken on HTFs , and gave us very good targets as well!
Standard Deviations when combined with PD arrays , work like a charm and can be used as targets for LTF trades and reversals for HTF trades.
Hope you learned something today!
Share your analysis as well in the comments!

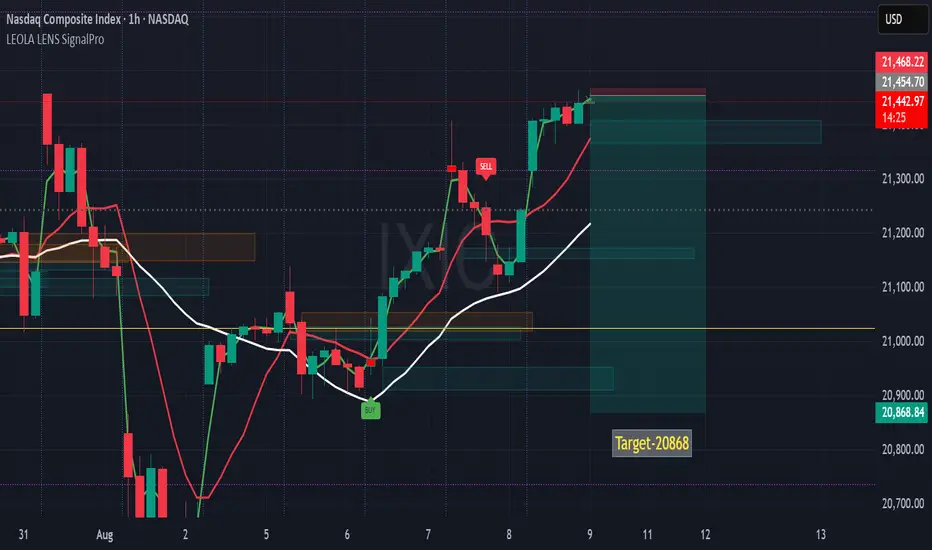
NASDAQ Composite (IXIC)- 1hr Reversal Setup Targeting 20,868This 1-hour chart shows a potential short-term reversal on the NASDAQ Composite, identified using Leola Lens SignalPro.
🔍 Technical Notes:
🟢 Price recently tested the upper red supply zone near 21,454, where prior SELL pressure emerged.
⚪ The white trendline (mid-term bias) is still below price, suggesting a test of resilience before reversal.
🔴 Multiple rejections near the supply zone may hint at exhaustion of buying momentum.
📉 Target: 20,868 — aligning with a prior structural pivot and liquidity zone.
🟡 Watch for confirmation via lower timeframe breakdowns before any continuation lower.
The setup reflects a possible supply-zone reaction after an extended rally, with a measured move toward a lower support zone.
⚠️ Disclaimer:
This analysis is for educational purposes only and should not be taken as financial advice. Always do your own research and consult a licensed financial advisor before making any trading decisions.
YES BANK-liquidity grab before the big move📉 Short-Term: Head & Shoulders breakdown likely. Price may drop to take seller liquidity below ₹13.62–₹11.17.
📈 Long-Term: Strong reversal expected from ₹9.61–₹11.17 (Institutional Demand Zone) toward ₹30+.
🔹 Swing Trade Path (Blue): Weak buy → 50% retracement targets.
🔺 Investment Path (Red): Strong buy in reversal zone → ride to ₹31.18.
📍 Key Levels:
Support – ₹13.62, ₹11.17, ₹9.61
Resistance – ₹19.55, ₹23.72, ₹31.18
⚠️ Not Financial Advice – Trade wisely!

Gold LongEntry- 3355-3352
SL- 3349
Target- 3368, 3370, 3375
Reason- Gold has broken out of a falling trendline in 1hr TF with a strong candle. News is also there that trump is not going to put tariff on gold bars.
Disclaimer- This is just for educational purposes please take advice before making any decision.
Jai Shree Ram.

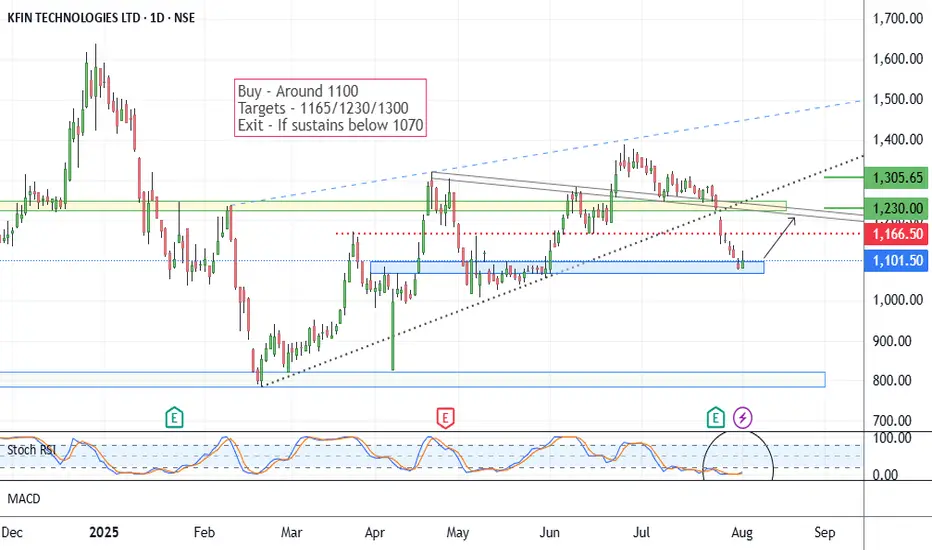
Kfintech - Positional Long SetupIn the last month of July, the stock price fell from 1380 to 1100. Presently seems on a support area. As you may see on the chart. This setup is based on a reversal possibility from the support range around 1080.
Stochastic RSI shows a reversal sign.
Possible targets may be 1165/1230 and 1305.
If it sustains below 1070-1050 levels, the setup will go weak. Below 1070, the exit plan should be considered.
One has to keep the position size according to the risk management.
All these illustrations are my personal view, only for learning and observation purposes; this is not buying or selling advice.
All the best.
GBPJPY Short Setup- Momentum Rejection from ResistanceThis chart explores a potential short opportunity in GBPJPY on the 15-minute timeframe following a visible loss of bullish momentum near the upper structure.
🔍 Key Observations:
Sell Labels appeared after a strong upside move, near a key resistance zone.
A Caution Marker was triggered near the high — typically indicates a potential trend exhaustion.
Price lost support from short-term moving averages and began to trade below them.
A downside continuation setup is now active with price targeting prior demand levels.
🎯 Target Area:
A previous structure low and untested support zone around 197.699 is being monitored as a potential target, pending continued bearish momentum.
🧠 Educational Notes:
This idea highlights how momentum-based tools can help identify potential intraday turning points. The confluence of resistance rejection, caution labeling, and sell signals offers a clean example of short-term reversal structure.
⏱ Timeframe:
15-Minute (Intraday)

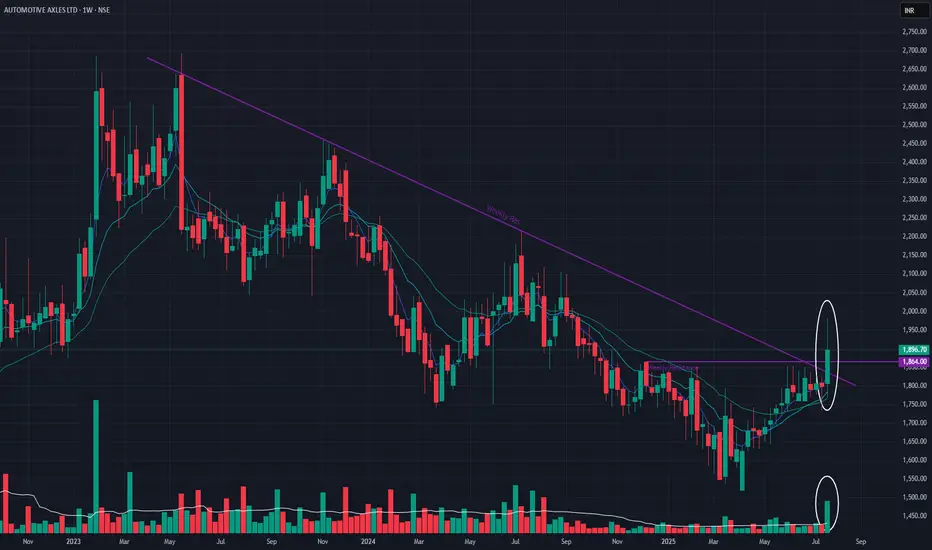
Automotive Axles Ltd (Weekly Timeframe) - Potential Reversal ??After the Double Top formation (May 15, 2023) in weekly timeframe, the stock has been in a downtrend. With this week's price action, the stock seems to BreakOut of a Weekly resistance zone with good volume. EMAs are also in positive state.
A Long-term angular resistance BreakOut along with Short-term resistance BreakOut makes this more significant to consider as a reversal sign. Watchout for next week's price action to determine if the reversal signs are intact or not. If it does, then the next target maybe 2,100.
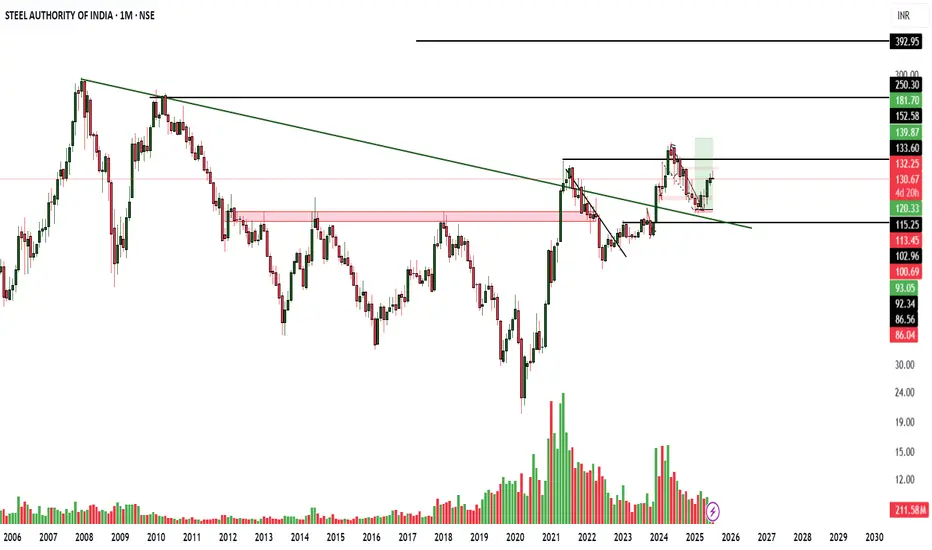
SAIL Breakout + Dividend & Earnings Alert! SAIL has climbed steadily from the ₹100–₹102 support zone and recently broke out of a falling trendline, backed by rising volume—signaling renewed bullish energy.
📈 Technical Snapshot:
Resistance: ₹132–₹133
Breakout Targets: ₹139 → ₹152 → ₹181
Potential Retrace Zone: ₹120–₹115 if it fails near resistance
💸 Dividend Alert:
SAIL typically pays regular dividends. The board recommended a final dividend in May 2025, and the ex-dividend date was around mid-September 2024. Watch the next announcement closely to avoid missing out.
📅 Upcoming Earnings / Shareholder Events:
Q1 FY2026 results are scheduled for July 25, 2025 (board meeting to approve results)
Earnings call expected on July 28, 2025, in the afternoon IST
⚙️ Trade Setup:
Entry Trigger: Break and close above ₹133.60
Stop Loss: Below ₹120
Target Zones: ₹139–₹152
Monitor: Volume trends, dividend confirmation, earnings surprises, and price reaction post-earnings
⚠️ Not financial advice—trade with your risk plan in mind.
💬 Drop your views—Buy for dividend, swing for breakout, or play safe?
Trendline BreakoutA trendline breakout occurs when the price of an asset moves decisievly above a downward- sloping trendline, potentially signalling a change in the prevaling trend.
Entry at around 190
with stop loss of 180 we can target 207 one it closes above 196.

Alembic Ltd – Inverted Flag Pattern Forming | Breakout Trade SetAlembic Ltd appears to be forming a classic inverted flag pattern on the daily chart:
Bearish Flagpole: A strong and sharp downward move from ~₹148 to ₹88 established the flagpole.
Bullish Flag (Retracement Channel): Since March, the price has been moving in a parallel rising channel — a typical retracement phase.
The price is currently near the lower trendline of the flag, suggesting a potential entry point for a breakout trade.
Support zone : Around ₹100–₹101 near the lower channel boundary.
Target: ₹113–₹115 (upper boundary of the flag channel).
Stop-Loss: Below the lower trendline of the flag (~₹96), or tighter based on risk preference.
Bias:
Neutral to slightly bullish in the short term as long as price stays within the flag.
Watch for a volume-supported breakout above recent swing highs (~₹105) to confirm momentum toward the target.
